| Param | Original file | Final file |
|---|---|---|
| Filename | modeM0/AS1A04_143T01_9000002344_15844cztM0_level2.evt | modeM0/AS1A04_143T01_9000002344_15844cztM0_level2_quad_clean.evt |
| Size (bytes) | 1,463,215,680 | 228,337,920 |
| Size | 1.4 GB | 217.8 MB |
| Events in quadrant A | 12,505,019 | 1,348,277 |
| Events in quadrant B | 10,417,463 | 1,425,069 |
| Events in quadrant C | 10,106,901 | 1,363,704 |
| Events in quadrant D | 9,879,251 | 1,346,759 |
| Mode SS | |||
|---|---|---|---|
| Quadrant | BADHDUFLAG | Total packets | Discarded packets |
| A | 0 | 424 | 0 |
| B | 0 | 424 | 0 |
| C | 0 | 424 | 0 |
| D | 0 | 424 | 0 |
| Mode M0 | |||
|---|---|---|---|
| Quadrant | BADHDUFLAG | Total packets | Discarded packets |
| A | 0 | 50793 | 7 |
| B | 0 | 44413 | 5 |
| C | 0 | 43171 | 5 |
| D | 0 | 44017 | 5 |
| Mode M9 | |||
|---|---|---|---|
| Quadrant | BADHDUFLAG | Total packets | Discarded packets |
| A | 0 | 19 | 0 |
| B | 0 | 19 | 0 |
| C | 0 | 19 | 0 |
| D | 0 | 19 | 0 |
| Quadrant | Total seconds | Saturated seconds | Saturation percentage |
|---|---|---|---|
| A | 20766 | 1278 | 6.154291% |
| B | 20766 | 595 | 2.865261% |
| C | 20766 | 609 | 2.932678% |
| D | 20766 | 541 | 2.605220% |
Noise dominated data is calculated using 1-second bins in cleaned event files. If a bin has >2000 counts, and if more than 50% of those come from <1% of pixels, then it is considered to be noise-dominated and hence unusable.
| Quadrant | # 1 sec bins | Bins with >0 counts | Bins with >2000 counts | High rate bins dominated by noise | Noise dominated (total time) | Noise dominated (detector-on time) | Marked lightcurve |
|---|---|---|---|---|---|---|---|
| A | 38073 | 20772 | 582 | 582 | 1.53% | 2.80% | 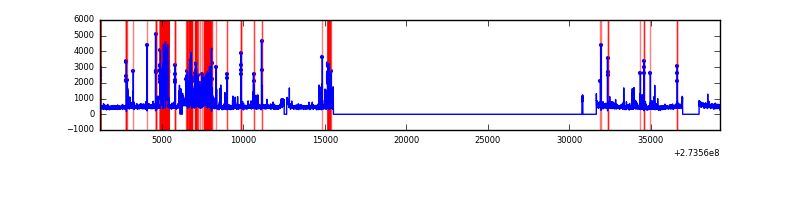 |
| B | 38073 | 20773 | 10 | 10 | 0.03% | 0.05% | 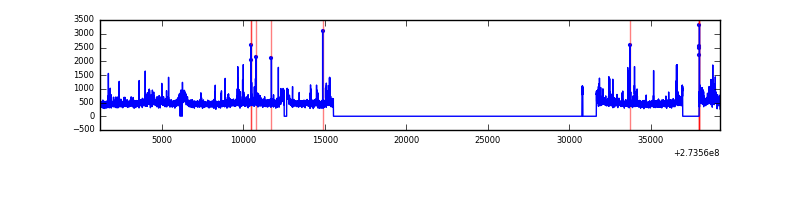 |
| C | 38073 | 20772 | 2 | 2 | 0.01% | 0.01% | 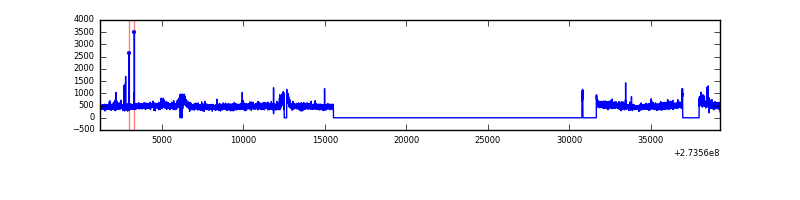 |
| D | 38073 | 20772 | 60 | 60 | 0.16% | 0.29% | 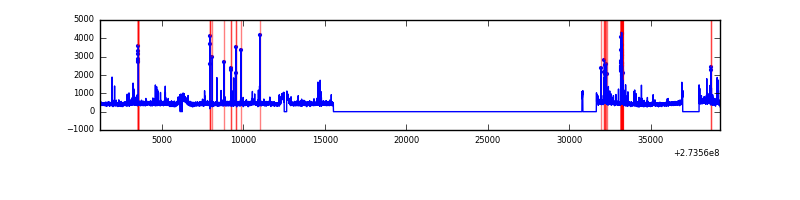 |
Top three noisy pixels from each quadrant. If the there are fewer than three noisy pixels in the level2.evt file, extra rows are filled as -1
| Pixel properties | Quadrant properties | ||||||
|---|---|---|---|---|---|---|---|
| Quadrant | DetID | PixID | Counts | Sigma | Mean | Median | Sigma |
| A | 15 | 239 | 2726417 | 5392.53 | 2500 | 2442 | 505.1 |
| A | 9 | 143 | 67262 | 128.32 | 2500 | 2442 | 505.1 |
| A | 15 | 157 | 50665 | 95.46 | 2500 | 2442 | 505.1 |
| B | 4 | 216 | 162227 | 328.54 | 2535 | 2470 | 486.3 |
| B | 3 | 209 | 91548 | 183.19 | 2535 | 2470 | 486.3 |
| B | 4 | 173 | 80655 | 160.79 | 2535 | 2470 | 486.3 |
| C | 14 | 238 | 371139 | 643.84 | 2438 | 2448 | 572.6 |
| C | 7 | 247 | 141435 | 242.71 | 2438 | 2448 | 572.6 |
| C | 3 | 233 | 47043 | 77.88 | 2438 | 2448 | 572.6 |
| D | 1 | 52 | 319094 | 524.17 | 2487 | 2416 | 604.1 |
| D | 2 | 234 | 87225 | 140.38 | 2487 | 2416 | 604.1 |
| D | 10 | 70 | 35008 | 53.95 | 2487 | 2416 | 604.1 |
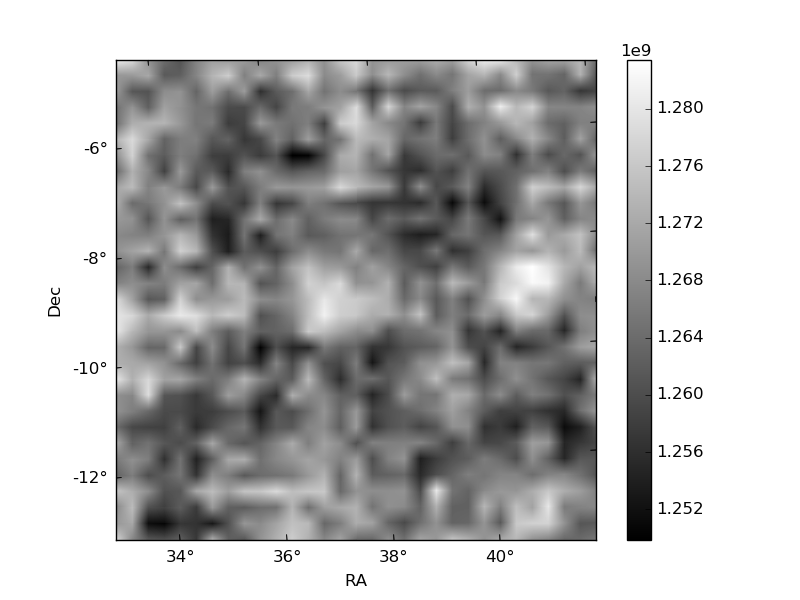
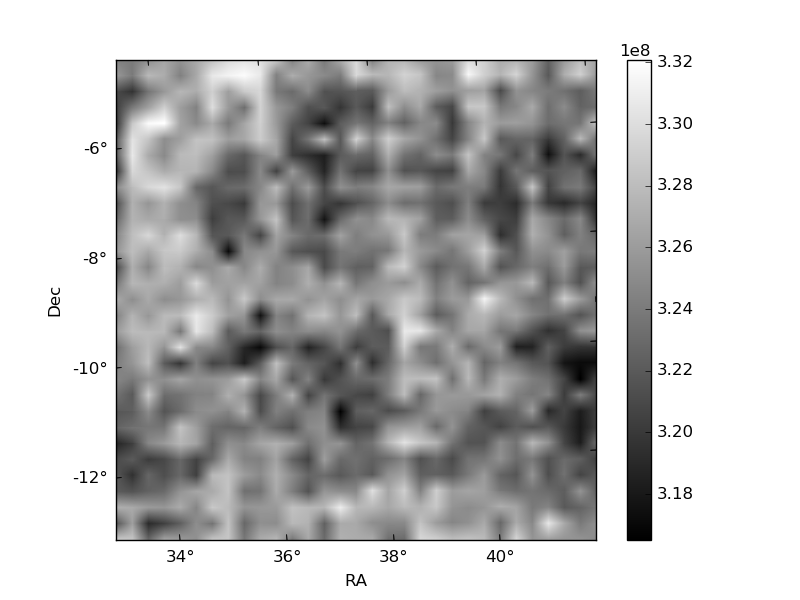
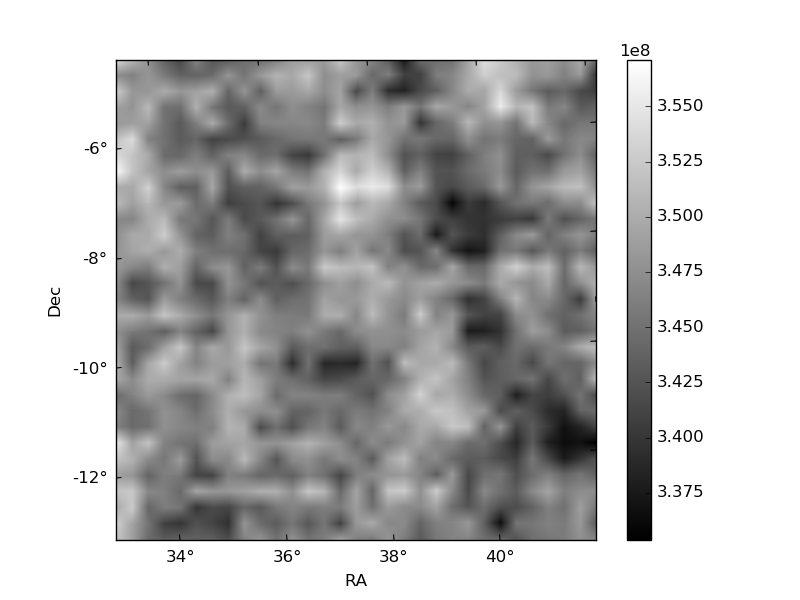
Histogram calculated using DETX and DETY for each event in the final _common_clean file
| Quadrant A | 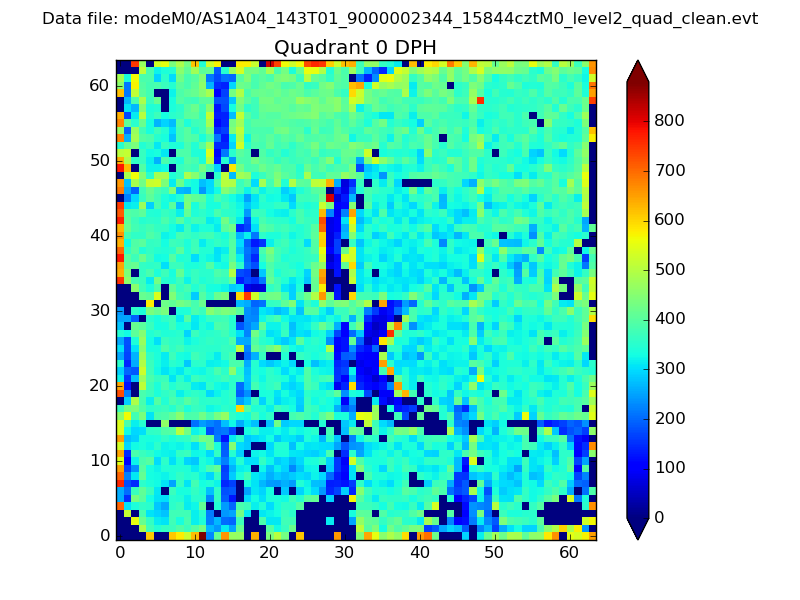 |
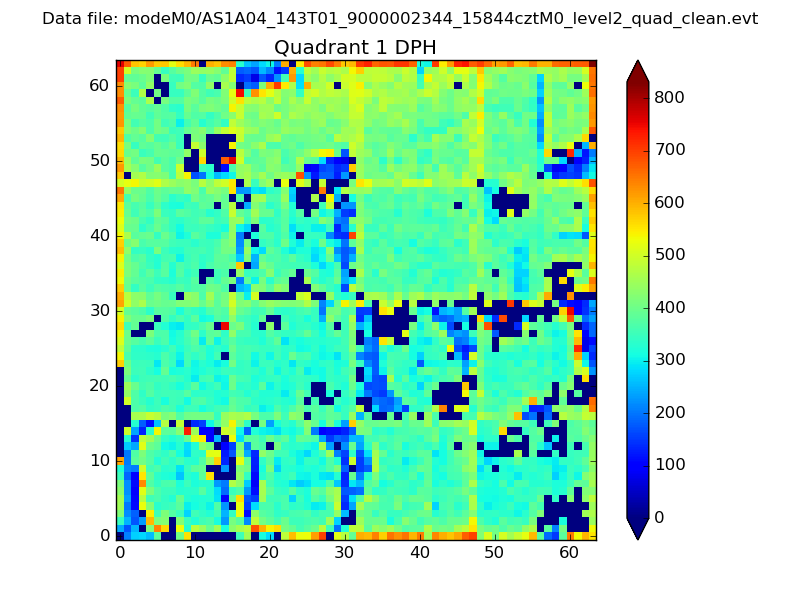 |
Quadrant B |
|---|---|---|---|
| Quadrant D | 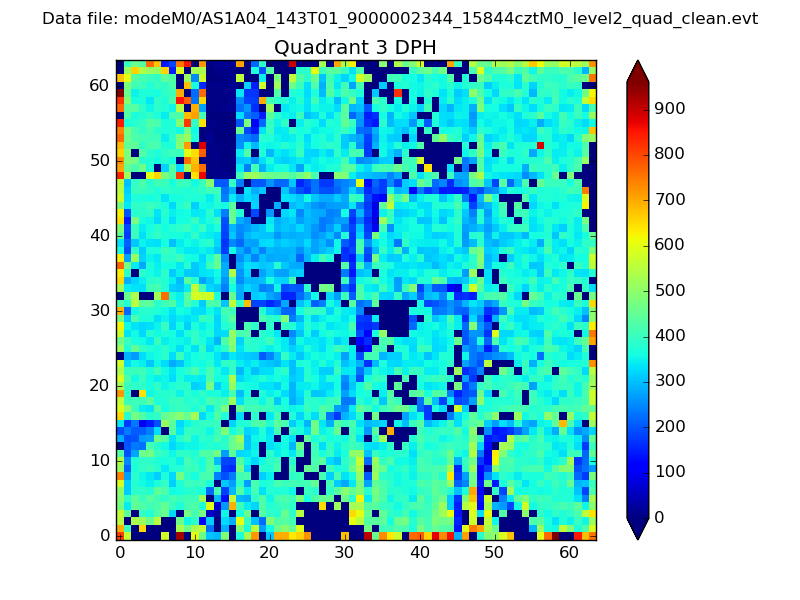 |
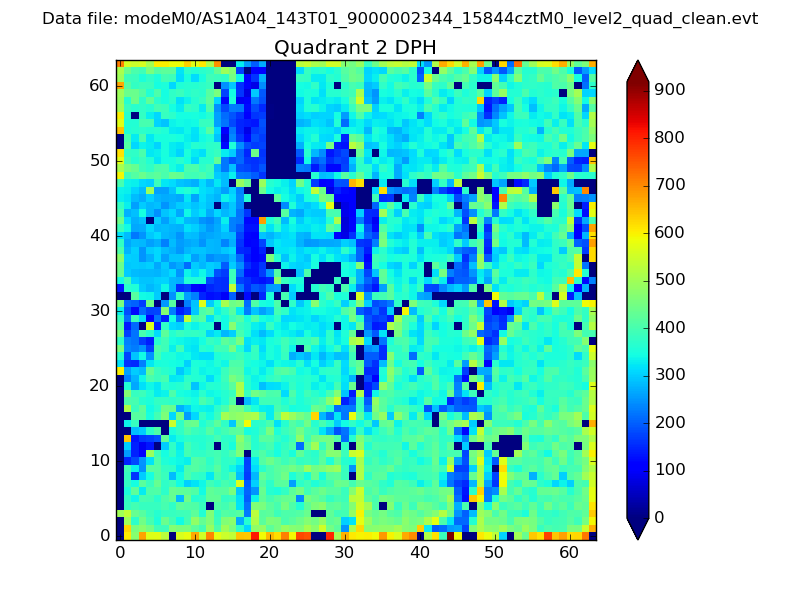 |
Quadrant C |
| Plot type | Count rate plots | Images |
|---|---|---|
| Comparison with Poisson distribution Blue bars denote a histogram of data divided into 1 sec bins. Red curve is a Poisson curve with rate = median count rate of data. |
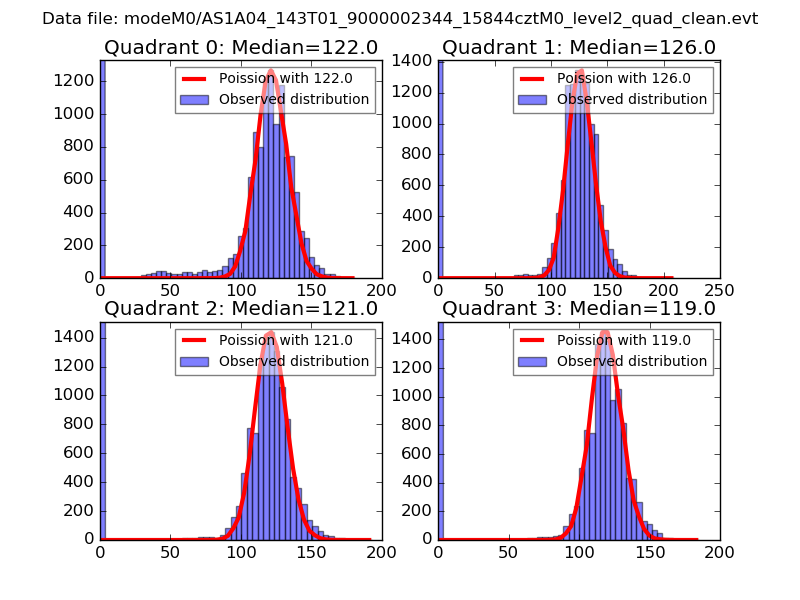 |
 |
| Quadrant-wise count rates Data is divided into 100 sec bins |
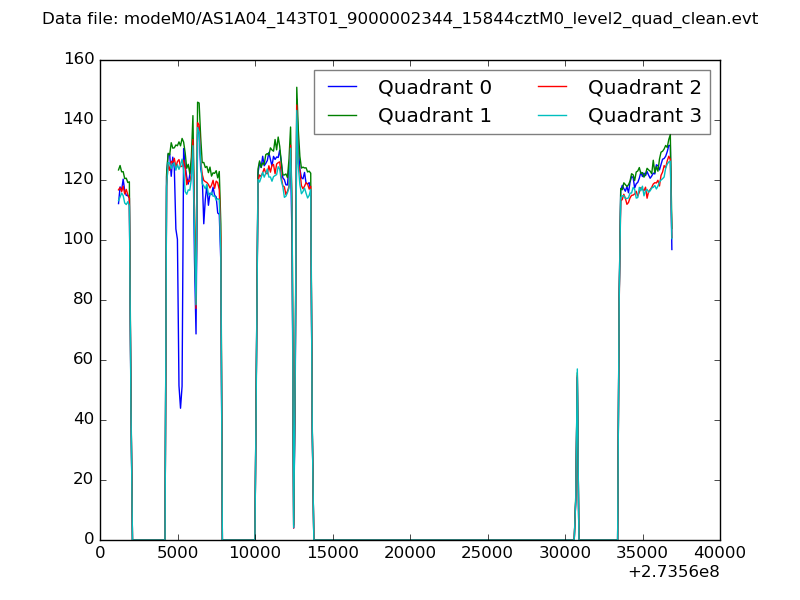 |
|
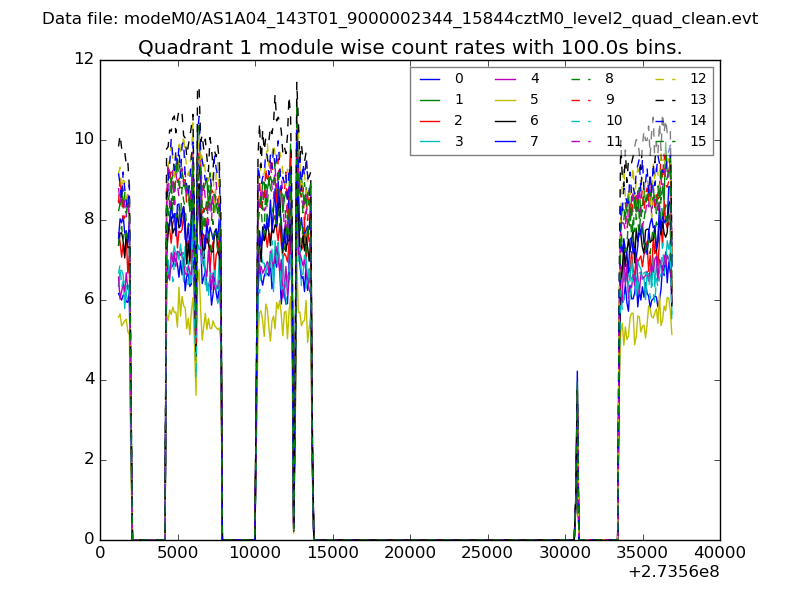
| Module-wise count rates for Quadrant A Data is divided into 100 sec bins |
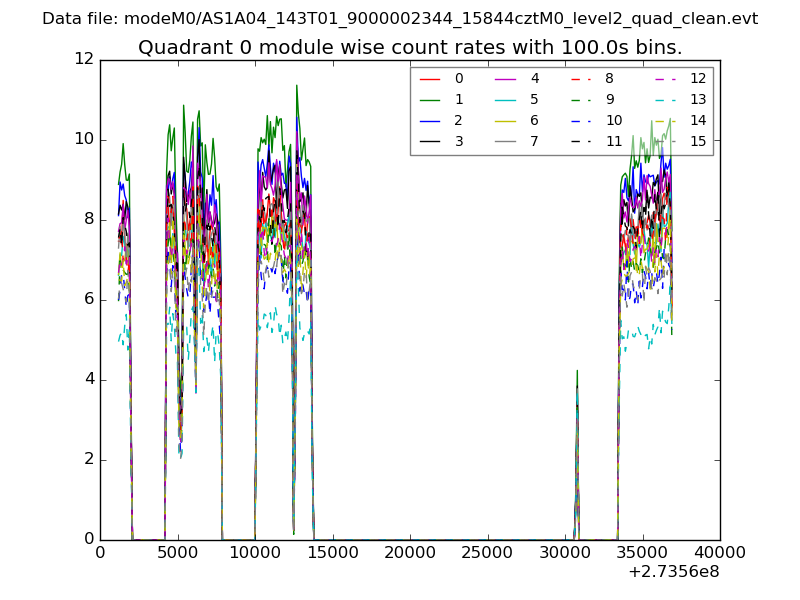 |
 |
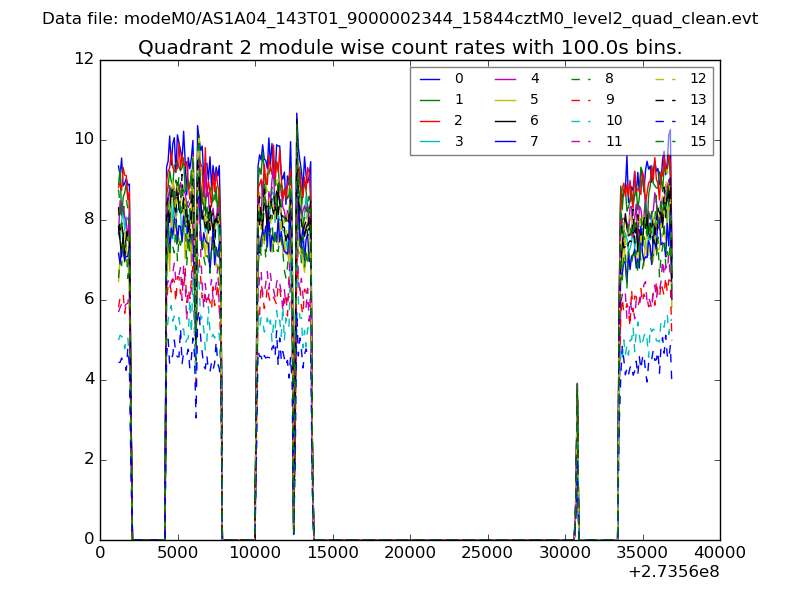
| Module-wise count rates for Quadrant B Data is divided into 100 sec bins |
 |
 |
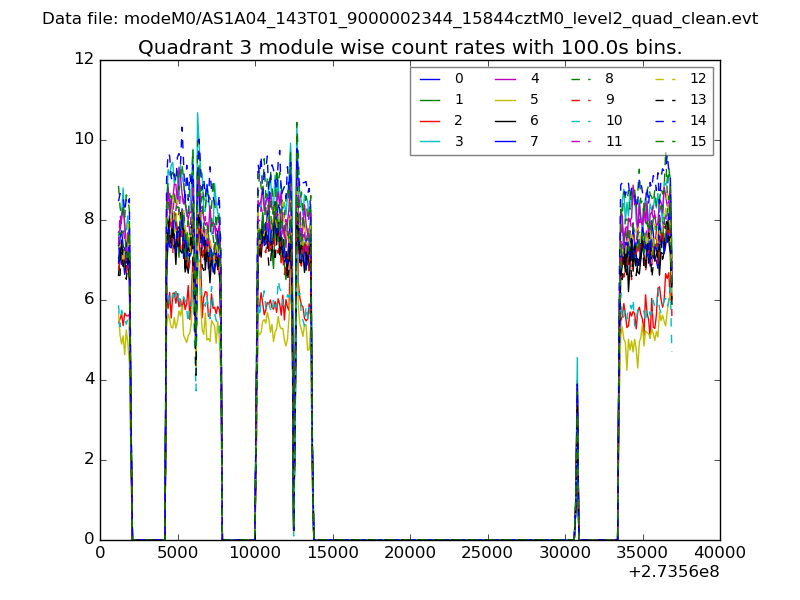
| Module-wise count rates for Quadrant C Data is divided into 100 sec bins |
 |
 |
| Module-wise count rates for Quadrant D Data is divided into 100 sec bins |
 |
 |
| Parameter | Plot |
|---|---|
| CZT HV Monitor | 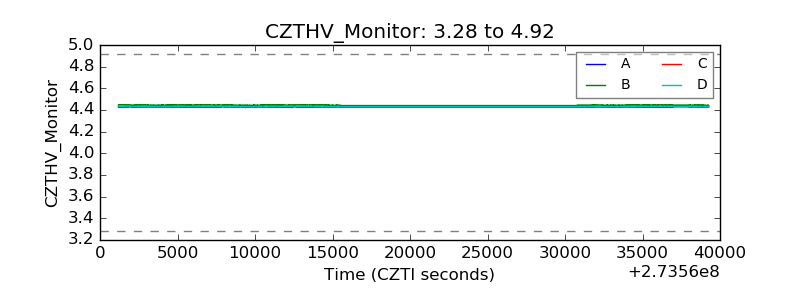 |
| D_VDD | 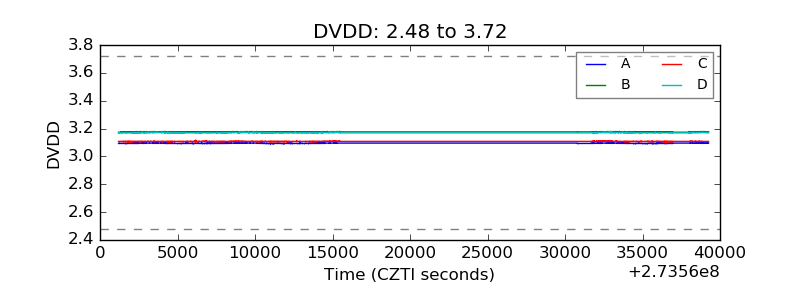 |
| Temperature 1 | 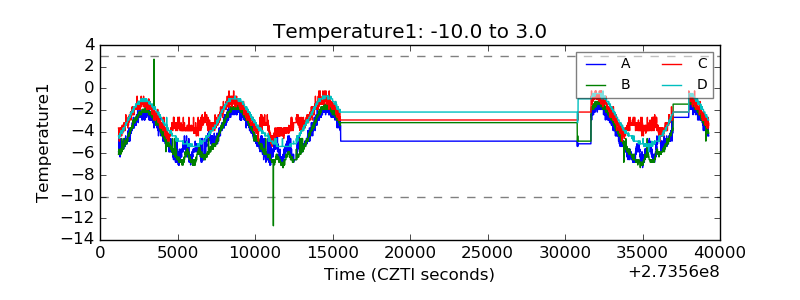 |
| Veto HV Monitor | 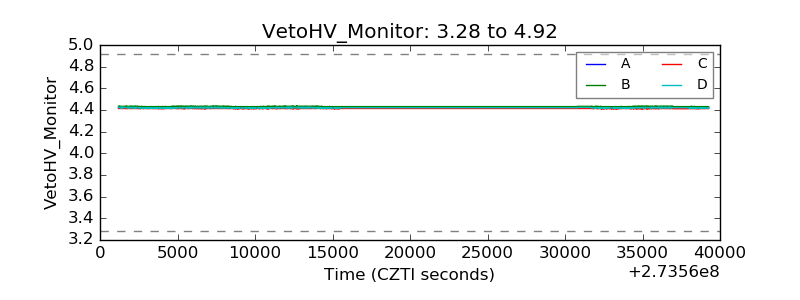 |
| Veto LLD | 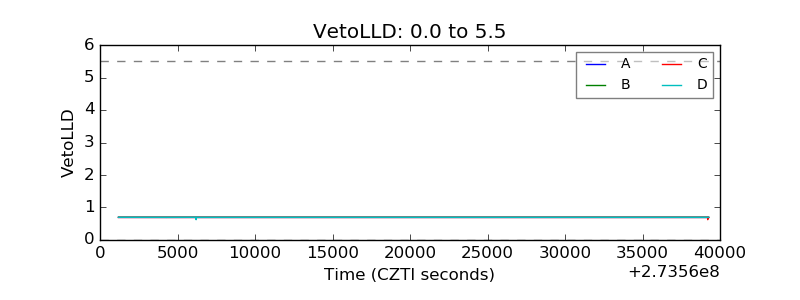 |
| Alpha Counter | 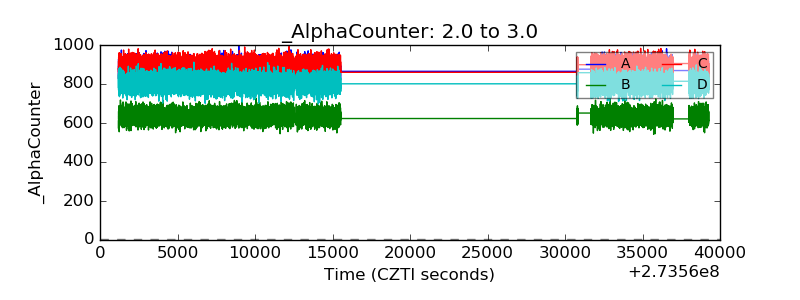 |
| _CPM_Rate | 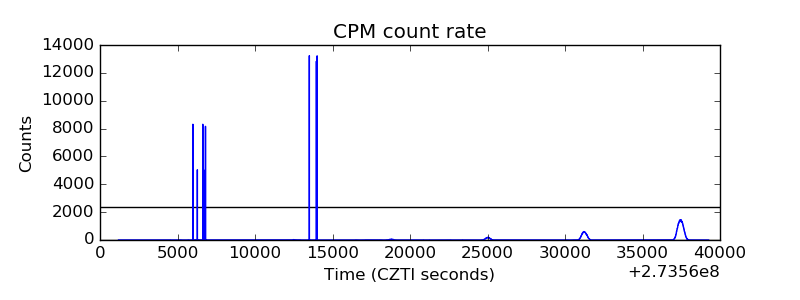 |
| CZT Counter | 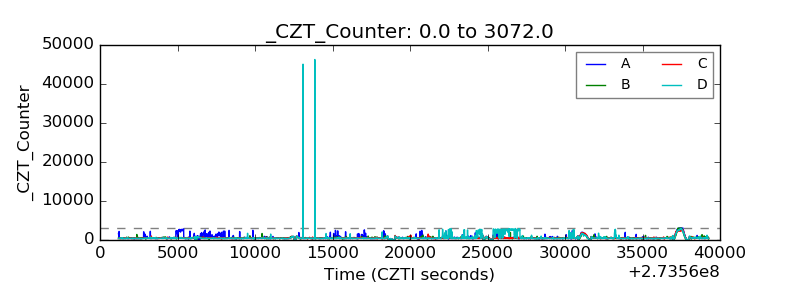 |
| +2.5 Volts monitor |  |
| +5 Volts monitor |  |
| _ROLL_ROT | 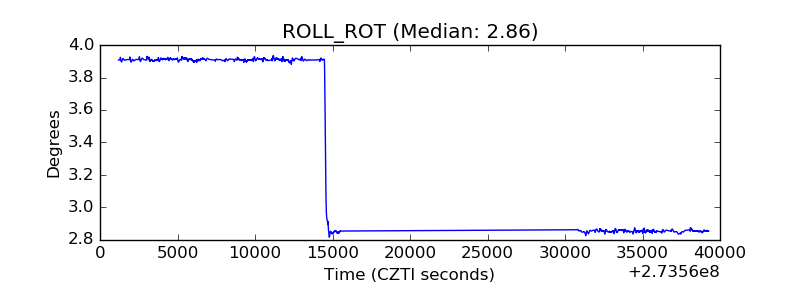 |
| _Roll_DEC |  |
| _Roll_RA | 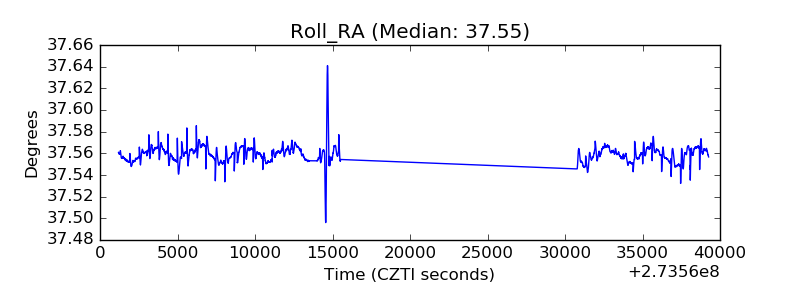 |
| Veto Counter | 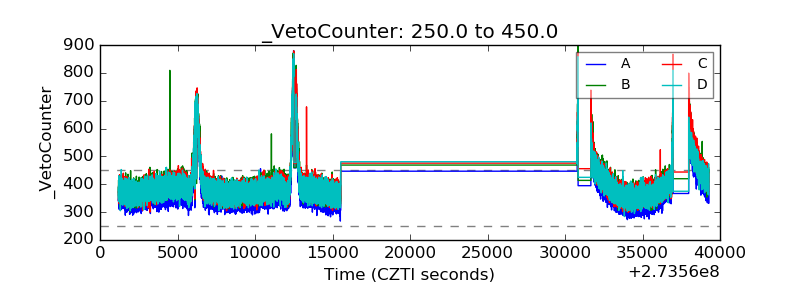 |