| Param | Original file | Final file |
|---|---|---|
| Filename | modeM0/AS1A04_143T01_9000002344_15847cztM0_level2.evt | modeM0/AS1A04_143T01_9000002344_15847cztM0_level2_quad_clean.evt |
| Size (bytes) | 465,001,920 | 86,783,040 |
| Size | 443.5 MB | 82.8 MB |
| Events in quadrant A | 3,911,070 | 549,763 |
| Events in quadrant B | 3,472,263 | 566,991 |
| Events in quadrant C | 3,222,175 | 543,362 |
| Events in quadrant D | 3,051,777 | 530,793 |
| Mode SS | |||
|---|---|---|---|
| Quadrant | BADHDUFLAG | Total packets | Discarded packets |
| A | 0 | 128 | 0 |
| B | 0 | 128 | 0 |
| C | 0 | 128 | 0 |
| D | 0 | 128 | 0 |
| Mode M0 | |||
|---|---|---|---|
| Quadrant | BADHDUFLAG | Total packets | Discarded packets |
| A | 0 | 15841 | 3 |
| B | 0 | 14582 | 2 |
| C | 0 | 13632 | 2 |
| D | 0 | 13236 | 2 |
| Mode M9 | |||
|---|---|---|---|
| Quadrant | BADHDUFLAG | Total packets | Discarded packets |
| A | 0 | 24 | 0 |
| B | 0 | 24 | 0 |
| C | 0 | 24 | 0 |
| D | 0 | 24 | 0 |
| Quadrant | Total seconds | Saturated seconds | Saturation percentage |
|---|---|---|---|
| A | 6267 | 204 | 3.255146% |
| B | 6267 | 115 | 1.835009% |
| C | 6267 | 102 | 1.627573% |
| D | 6267 | 44 | 0.702090% |
Noise dominated data is calculated using 1-second bins in cleaned event files. If a bin has >2000 counts, and if more than 50% of those come from <1% of pixels, then it is considered to be noise-dominated and hence unusable.
| Quadrant | # 1 sec bins | Bins with >0 counts | Bins with >2000 counts | High rate bins dominated by noise | Noise dominated (total time) | Noise dominated (detector-on time) | Marked lightcurve |
|---|---|---|---|---|---|---|---|
| A | 8658 | 6270 | 76 | 76 | 0.88% | 1.21% | 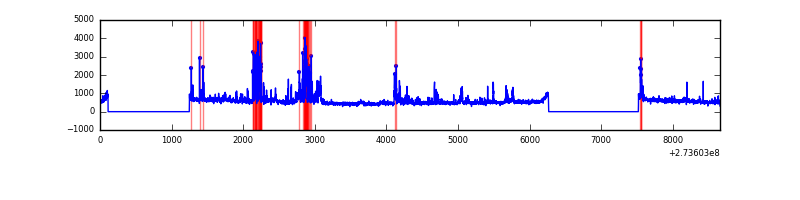 |
| B | 8658 | 6270 | 16 | 16 | 0.18% | 0.26% | 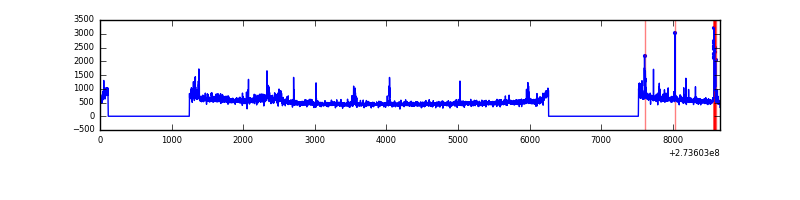 |
| C | 8658 | 6270 | 0 | 0 | 0.00% | 0.00% | 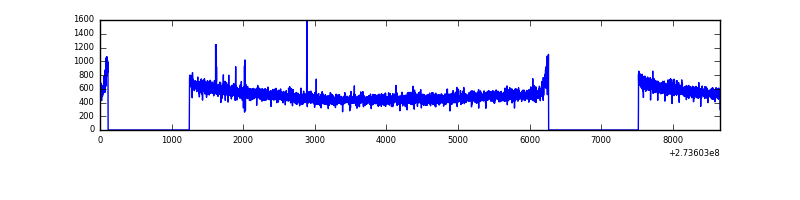 |
| D | 8658 | 6270 | 0 | 0 | 0.00% | 0.00% | 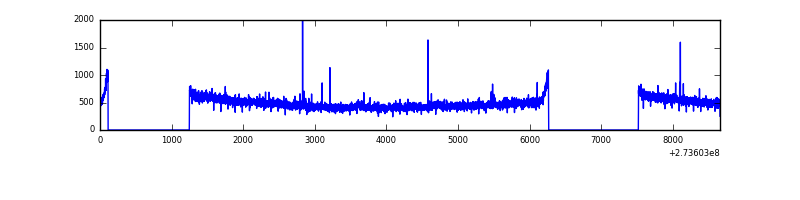 |
Top three noisy pixels from each quadrant. If the there are fewer than three noisy pixels in the level2.evt file, extra rows are filled as -1
| Pixel properties | Quadrant properties | ||||||
|---|---|---|---|---|---|---|---|
| Quadrant | DetID | PixID | Counts | Sigma | Mean | Median | Sigma |
| A | 15 | 239 | 504525 | 3098.21 | 809 | 793 | 162.6 |
| A | 15 | 157 | 279049 | 1711.42 | 809 | 793 | 162.6 |
| A | 9 | 143 | 8222 | 45.69 | 809 | 793 | 162.6 |
| B | 10 | 245 | 89051 | 569.34 | 822 | 803 | 155.0 |
| B | 4 | 173 | 84037 | 536.99 | 822 | 803 | 155.0 |
| B | 5 | 236 | 24412 | 152.32 | 822 | 803 | 155.0 |
| C | 14 | 238 | 123703 | 667.94 | 789 | 797 | 184.0 |
| C | 3 | 233 | 9568 | 47.67 | 789 | 797 | 184.0 |
| C | 10 | 22 | 9560 | 47.62 | 789 | 797 | 184.0 |
| D | 2 | 234 | 23774 | 118.33 | 798 | 776 | 194.4 |
| D | 2 | 69 | 12959 | 62.68 | 798 | 776 | 194.4 |
| D | 7 | 223 | 8998 | 42.3 | 798 | 776 | 194.4 |
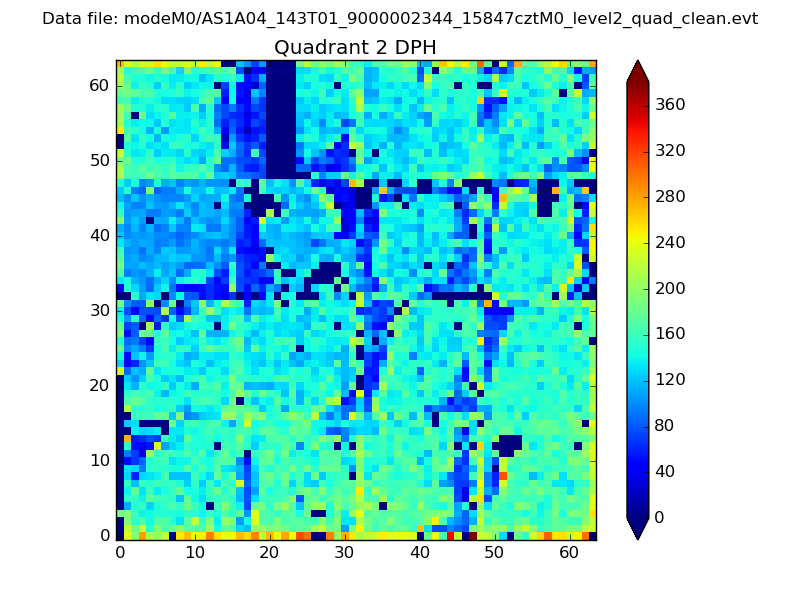
Histogram calculated using DETX and DETY for each event in the final _common_clean file
| Quadrant A | 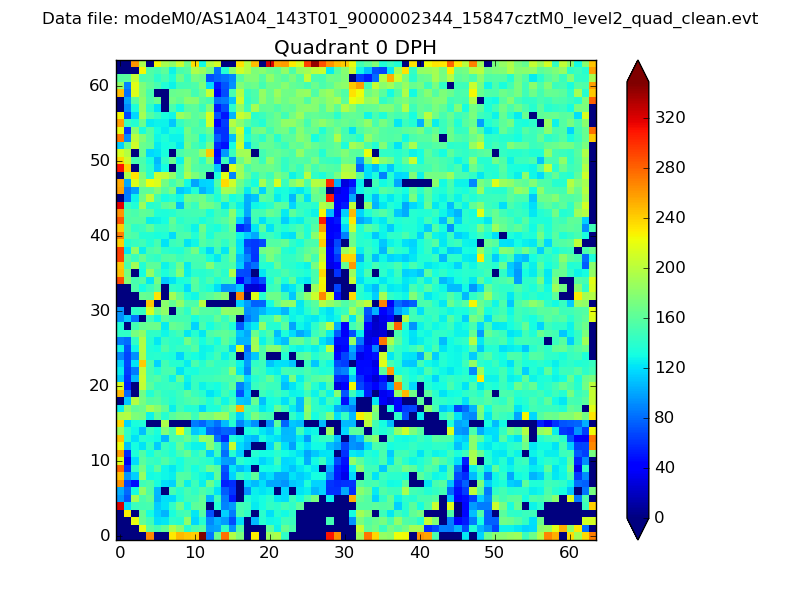 |
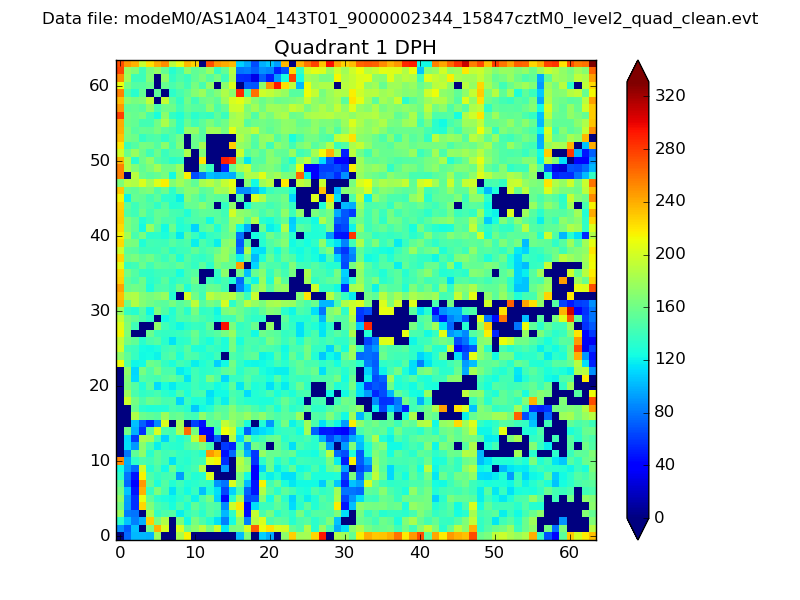 |
Quadrant B |
|---|---|---|---|
| Quadrant D | 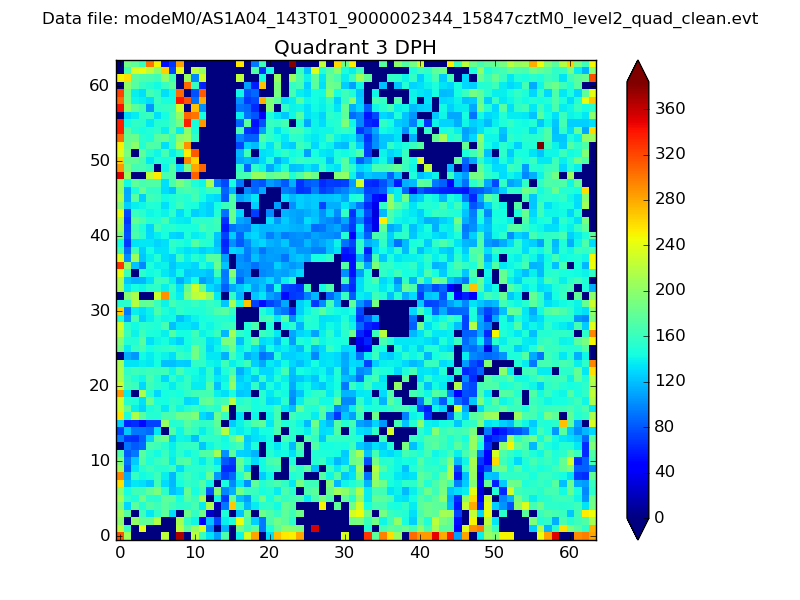 |
 |
Quadrant C |
| Plot type | Count rate plots | Images |
|---|---|---|
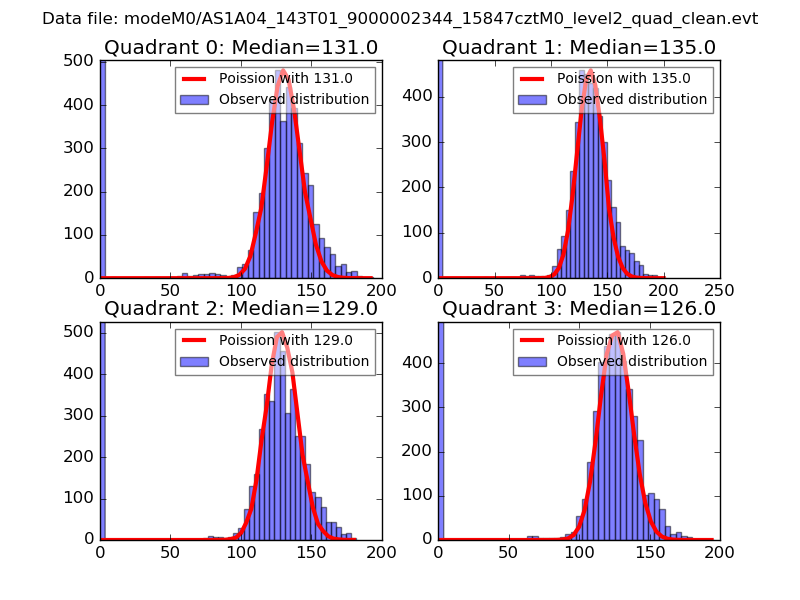
| Comparison with Poisson distribution Blue bars denote a histogram of data divided into 1 sec bins. Red curve is a Poisson curve with rate = median count rate of data. |
 |
 |
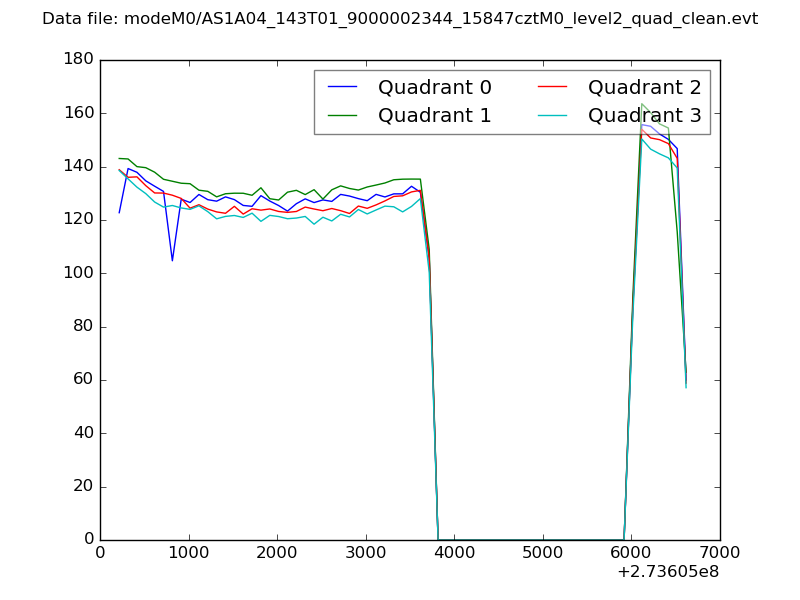
| Quadrant-wise count rates Data is divided into 100 sec bins |
 |
|
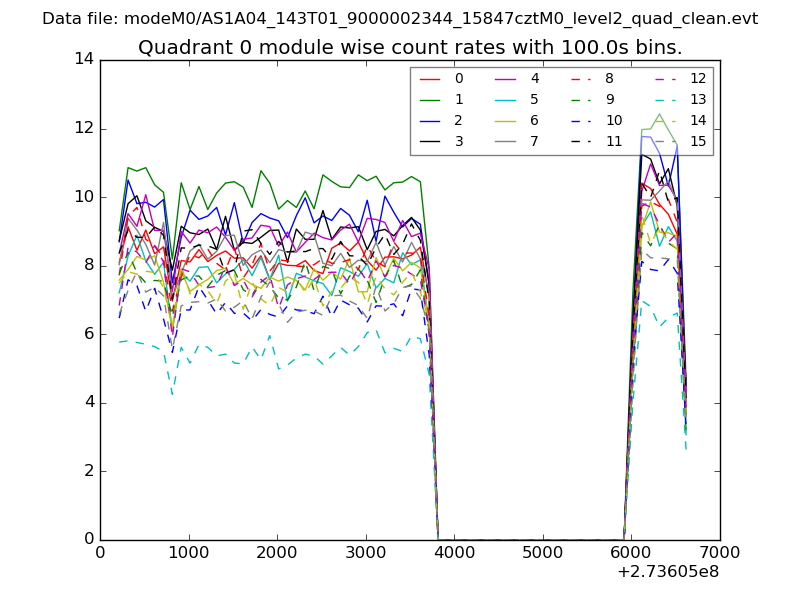
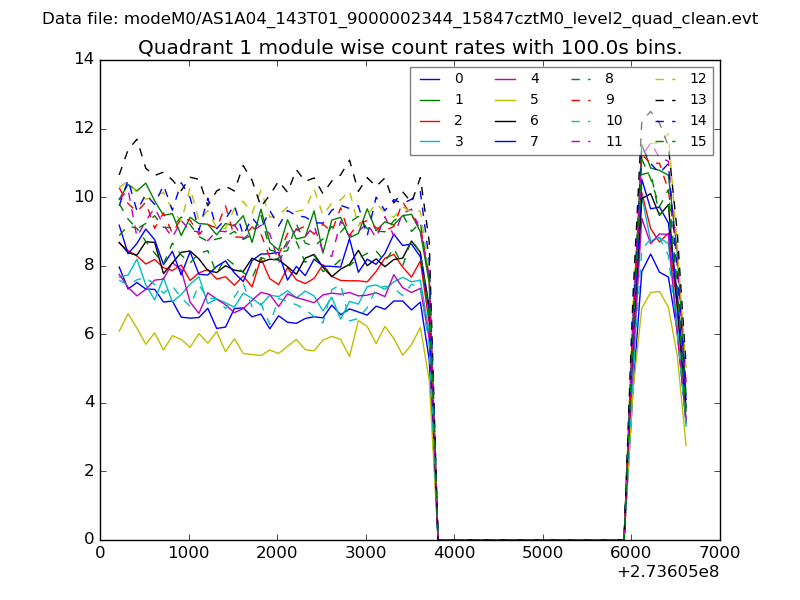
| Module-wise count rates for Quadrant A Data is divided into 100 sec bins |
 |
 |
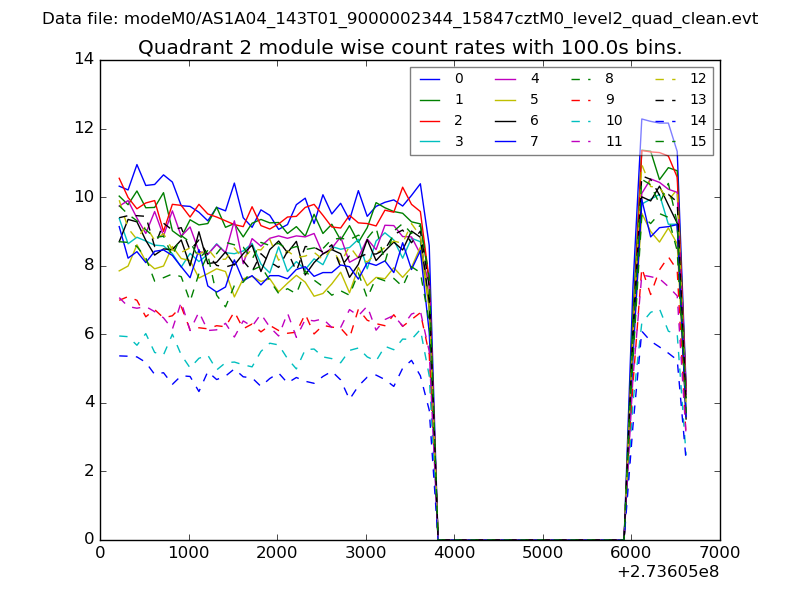
| Module-wise count rates for Quadrant B Data is divided into 100 sec bins |
 |
 |
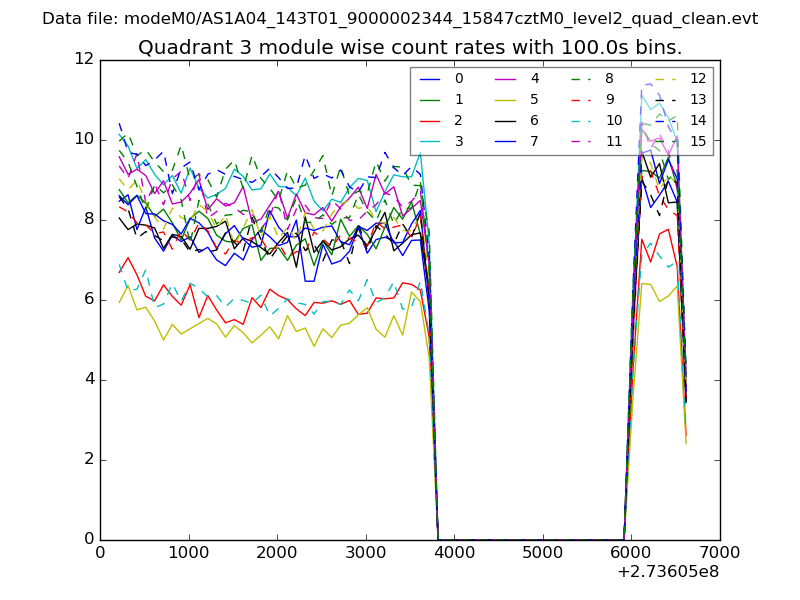
| Module-wise count rates for Quadrant C Data is divided into 100 sec bins |
 |
 |
| Module-wise count rates for Quadrant D Data is divided into 100 sec bins |
 |
 |
| Parameter | Plot |
|---|---|
| CZT HV Monitor | 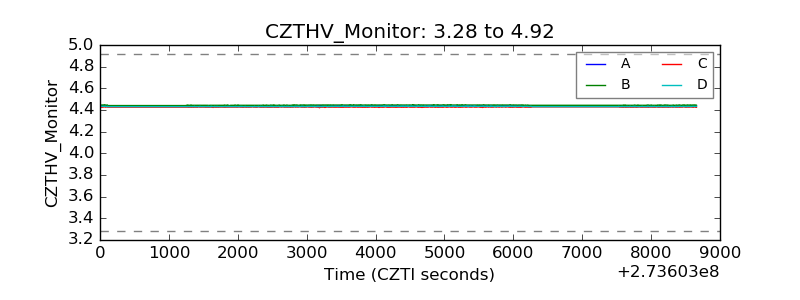 |
| D_VDD | 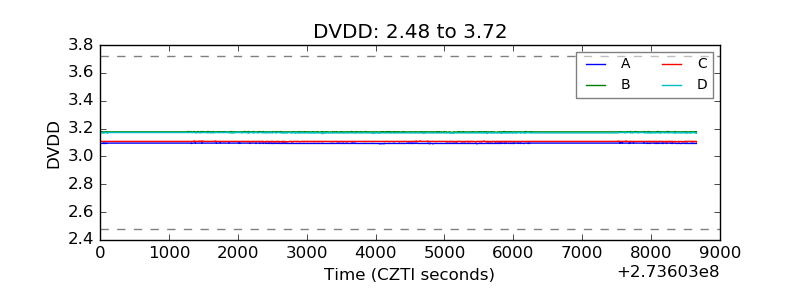 |
| Temperature 1 | 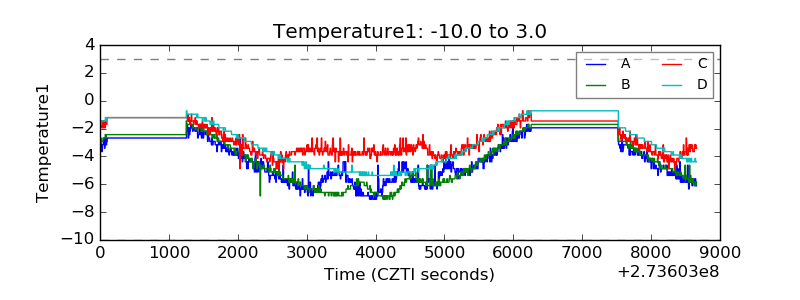 |
| Veto HV Monitor | 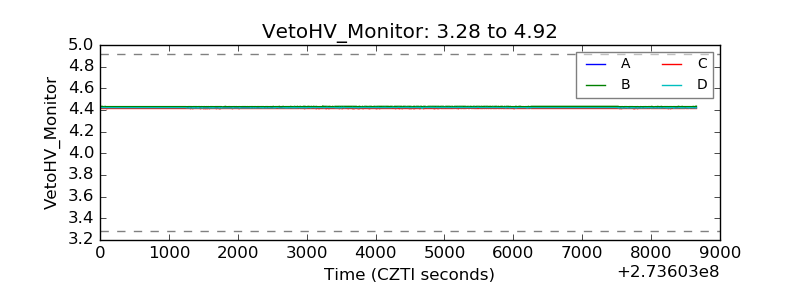 |
| Veto LLD | 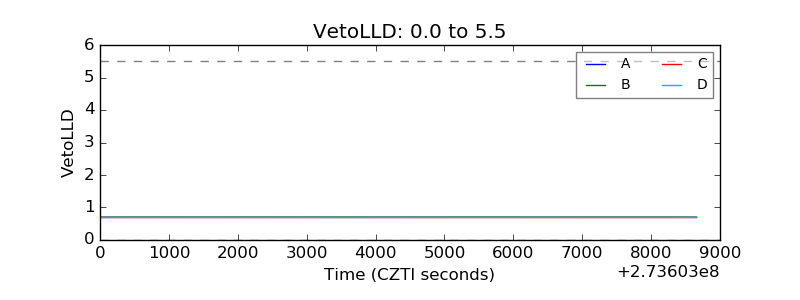 |
| Alpha Counter | 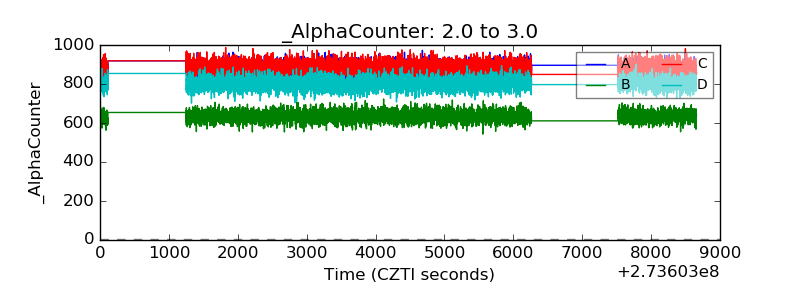 |
| _CPM_Rate | 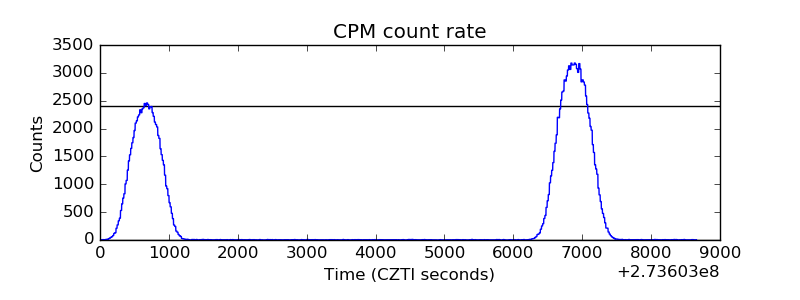 |
| CZT Counter | 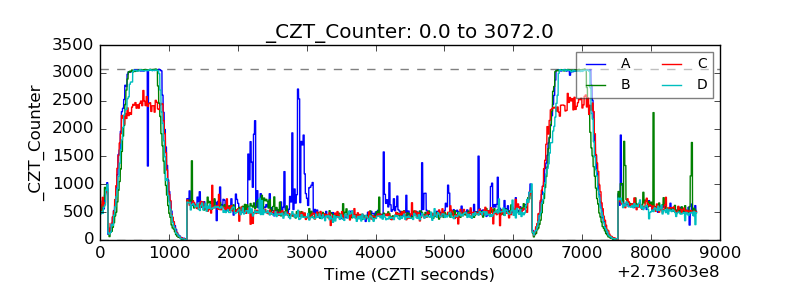 |
| +2.5 Volts monitor |  |
| +5 Volts monitor |  |
| _ROLL_ROT | 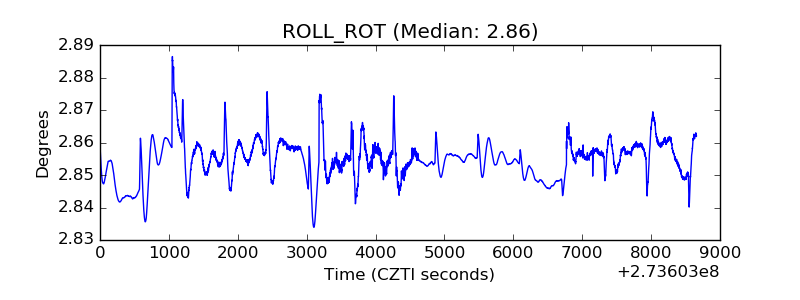 |
| _Roll_DEC | 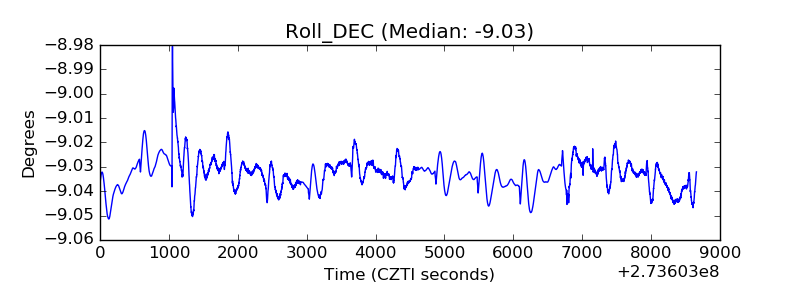 |
| _Roll_RA | 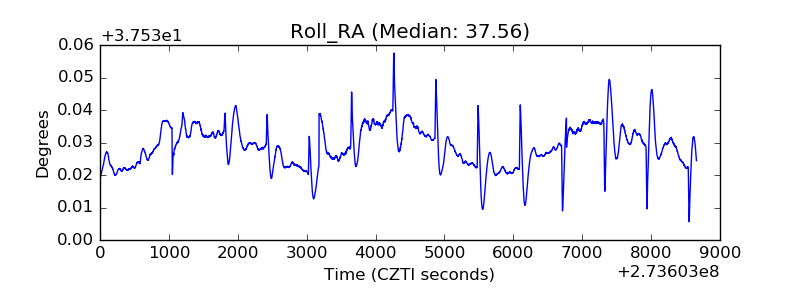 |
| Veto Counter | 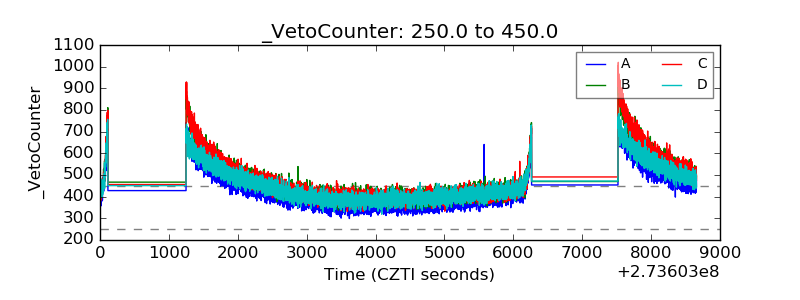 |