| Param | Original file | Final file |
|---|---|---|
| Filename | modeM0/AS1A04_143T01_9000002344_15849cztM0_level2.evt | modeM0/AS1A04_143T01_9000002344_15849cztM0_level2_quad_clean.evt |
| Size (bytes) | 454,942,080 | 106,741,440 |
| Size | 433.9 MB | 101.8 MB |
| Events in quadrant A | 3,743,043 | 697,989 |
| Events in quadrant B | 3,441,002 | 734,674 |
| Events in quadrant C | 3,203,686 | 696,750 |
| Events in quadrant D | 2,972,726 | 674,251 |
| Mode SS | |||
|---|---|---|---|
| Quadrant | BADHDUFLAG | Total packets | Discarded packets |
| A | 0 | 126 | 0 |
| B | 0 | 126 | 0 |
| C | 0 | 126 | 0 |
| D | 0 | 126 | 0 |
| Mode M0 | |||
|---|---|---|---|
| Quadrant | BADHDUFLAG | Total packets | Discarded packets |
| A | 0 | 15159 | 3 |
| B | 0 | 14119 | 2 |
| C | 0 | 13271 | 2 |
| D | 0 | 12874 | 2 |
| Mode M9 | |||
|---|---|---|---|
| Quadrant | BADHDUFLAG | Total packets | Discarded packets |
| A | 0 | 17 | 0 |
| B | 0 | 17 | 0 |
| C | 0 | 17 | 0 |
| D | 0 | 18 | 0 |
| Quadrant | Total seconds | Saturated seconds | Saturation percentage |
|---|---|---|---|
| A | 6145 | 114 | 1.855167% |
| B | 6145 | 75 | 1.220504% |
| C | 6145 | 60 | 0.976404% |
| D | 6145 | 9 | 0.146461% |
Noise dominated data is calculated using 1-second bins in cleaned event files. If a bin has >2000 counts, and if more than 50% of those come from <1% of pixels, then it is considered to be noise-dominated and hence unusable.
| Quadrant | # 1 sec bins | Bins with >0 counts | Bins with >2000 counts | High rate bins dominated by noise | Noise dominated (total time) | Noise dominated (detector-on time) | Marked lightcurve |
|---|---|---|---|---|---|---|---|
| A | 7511 | 6147 | 63 | 63 | 0.84% | 1.02% | 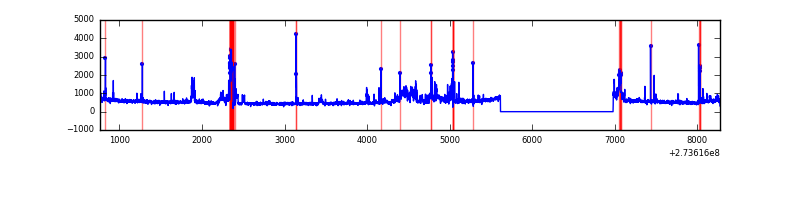 |
| B | 7511 | 6147 | 17 | 17 | 0.23% | 0.28% | 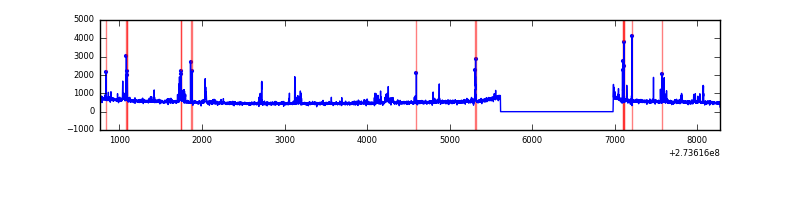 |
| C | 7511 | 6147 | 0 | 0 | 0.00% | 0.00% | 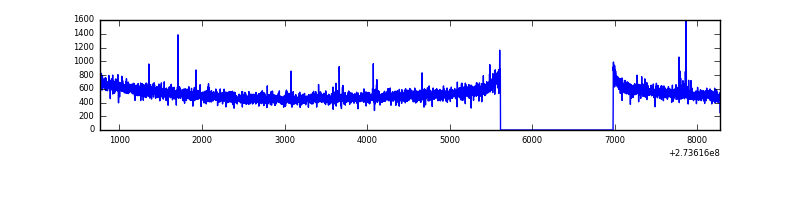 |
| D | 7511 | 6147 | 3 | 3 | 0.04% | 0.05% | 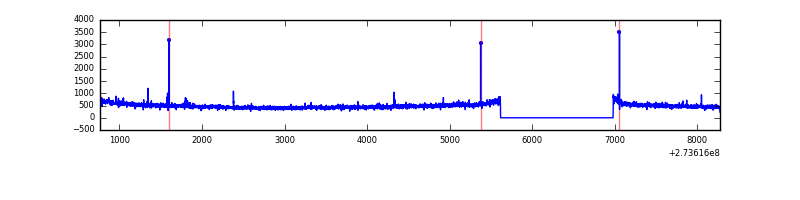 |
Top three noisy pixels from each quadrant. If the there are fewer than three noisy pixels in the level2.evt file, extra rows are filled as -1
| Pixel properties | Quadrant properties | ||||||
|---|---|---|---|---|---|---|---|
| Quadrant | DetID | PixID | Counts | Sigma | Mean | Median | Sigma |
| A | 15 | 239 | 349086 | 2197.24 | 793 | 779 | 158.5 |
| A | 15 | 157 | 330885 | 2082.42 | 793 | 779 | 158.5 |
| A | 9 | 143 | 14162 | 84.42 | 793 | 779 | 158.5 |
| B | 4 | 173 | 116833 | 755.83 | 812 | 794 | 153.5 |
| B | 0 | 229 | 61138 | 393.05 | 812 | 794 | 153.5 |
| B | 0 | 228 | 30682 | 194.68 | 812 | 794 | 153.5 |
| C | 14 | 238 | 121579 | 667.93 | 779 | 788 | 180.8 |
| C | 0 | 207 | 22031 | 117.47 | 779 | 788 | 180.8 |
| C | 3 | 233 | 16248 | 85.49 | 779 | 788 | 180.8 |
| D | 2 | 234 | 22973 | 118.21 | 779 | 758 | 187.9 |
| D | 2 | 120 | 10413 | 51.37 | 779 | 758 | 187.9 |
| D | 14 | 226 | 7924 | 38.13 | 779 | 758 | 187.9 |
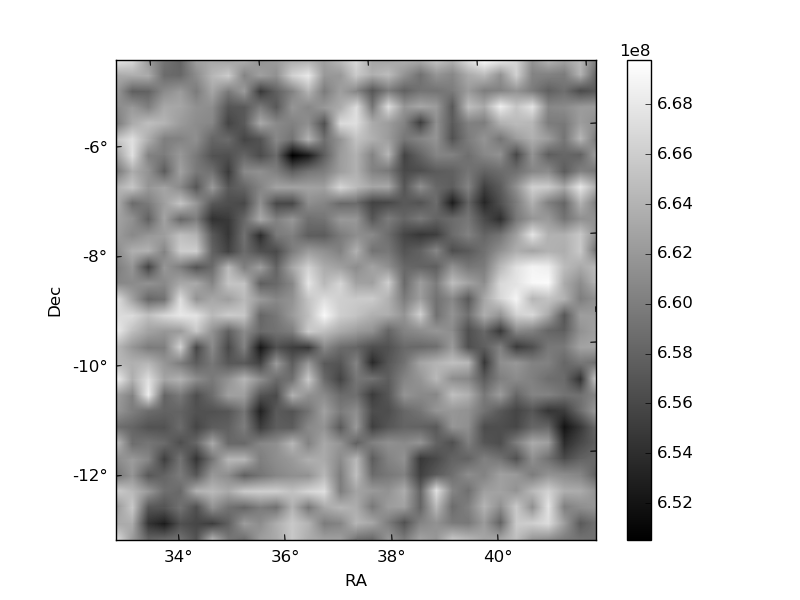
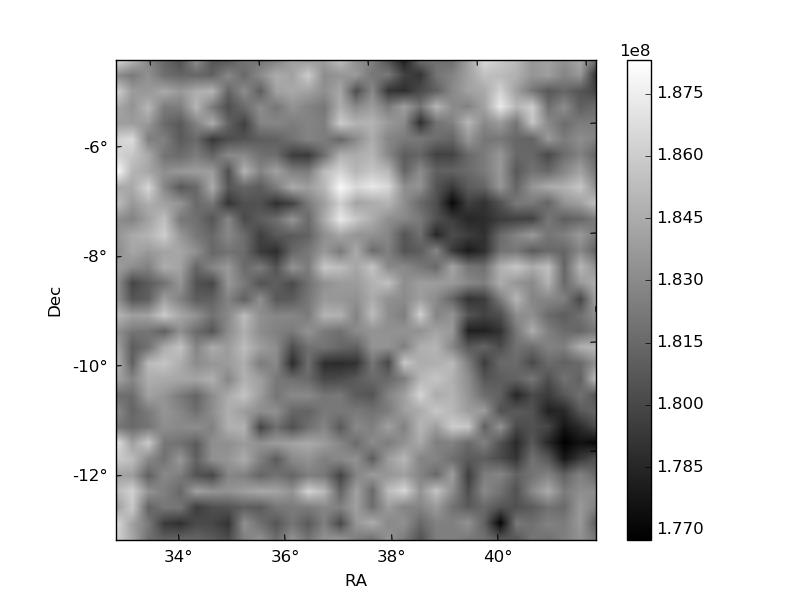
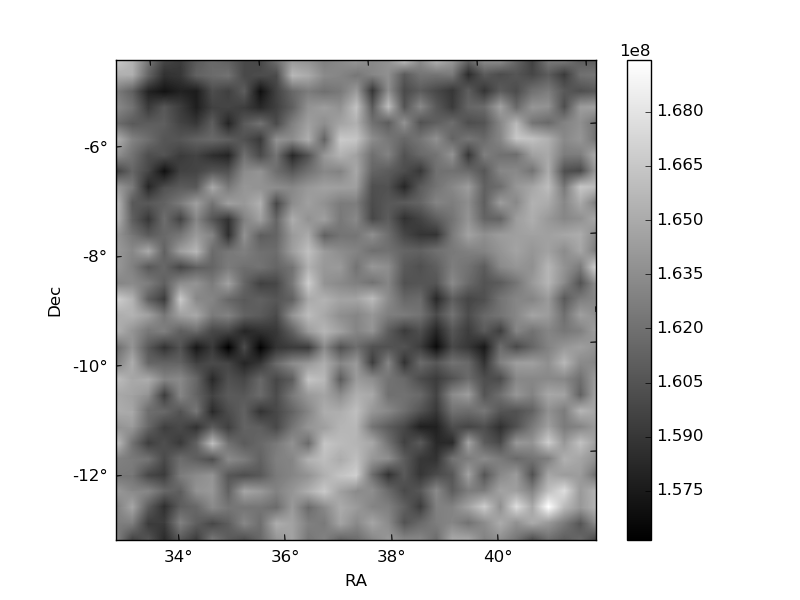
Histogram calculated using DETX and DETY for each event in the final _common_clean file
| Quadrant A | 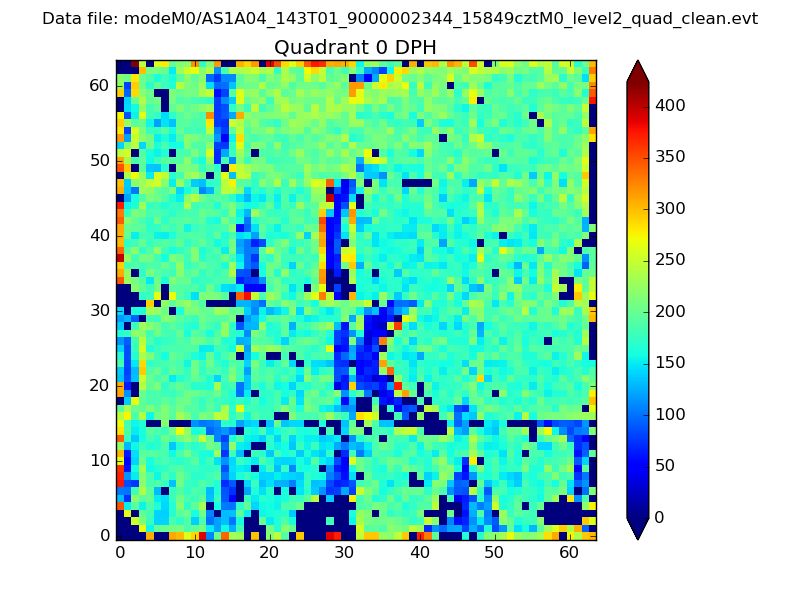 |
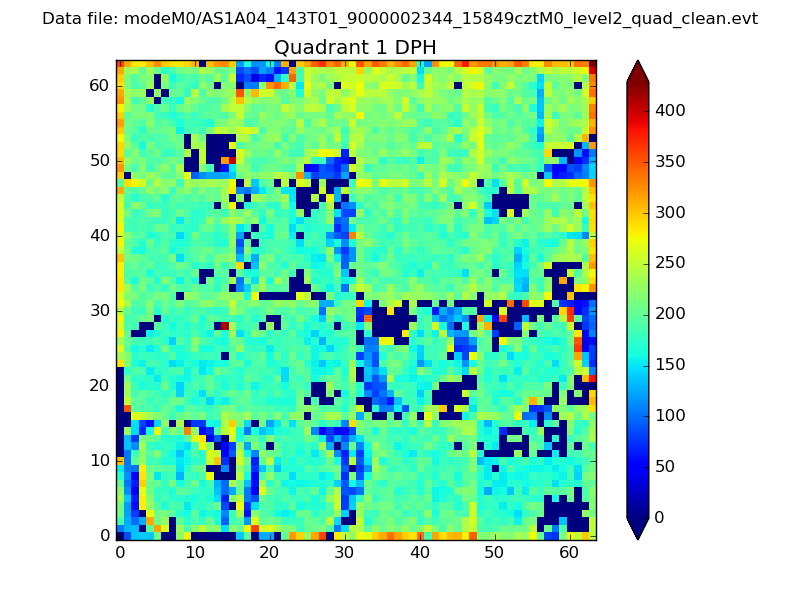 |
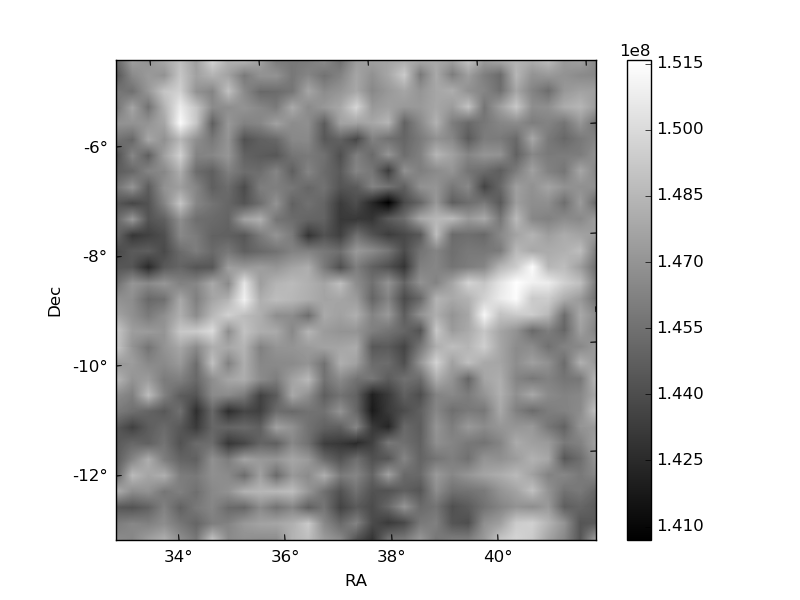
Quadrant B |
|---|---|---|---|
| Quadrant D | 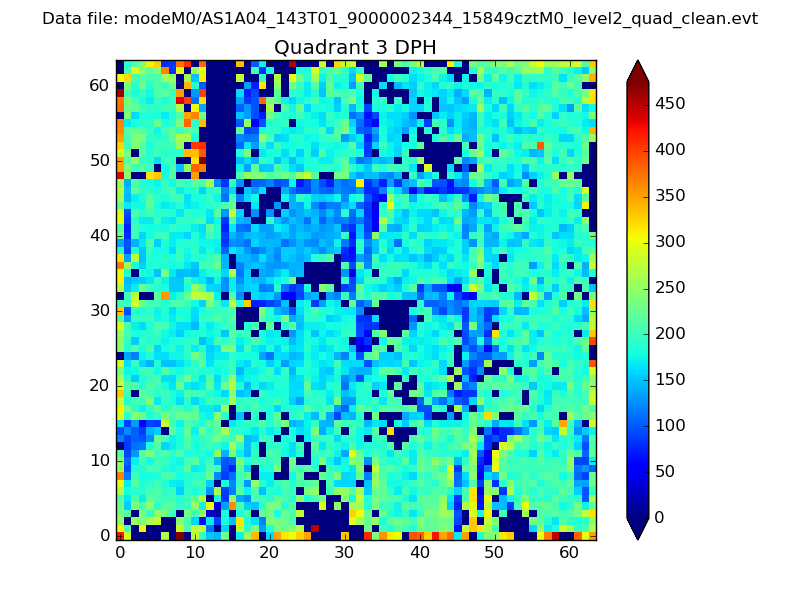 |
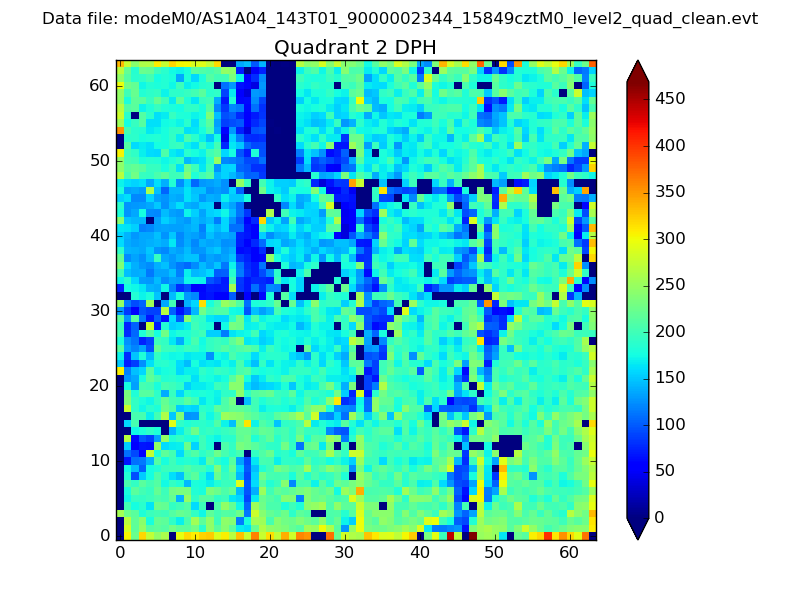 |
Quadrant C |
| Plot type | Count rate plots | Images |
|---|---|---|
| Comparison with Poisson distribution Blue bars denote a histogram of data divided into 1 sec bins. Red curve is a Poisson curve with rate = median count rate of data. |
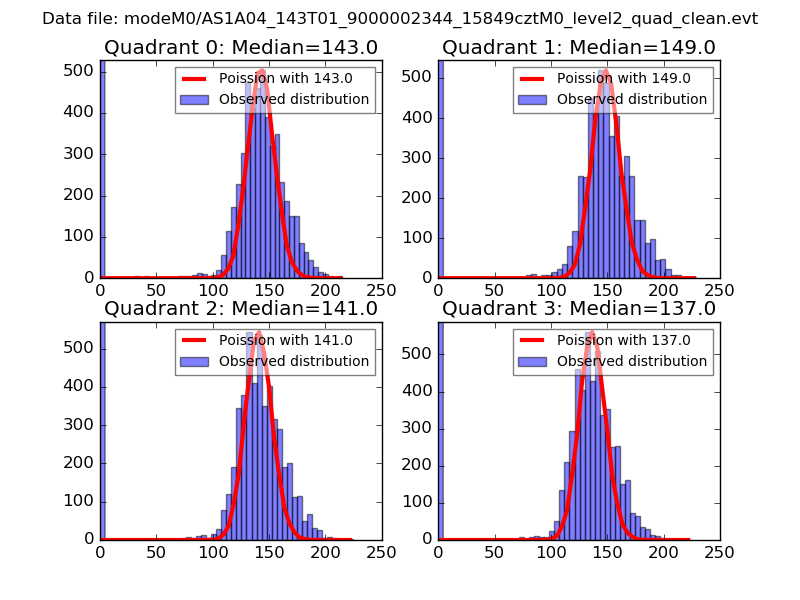 |
 |
| Quadrant-wise count rates Data is divided into 100 sec bins |
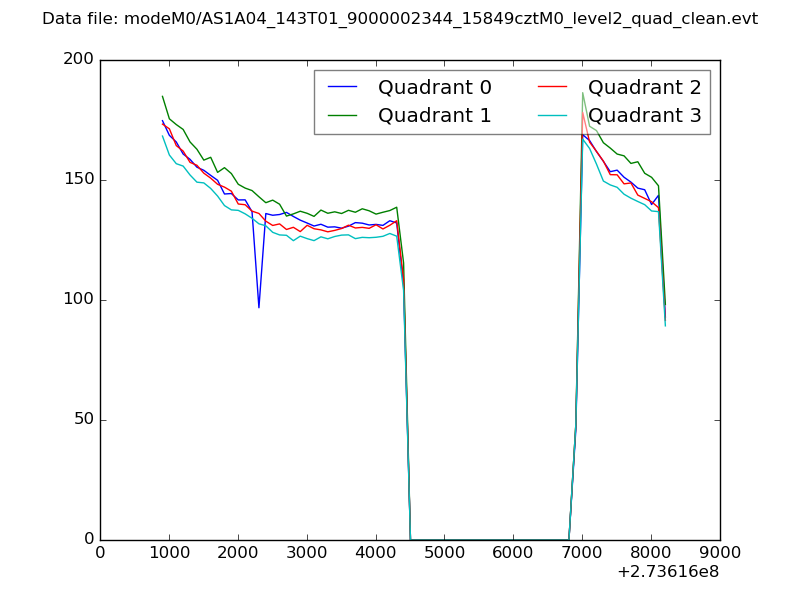 |
|
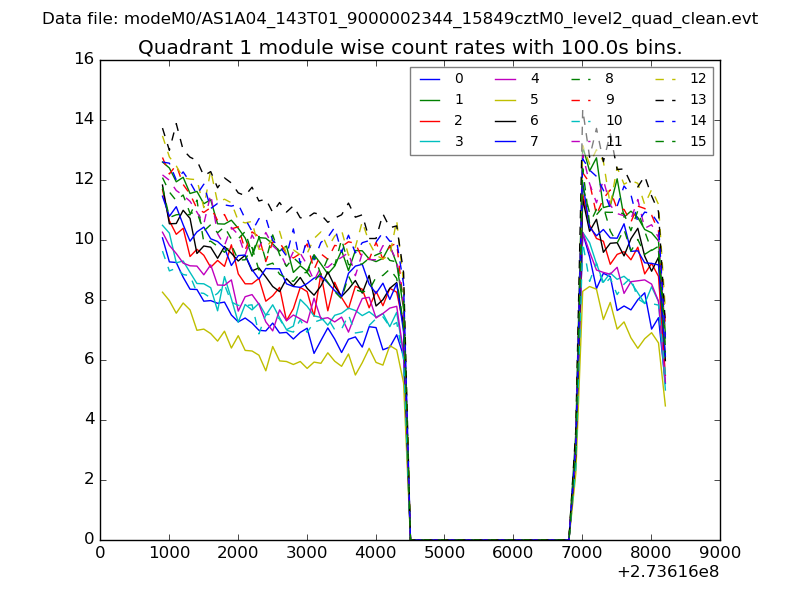
| Module-wise count rates for Quadrant A Data is divided into 100 sec bins |
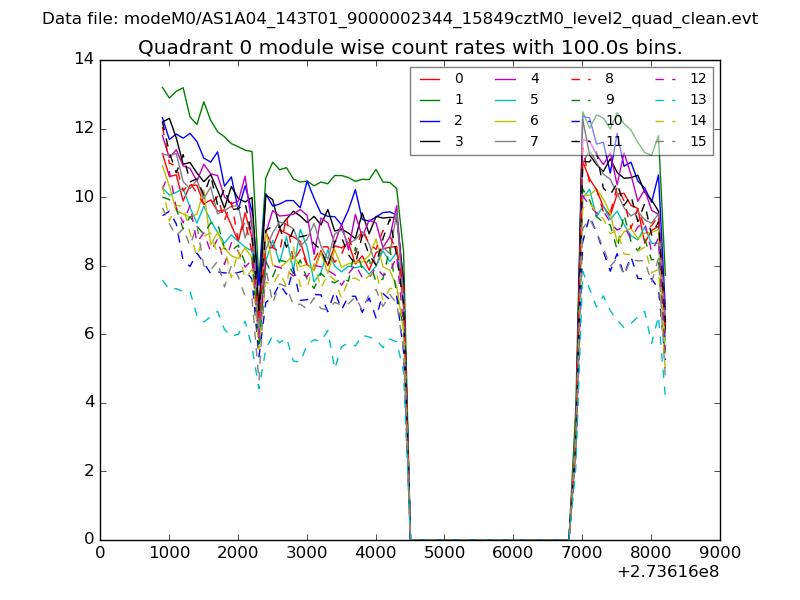 |
 |
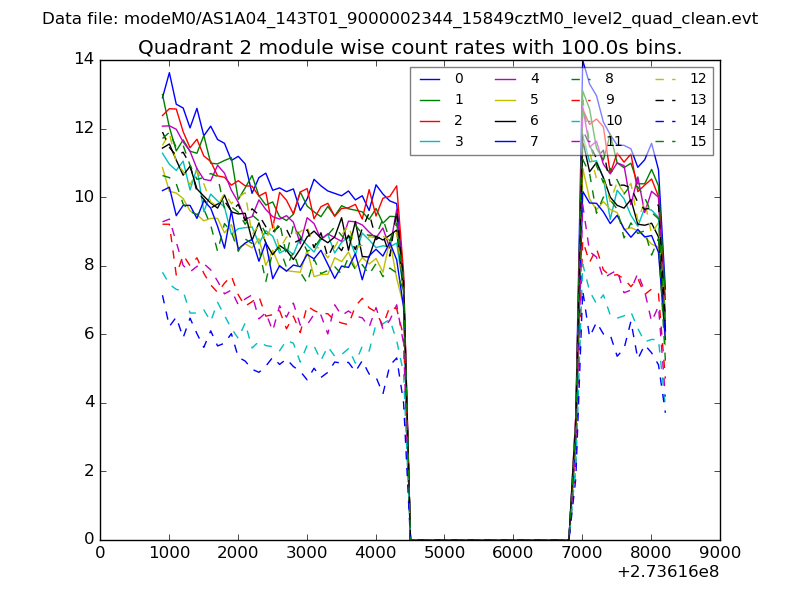
| Module-wise count rates for Quadrant B Data is divided into 100 sec bins |
 |
 |
| Module-wise count rates for Quadrant C Data is divided into 100 sec bins |
 |
 |
| Module-wise count rates for Quadrant D Data is divided into 100 sec bins |
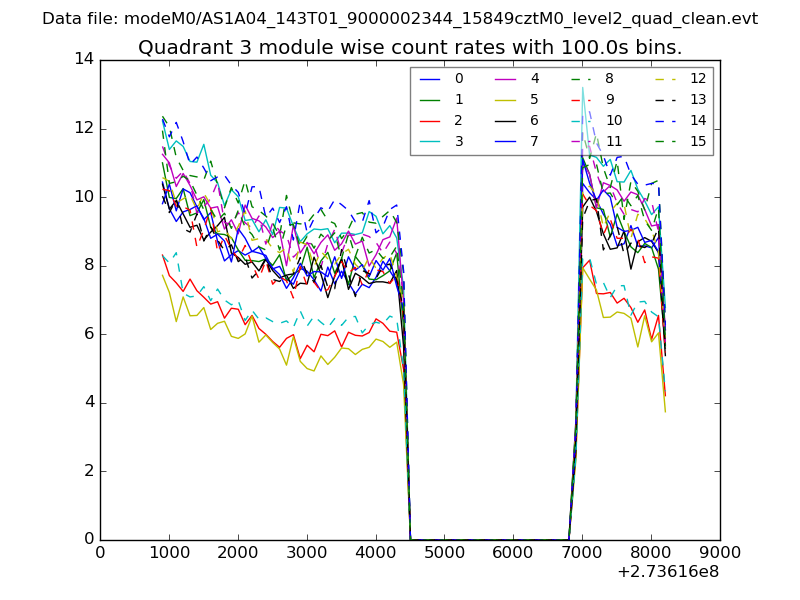 |
 |
| Parameter | Plot |
|---|---|
| CZT HV Monitor | 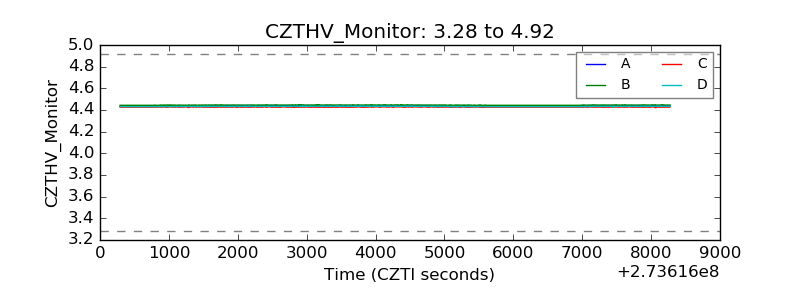 |
| D_VDD | 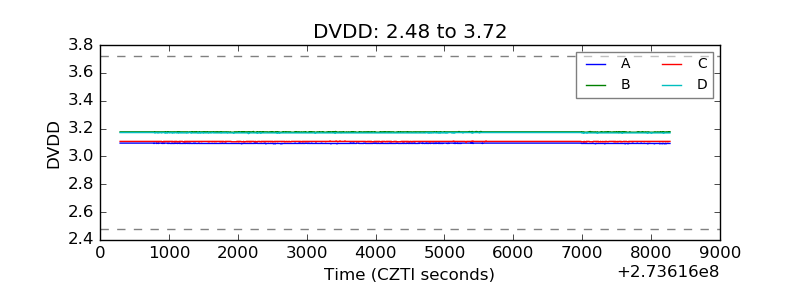 |
| Temperature 1 | 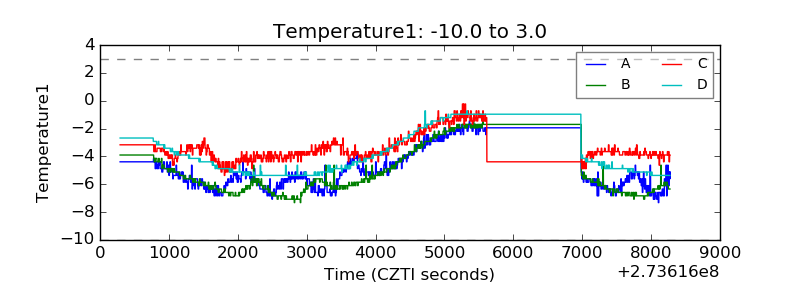 |
| Veto HV Monitor | 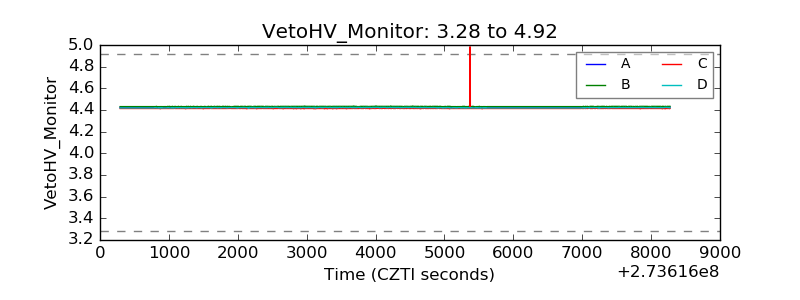 |
| Veto LLD | 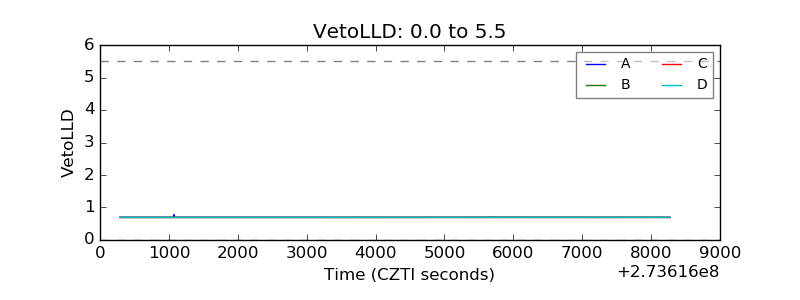 |
| Alpha Counter | 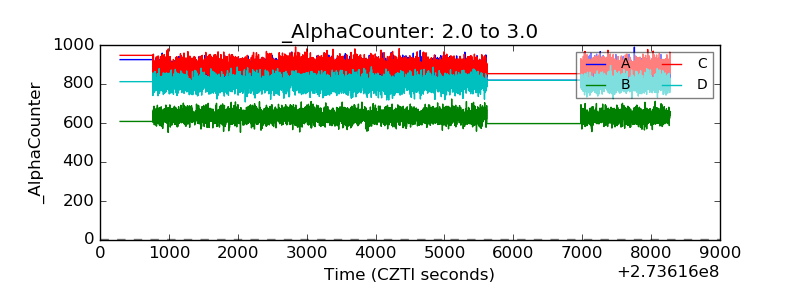 |
| _CPM_Rate | 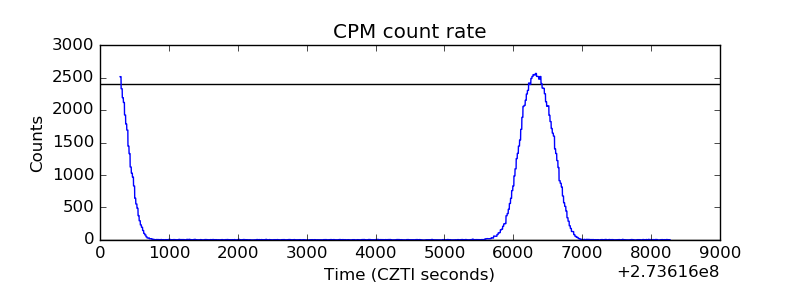 |
| CZT Counter | 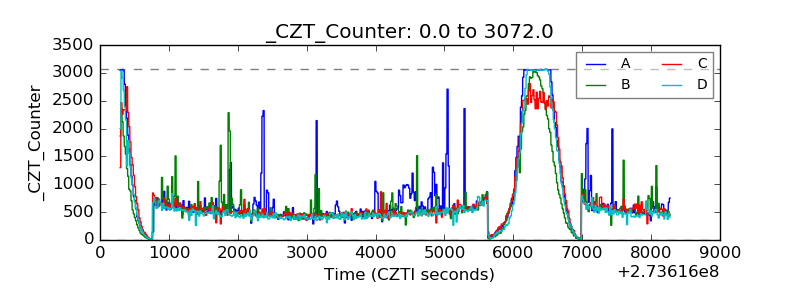 |
| +2.5 Volts monitor |  |
| +5 Volts monitor |  |
| _ROLL_ROT | 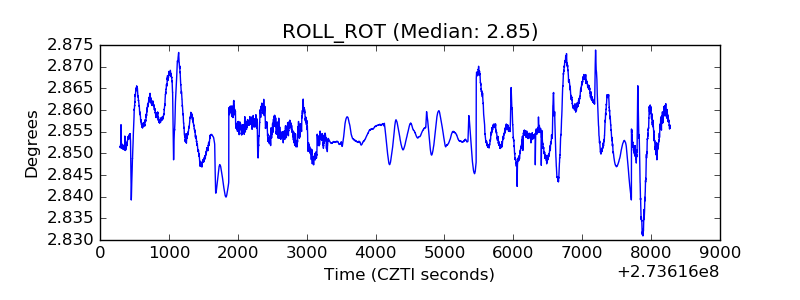 |
| _Roll_DEC | 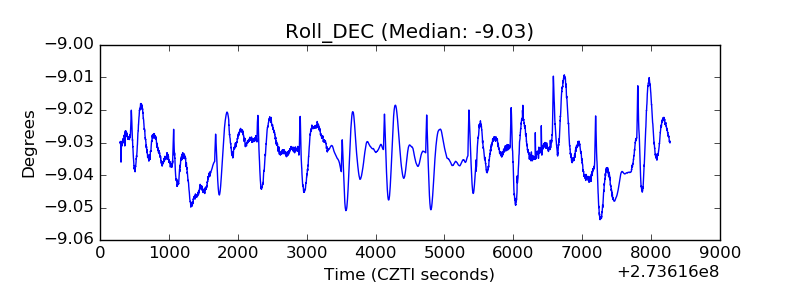 |
| _Roll_RA | 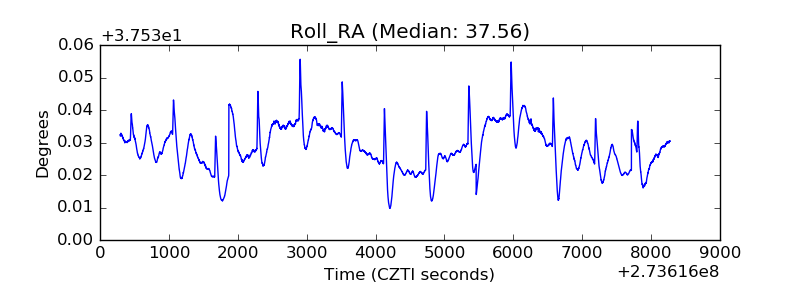 |
| Veto Counter | 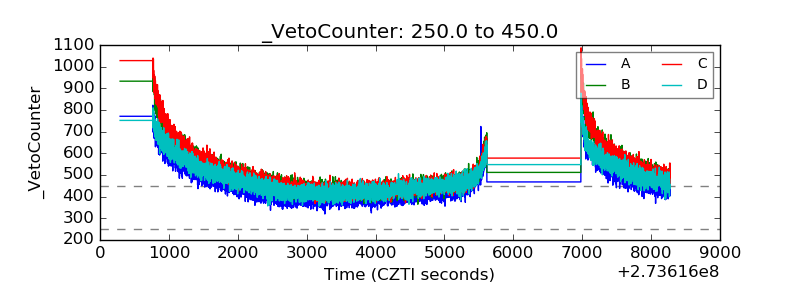 |