| Param | Original file | Final file |
|---|---|---|
| Filename | modeM0/AS1A04_143T01_9000002344_15851cztM0_level2.evt | modeM0/AS1A04_143T01_9000002344_15851cztM0_level2_quad_clean.evt |
| Size (bytes) | 673,896,960 | 95,333,760 |
| Size | 642.7 MB | 90.9 MB |
| Events in quadrant A | 4,199,388 | 605,986 |
| Events in quadrant B | 3,465,245 | 652,006 |
| Events in quadrant C | 3,424,782 | 617,667 |
| Events in quadrant D | 8,849,930 | 527,508 |
| Mode SS | |||
|---|---|---|---|
| Quadrant | BADHDUFLAG | Total packets | Discarded packets |
| A | 0 | 140 | 0 |
| B | 0 | 140 | 0 |
| C | 0 | 140 | 0 |
| D | 0 | 140 | 0 |
| Mode M0 | |||
|---|---|---|---|
| Quadrant | BADHDUFLAG | Total packets | Discarded packets |
| A | 0 | 17033 | 3 |
| B | 0 | 14760 | 2 |
| C | 0 | 14539 | 2 |
| D | 0 | 30962 | 2 |
| Mode M9 | |||
|---|---|---|---|
| Quadrant | BADHDUFLAG | Total packets | Discarded packets |
| A | 0 | 20 | 0 |
| B | 0 | 20 | 0 |
| C | 0 | 20 | 0 |
| D | 0 | 21 | 0 |
| Quadrant | Total seconds | Saturated seconds | Saturation percentage |
|---|---|---|---|
| A | 6939 | 357 | 5.144834% |
| B | 6939 | 83 | 1.196138% |
| C | 6939 | 76 | 1.095259% |
| D | 6939 | 2036 | 29.341404% |
Noise dominated data is calculated using 1-second bins in cleaned event files. If a bin has >2000 counts, and if more than 50% of those come from <1% of pixels, then it is considered to be noise-dominated and hence unusable.
| Quadrant | # 1 sec bins | Bins with >0 counts | Bins with >2000 counts | High rate bins dominated by noise | Noise dominated (total time) | Noise dominated (detector-on time) | Marked lightcurve |
|---|---|---|---|---|---|---|---|
| A | 8044 | 6940 | 297 | 297 | 3.69% | 4.28% | 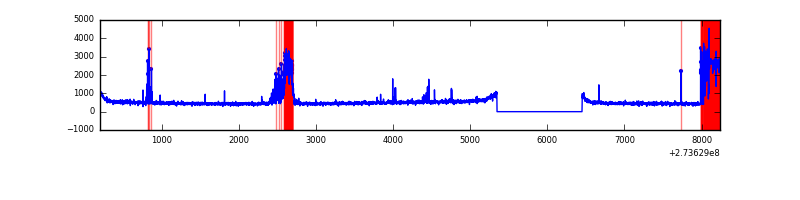 |
| B | 8045 | 6941 | 1 | 1 | 0.01% | 0.01% | 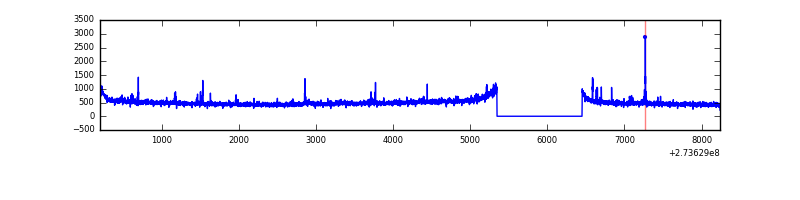 |
| C | 8045 | 6941 | 0 | 0 | 0.00% | 0.00% | 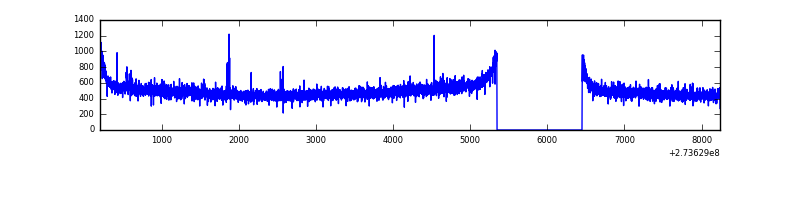 |
| D | 8045 | 6940 | 1780 | 1780 | 22.13% | 25.65% | 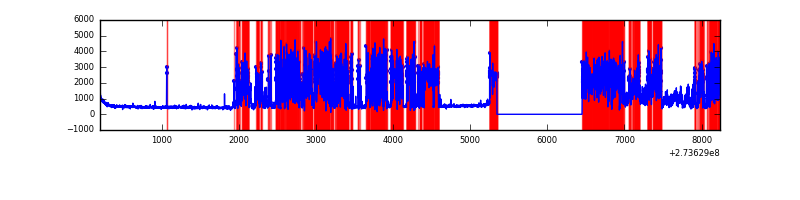 |
Top three noisy pixels from each quadrant. If the there are fewer than three noisy pixels in the level2.evt file, extra rows are filled as -1
| Pixel properties | Quadrant properties | ||||||
|---|---|---|---|---|---|---|---|
| Quadrant | DetID | PixID | Counts | Sigma | Mean | Median | Sigma |
| A | 15 | 239 | 943988 | 5553.06 | 843 | 822 | 169.8 |
| A | 0 | 226 | 7498 | 39.31 | 843 | 822 | 169.8 |
| A | 13 | 210 | 6530 | 33.61 | 843 | 822 | 169.8 |
| B | 4 | 173 | 57795 | 340.13 | 867 | 847 | 167.4 |
| B | 12 | 111 | 19364 | 110.59 | 867 | 847 | 167.4 |
| B | 11 | 111 | 16278 | 92.16 | 867 | 847 | 167.4 |
| C | 14 | 238 | 127578 | 646.87 | 834 | 842 | 195.9 |
| C | 3 | 233 | 23711 | 116.72 | 834 | 842 | 195.9 |
| C | 7 | 247 | 20197 | 98.79 | 834 | 842 | 195.9 |
| D | 1 | 52 | 6085214 | 34563.88 | 720 | 701 | 176.0 |
| D | 7 | 223 | 26094 | 144.25 | 720 | 701 | 176.0 |
| D | 2 | 234 | 22778 | 125.41 | 720 | 701 | 176.0 |
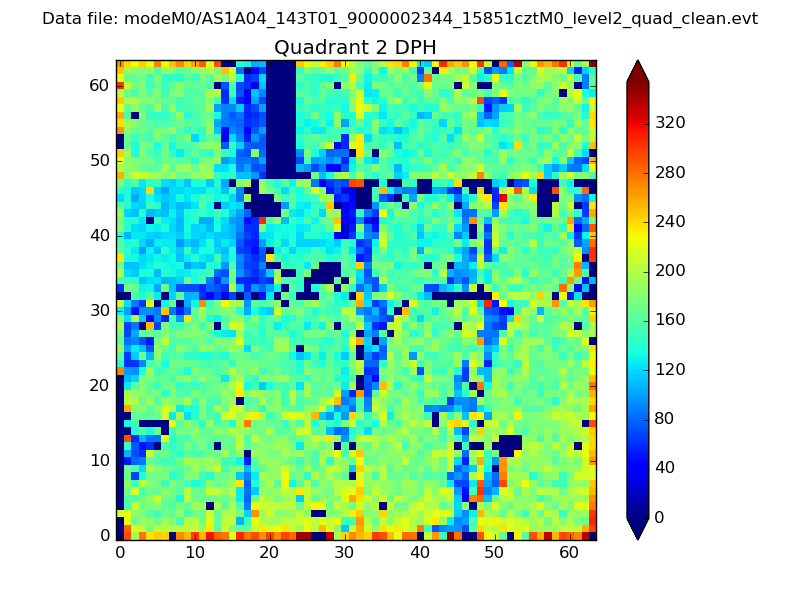
Histogram calculated using DETX and DETY for each event in the final _common_clean file
| Quadrant A | 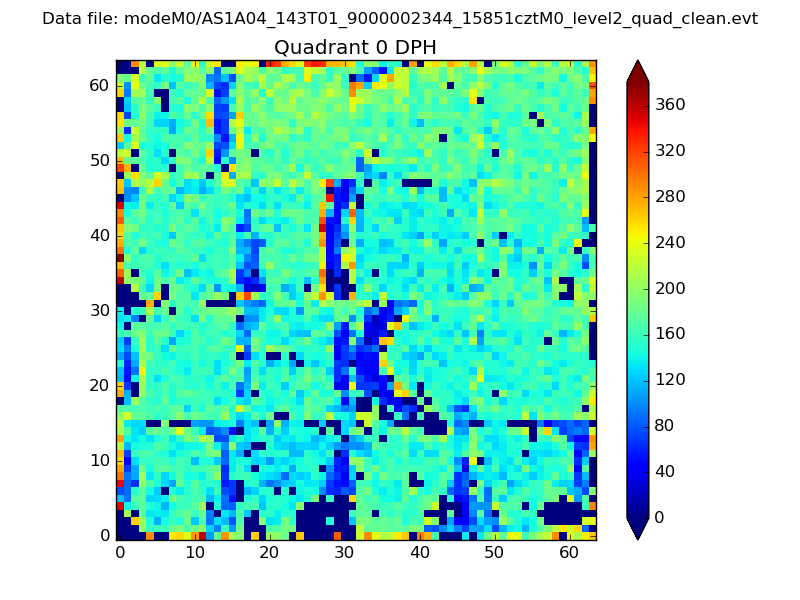 |
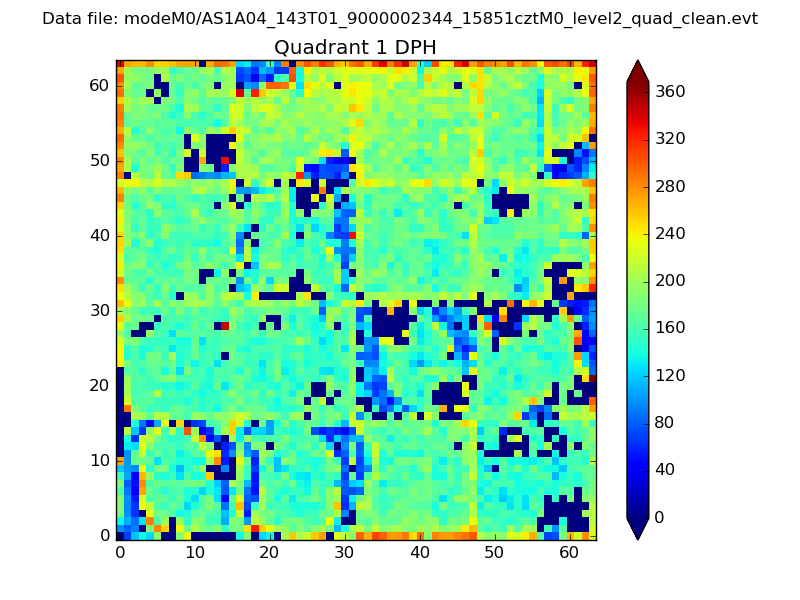 |
Quadrant B |
|---|---|---|---|
| Quadrant D | 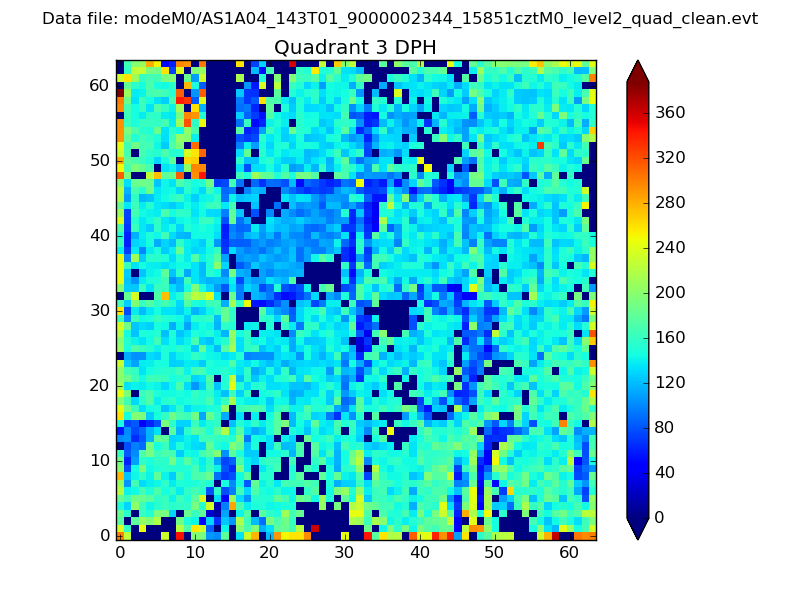 |
 |
Quadrant C |
| Plot type | Count rate plots | Images |
|---|---|---|
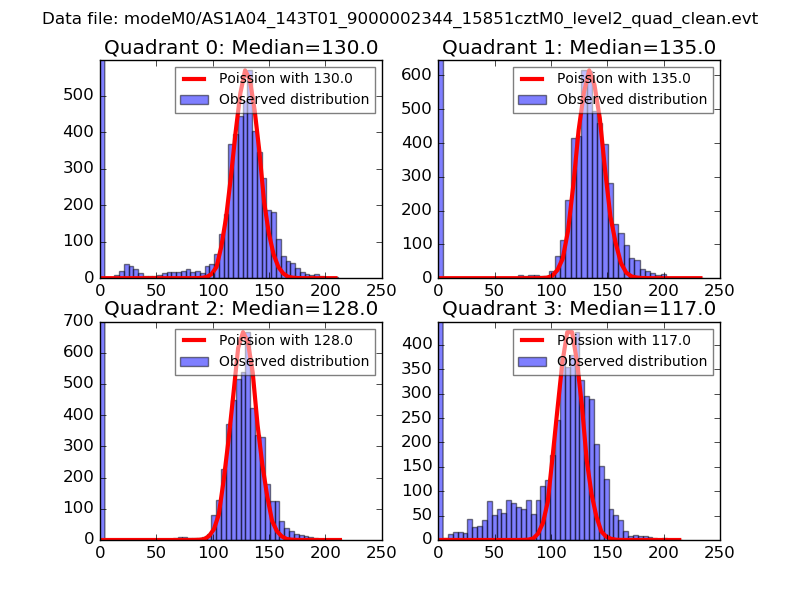
| Comparison with Poisson distribution Blue bars denote a histogram of data divided into 1 sec bins. Red curve is a Poisson curve with rate = median count rate of data. |
 |
 |
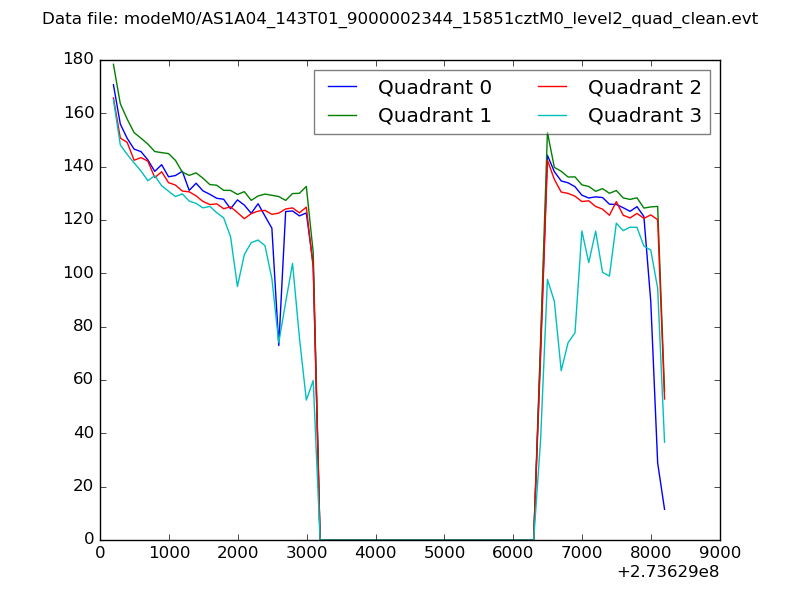
| Quadrant-wise count rates Data is divided into 100 sec bins |
 |
|
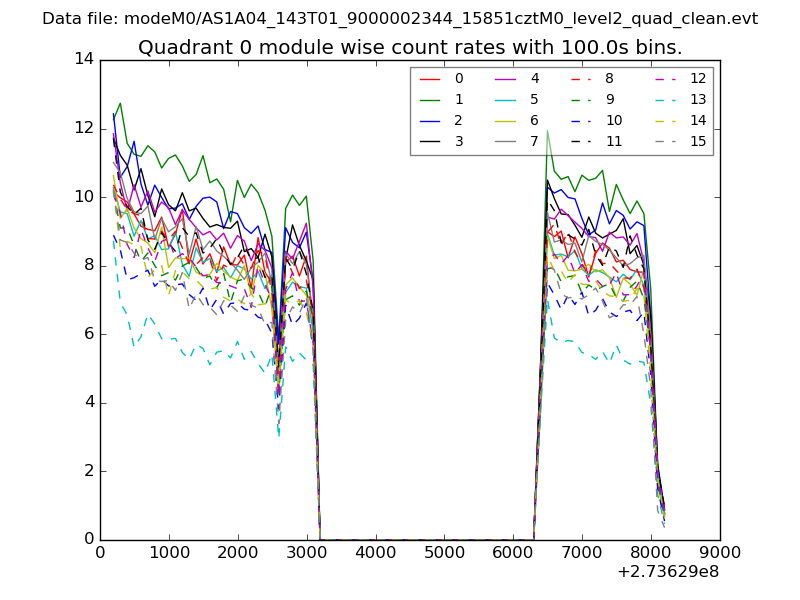
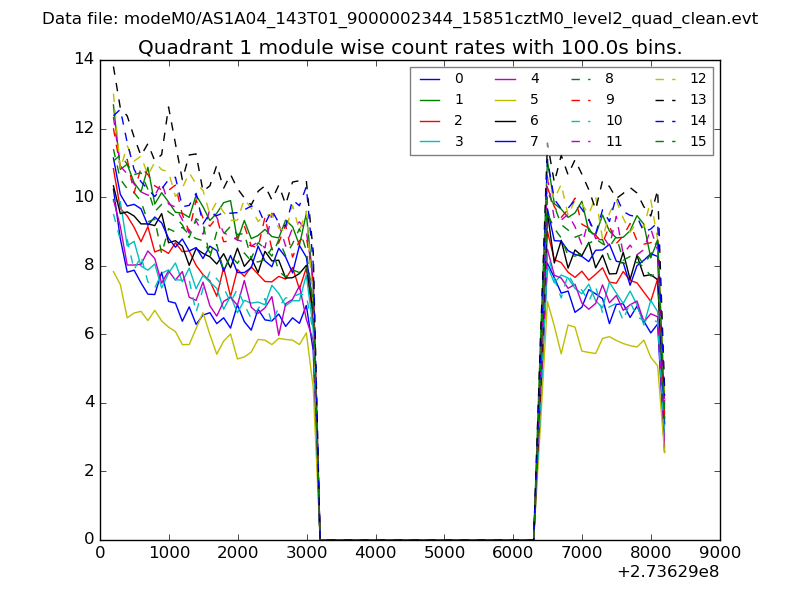
| Module-wise count rates for Quadrant A Data is divided into 100 sec bins |
 |
 |
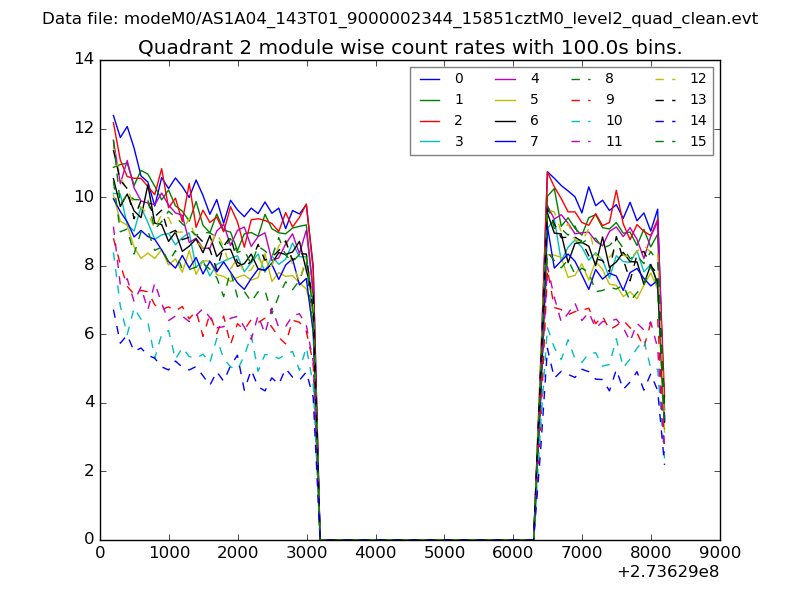
| Module-wise count rates for Quadrant B Data is divided into 100 sec bins |
 |
 |
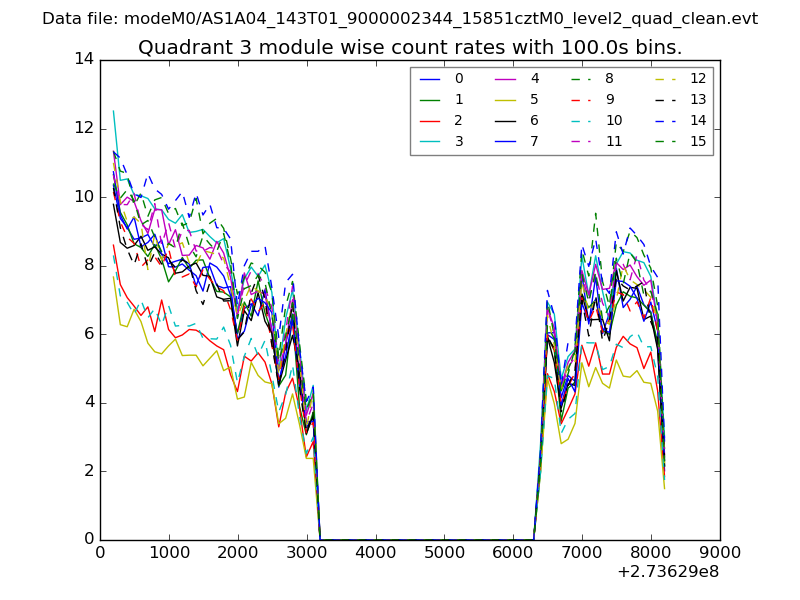
| Module-wise count rates for Quadrant C Data is divided into 100 sec bins |
 |
 |
| Module-wise count rates for Quadrant D Data is divided into 100 sec bins |
 |
 |
| Parameter | Plot |
|---|---|
| CZT HV Monitor | 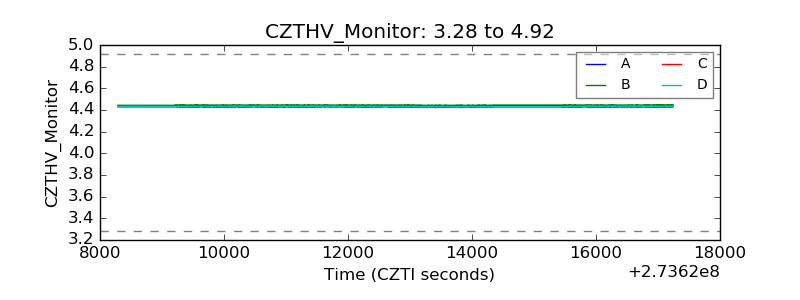 |
| D_VDD | 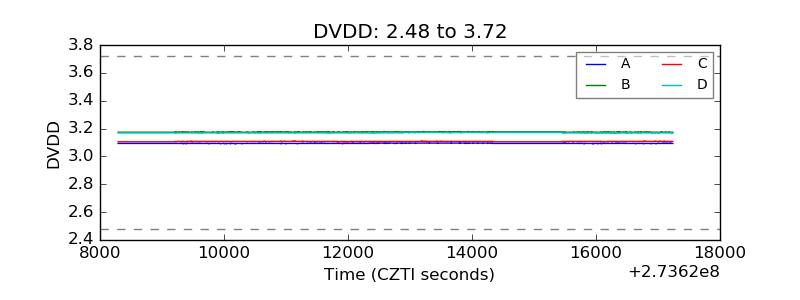 |
| Temperature 1 | 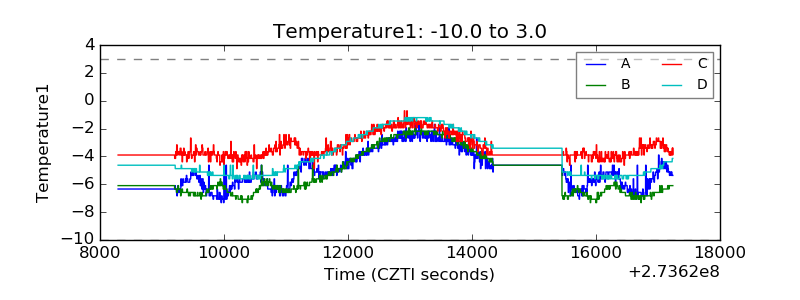 |
| Veto HV Monitor | 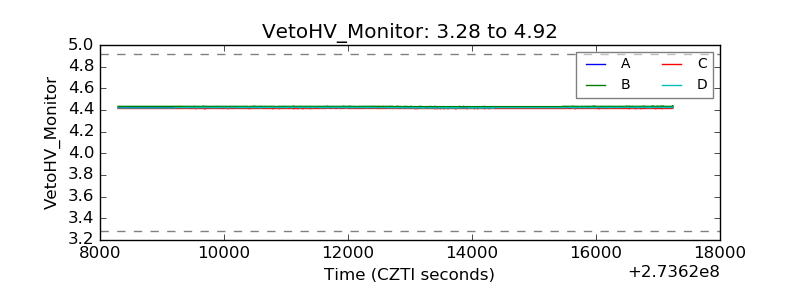 |
| Veto LLD | 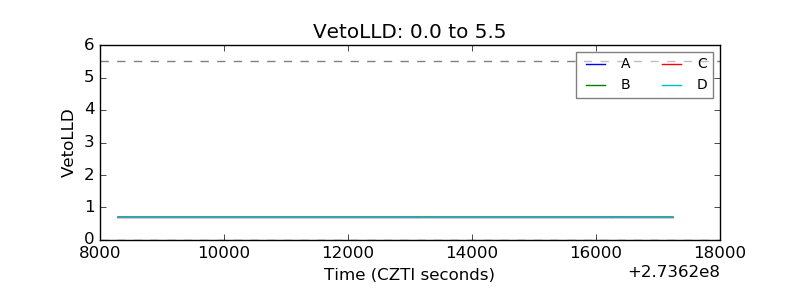 |
| Alpha Counter |  |
| _CPM_Rate | 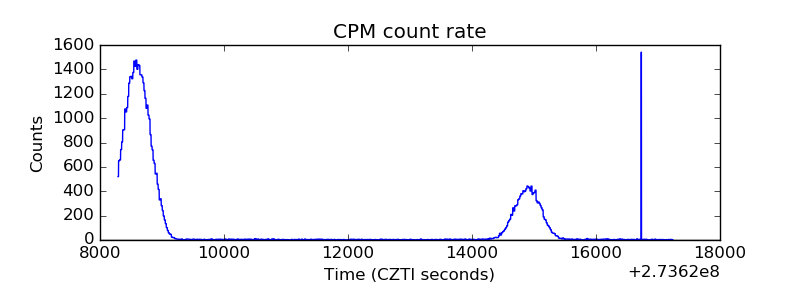 |
| CZT Counter | 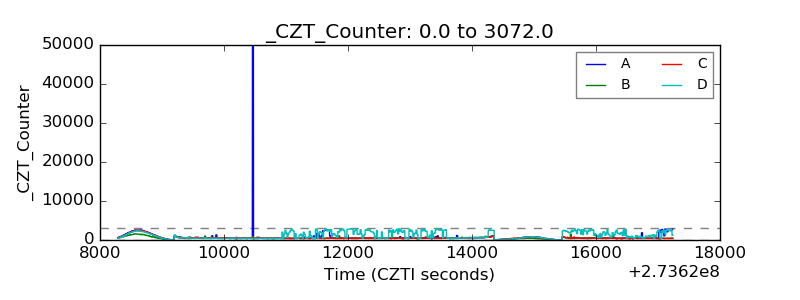 |
| +2.5 Volts monitor |  |
| +5 Volts monitor |  |
| _ROLL_ROT |  |
| _Roll_DEC | 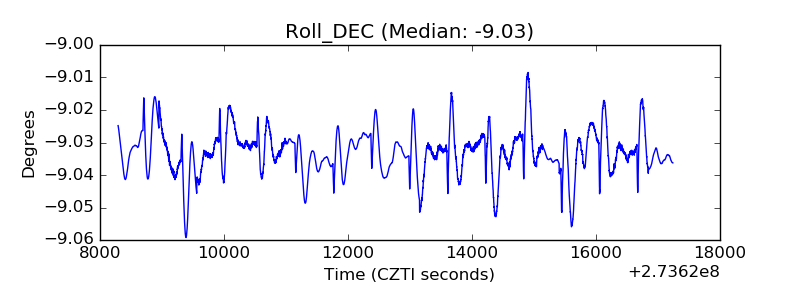 |
| _Roll_RA | 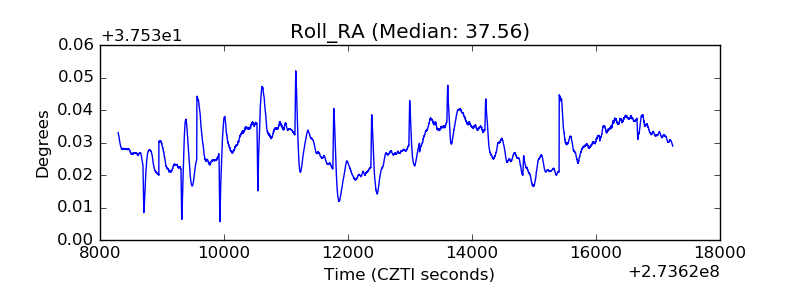 |
| Veto Counter | 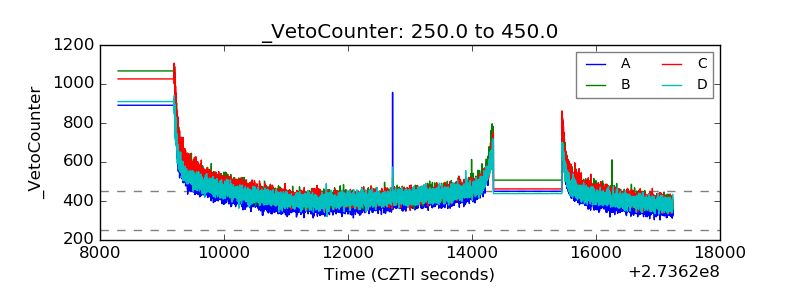 |