| Param | Original file | Final file |
|---|---|---|
| Filename | modeM0/AS1A04_143T01_9000002344_15852cztM0_level2.evt | modeM0/AS1A04_143T01_9000002344_15852cztM0_level2_quad_clean.evt |
| Size (bytes) | 824,987,520 | 82,961,280 |
| Size | 786.8 MB | 79.1 MB |
| Events in quadrant A | 6,951,729 | 489,817 |
| Events in quadrant B | 3,367,389 | 583,785 |
| Events in quadrant C | 3,237,087 | 556,448 |
| Events in quadrant D | 10,968,601 | 406,181 |
| Mode SS | |||
|---|---|---|---|
| Quadrant | BADHDUFLAG | Total packets | Discarded packets |
| A | 0 | 140 | 0 |
| B | 0 | 140 | 0 |
| C | 0 | 140 | 0 |
| D | 0 | 140 | 0 |
| Mode M0 | |||
|---|---|---|---|
| Quadrant | BADHDUFLAG | Total packets | Discarded packets |
| A | 0 | 25182 | 1 |
| B | 0 | 14460 | 0 |
| C | 0 | 13993 | 0 |
| D | 0 | 37183 | 0 |
| Mode M9 | |||
|---|---|---|---|
| Quadrant | BADHDUFLAG | Total packets | Discarded packets |
| A | 0 | 8 | 0 |
| B | 0 | 8 | 0 |
| C | 0 | 8 | 0 |
| D | 0 | 8 | 0 |
| Quadrant | Total seconds | Saturated seconds | Saturation percentage |
|---|---|---|---|
| A | 6812 | 1666 | 24.456841% |
| B | 6812 | 92 | 1.350558% |
| C | 6812 | 97 | 1.423958% |
| D | 6812 | 2893 | 42.469172% |
Noise dominated data is calculated using 1-second bins in cleaned event files. If a bin has >2000 counts, and if more than 50% of those come from <1% of pixels, then it is considered to be noise-dominated and hence unusable.
| Quadrant | # 1 sec bins | Bins with >0 counts | Bins with >2000 counts | High rate bins dominated by noise | Noise dominated (total time) | Noise dominated (detector-on time) | Marked lightcurve |
|---|---|---|---|---|---|---|---|
| A | 7553 | 6815 | 1465 | 1465 | 19.40% | 21.50% | 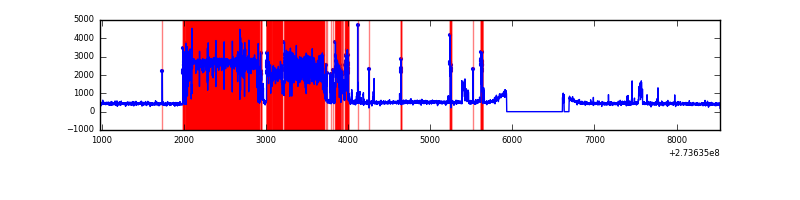 |
| B | 7553 | 6815 | 4 | 4 | 0.05% | 0.06% | 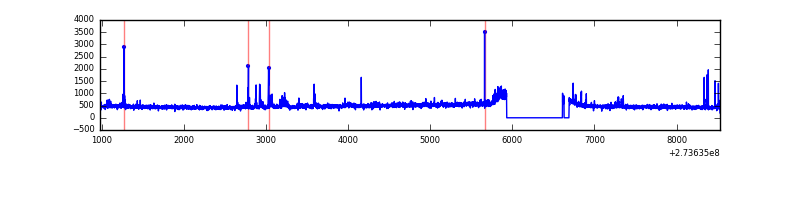 |
| C | 7553 | 6815 | 0 | 0 | 0.00% | 0.00% | 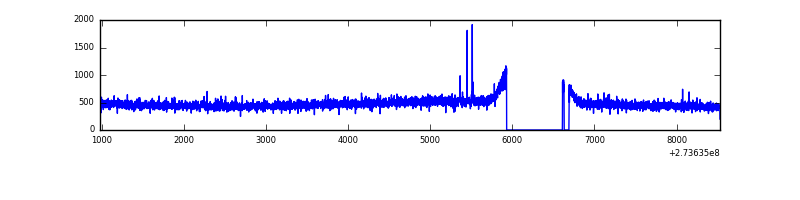 |
| D | 7553 | 6814 | 2657 | 2657 | 35.18% | 38.99% | 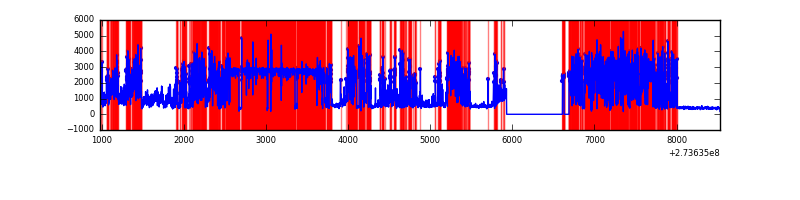 |
Top three noisy pixels from each quadrant. If the there are fewer than three noisy pixels in the level2.evt file, extra rows are filled as -1
| Pixel properties | Quadrant properties | ||||||
|---|---|---|---|---|---|---|---|
| Quadrant | DetID | PixID | Counts | Sigma | Mean | Median | Sigma |
| A | 15 | 239 | 4125075 | 27384.6 | 733 | 716 | 150.6 |
| A | 0 | 226 | 6506 | 38.44 | 733 | 716 | 150.6 |
| A | 12 | 194 | 5379 | 30.96 | 733 | 716 | 150.6 |
| B | 4 | 173 | 115451 | 726.85 | 818 | 797 | 157.7 |
| B | 0 | 189 | 23262 | 142.42 | 818 | 797 | 157.7 |
| B | 12 | 111 | 18554 | 112.57 | 818 | 797 | 157.7 |
| C | 14 | 238 | 121074 | 644.04 | 789 | 795 | 186.8 |
| C | 3 | 233 | 21201 | 109.26 | 789 | 795 | 186.8 |
| C | 7 | 247 | 11482 | 57.22 | 789 | 795 | 186.8 |
| D | 1 | 52 | 8626378 | 57530.83 | 609 | 593 | 149.9 |
| D | 7 | 223 | 32132 | 210.35 | 609 | 593 | 149.9 |
| D | 2 | 234 | 20476 | 132.61 | 609 | 593 | 149.9 |
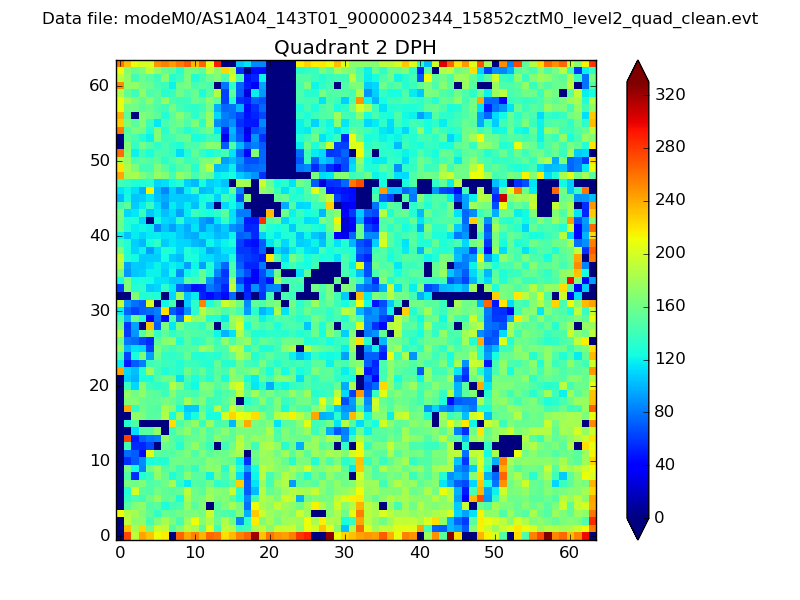
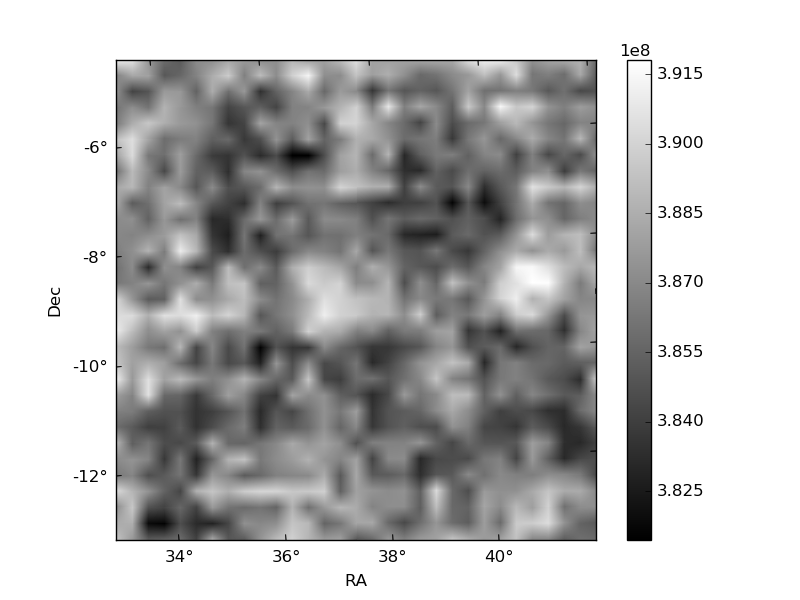
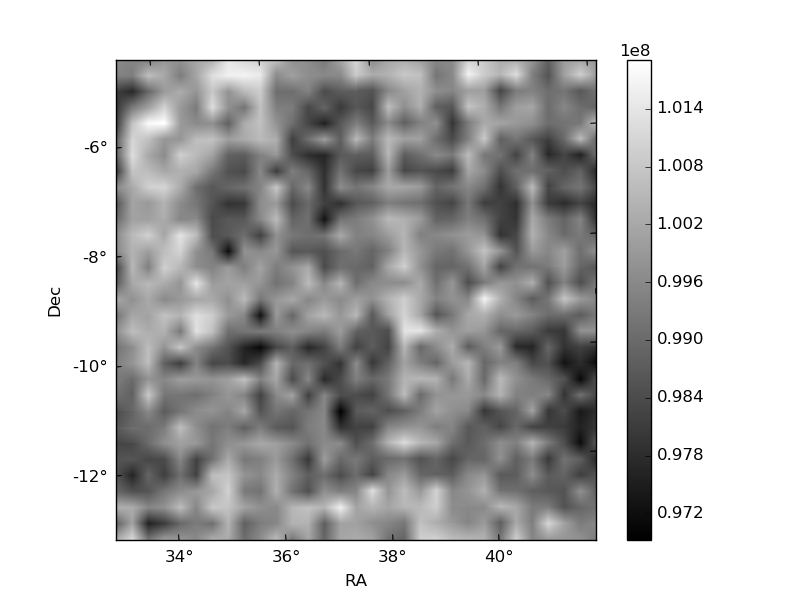
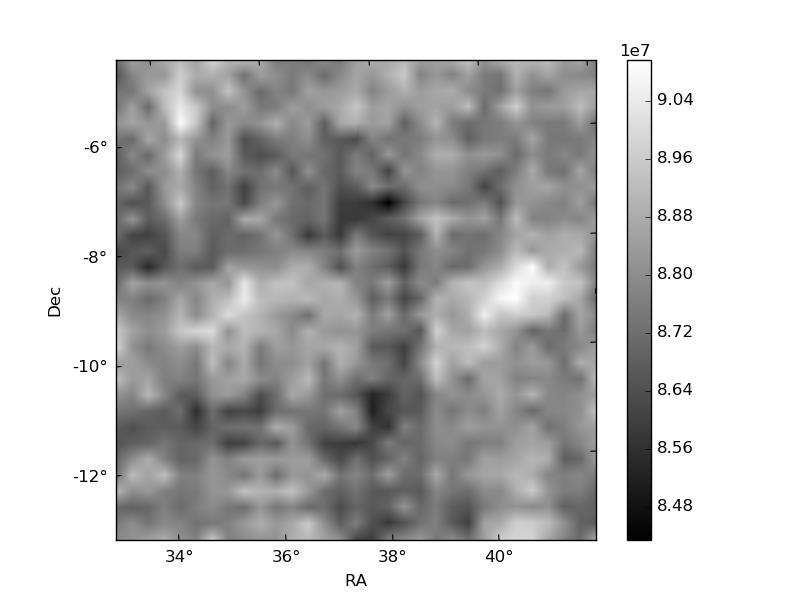
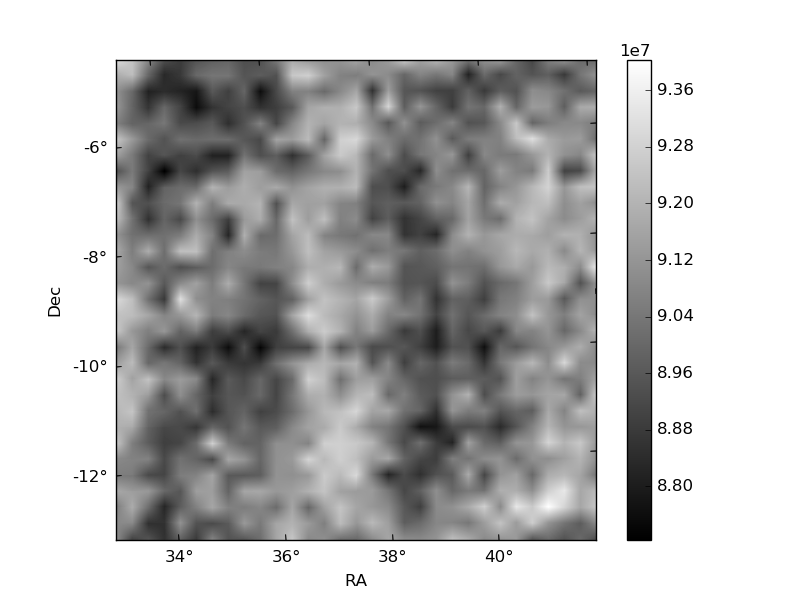
Histogram calculated using DETX and DETY for each event in the final _common_clean file
| Quadrant A | 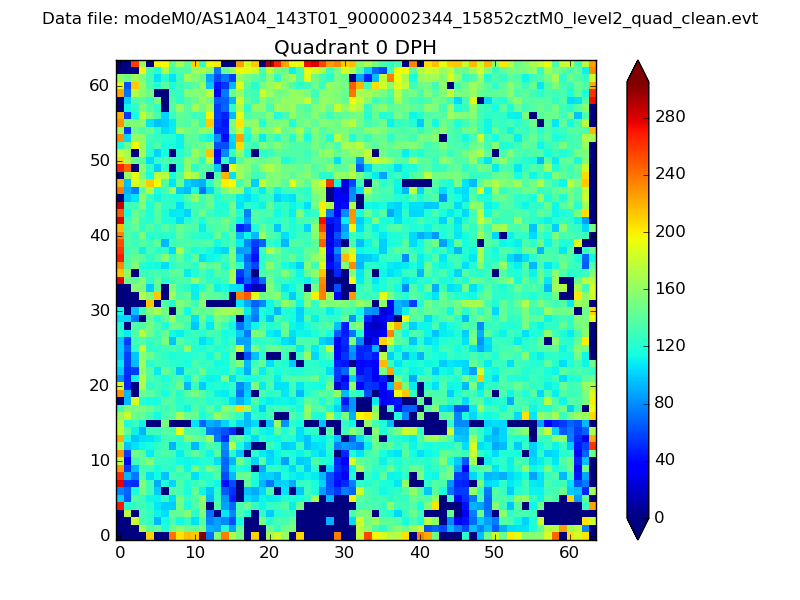 |
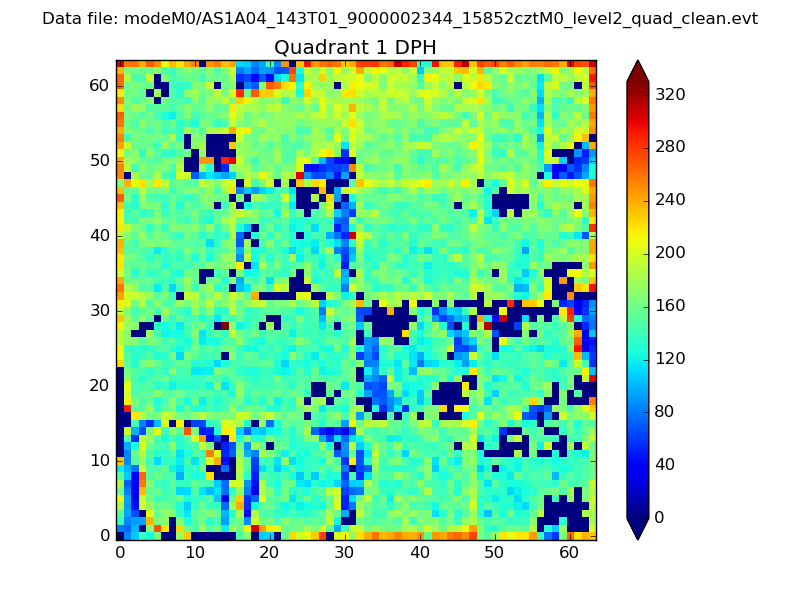 |
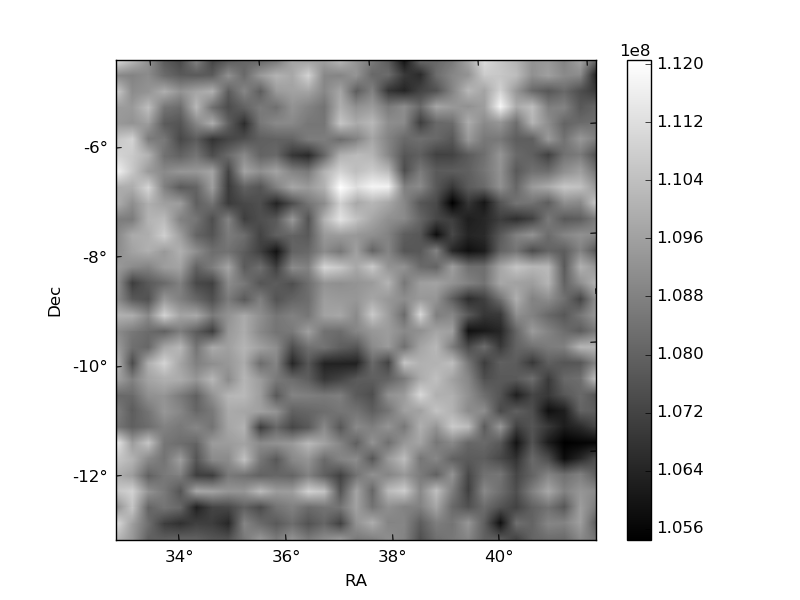
Quadrant B |
|---|---|---|---|
| Quadrant D | 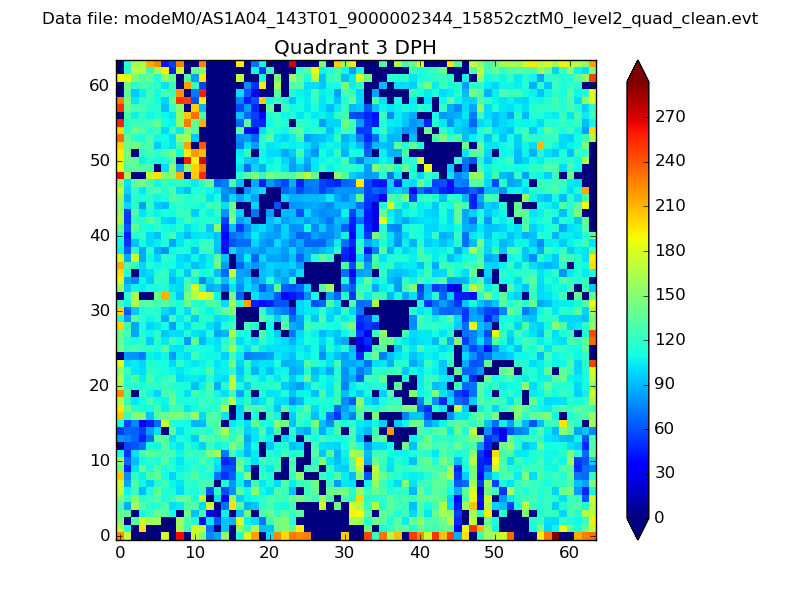 |
 |
Quadrant C |
| Plot type | Count rate plots | Images |
|---|---|---|
| Comparison with Poisson distribution Blue bars denote a histogram of data divided into 1 sec bins. Red curve is a Poisson curve with rate = median count rate of data. |
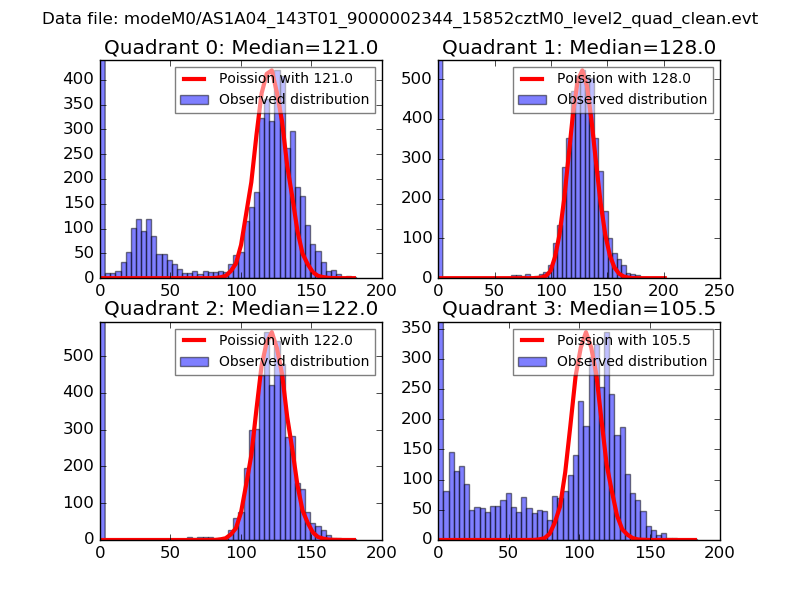 |
 |
| Quadrant-wise count rates Data is divided into 100 sec bins |
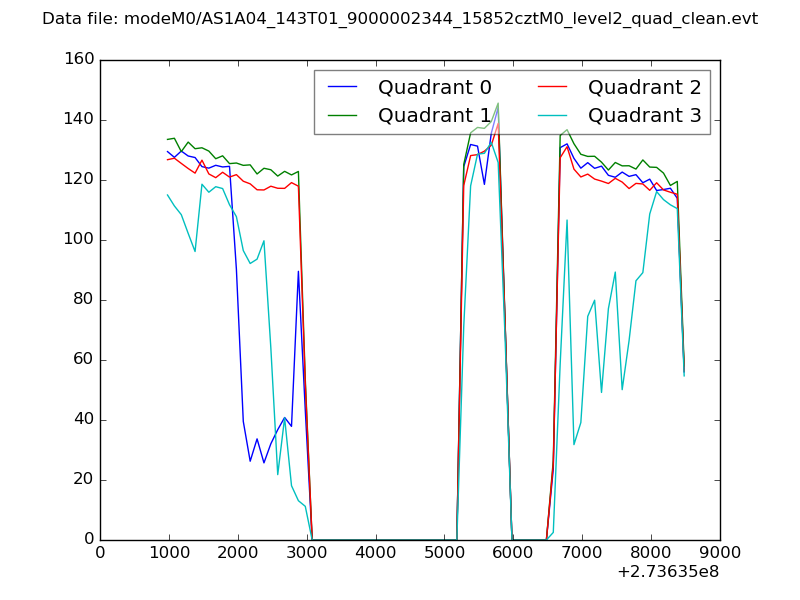 |
|
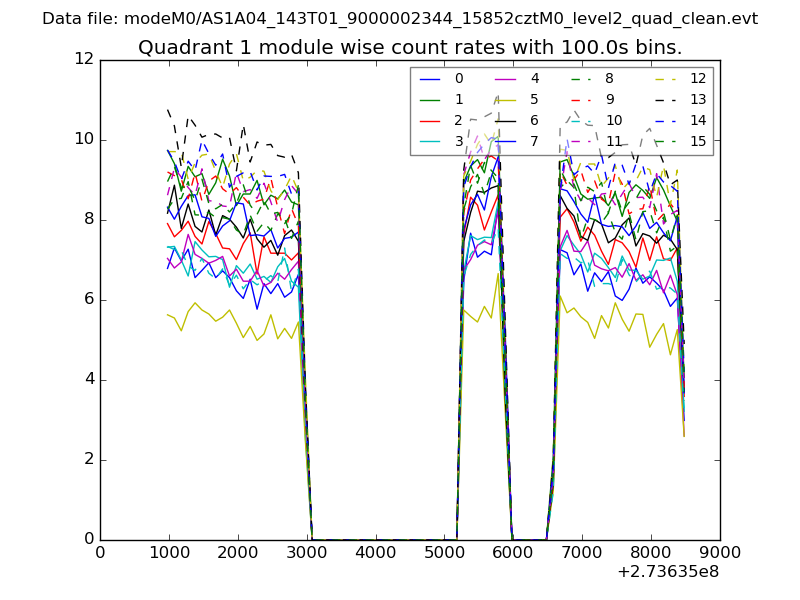
| Module-wise count rates for Quadrant A Data is divided into 100 sec bins |
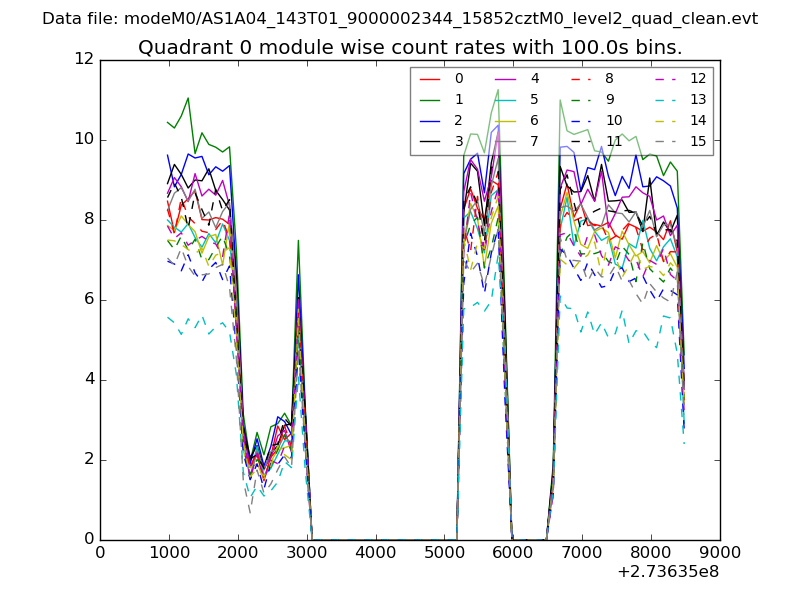 |
 |
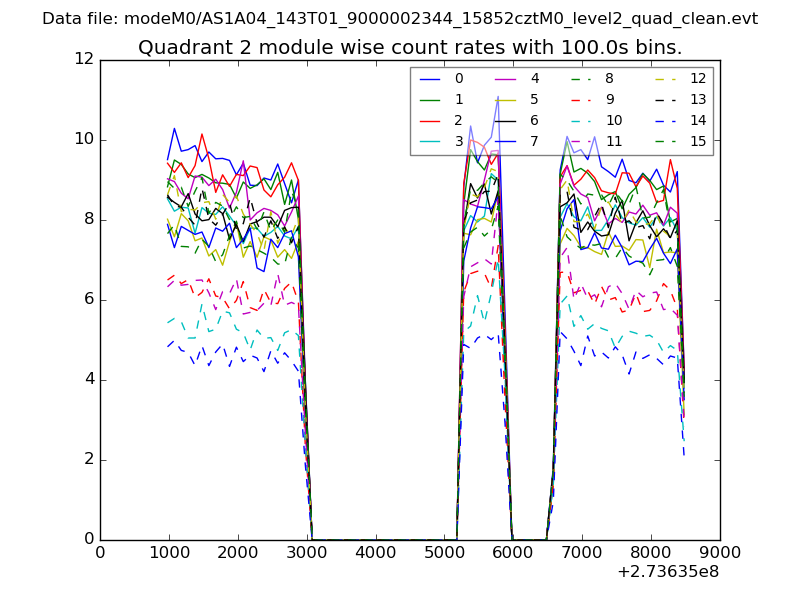
| Module-wise count rates for Quadrant B Data is divided into 100 sec bins |
 |
 |
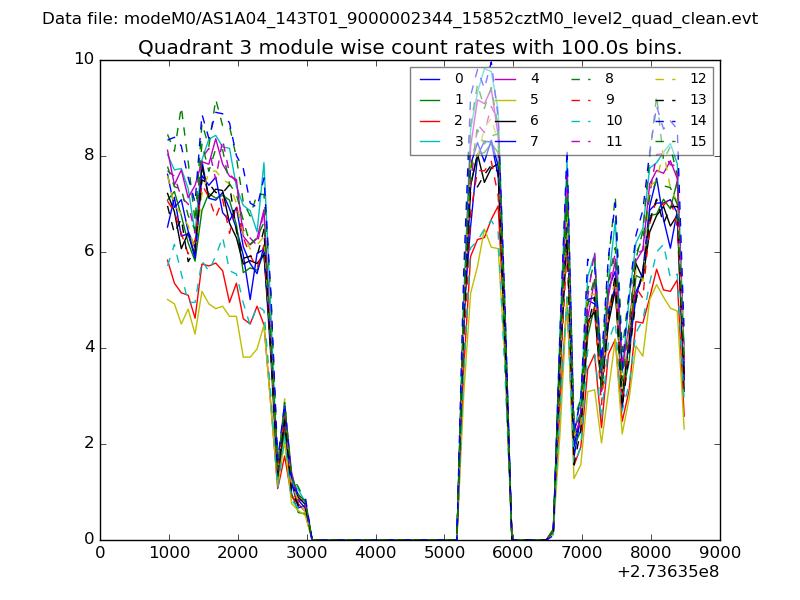
| Module-wise count rates for Quadrant C Data is divided into 100 sec bins |
 |
 |
| Module-wise count rates for Quadrant D Data is divided into 100 sec bins |
 |
 |
| Parameter | Plot |
|---|---|
| CZT HV Monitor | 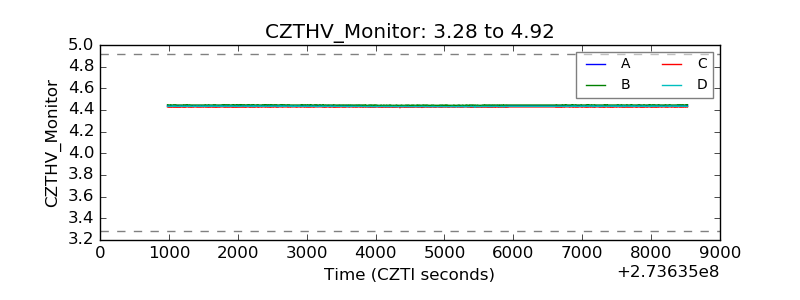 |
| D_VDD | 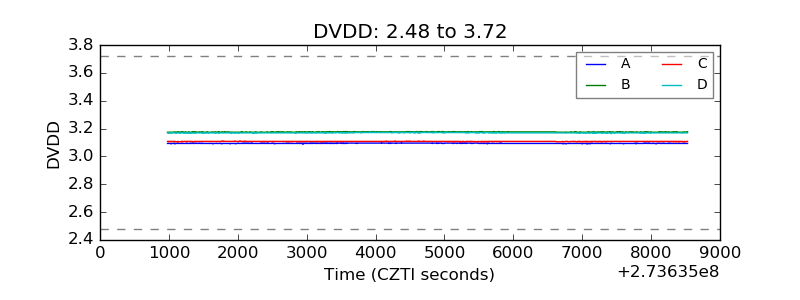 |
| Temperature 1 | 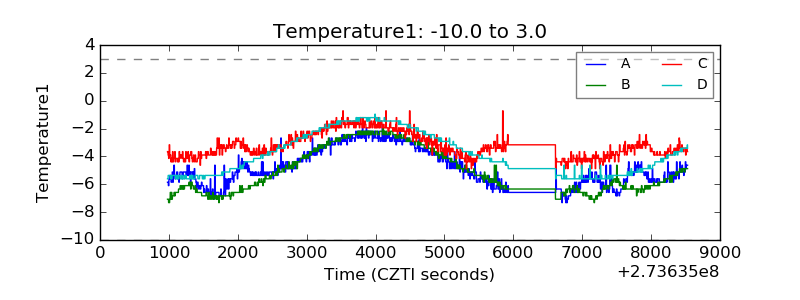 |
| Veto HV Monitor | 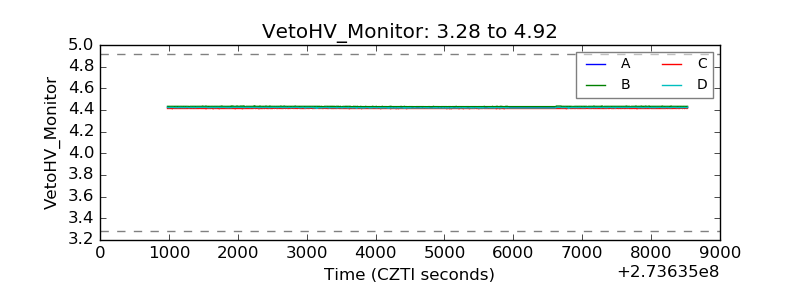 |
| Veto LLD | 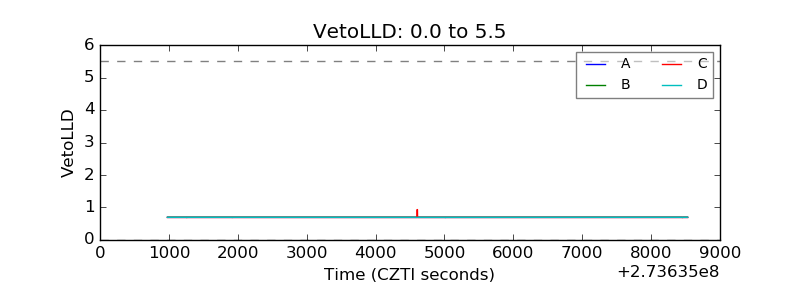 |
| Alpha Counter | 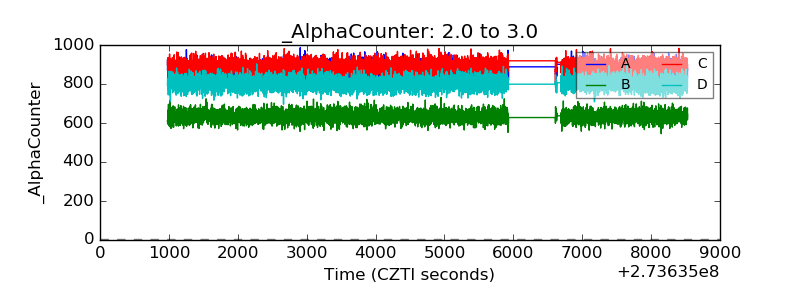 |
| _CPM_Rate | 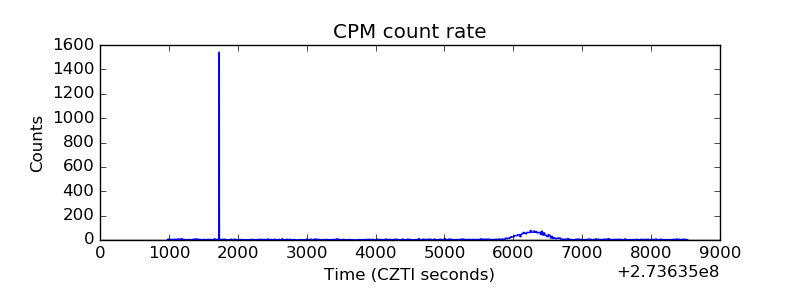 |
| CZT Counter | 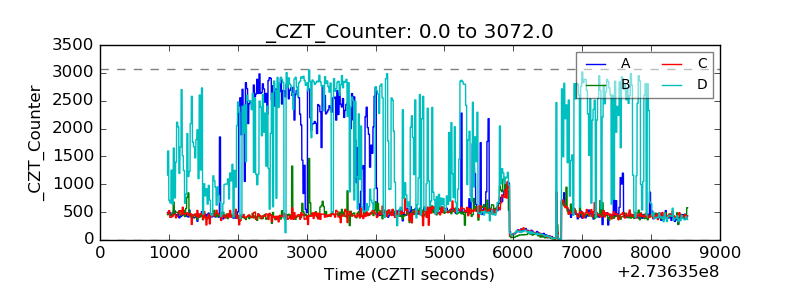 |
| +2.5 Volts monitor | 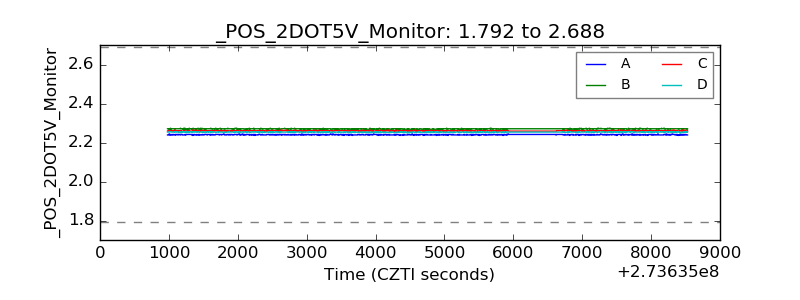 |
| +5 Volts monitor | 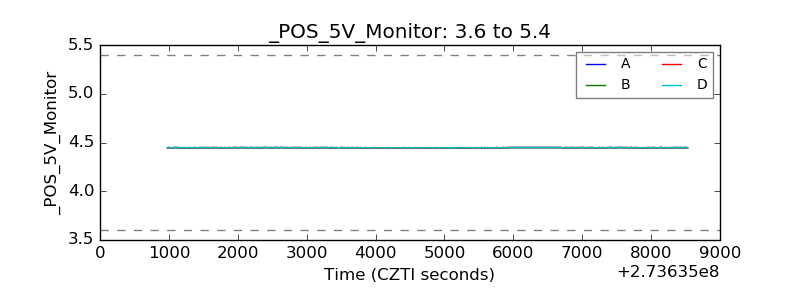 |
| _ROLL_ROT |  |
| _Roll_DEC | 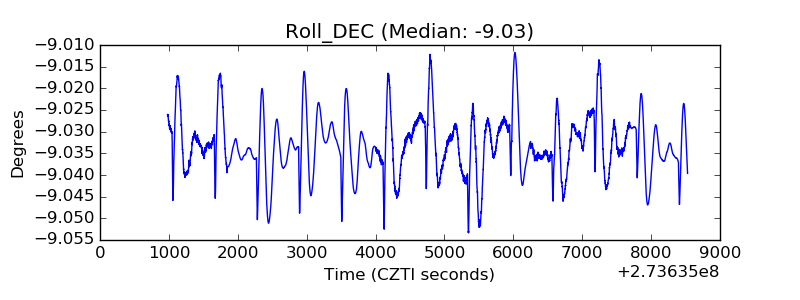 |
| _Roll_RA | 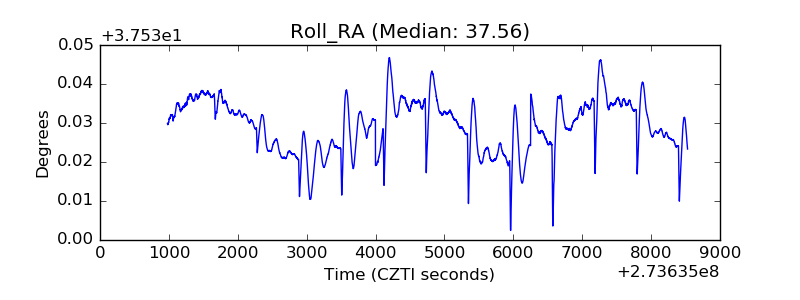 |
| Veto Counter | 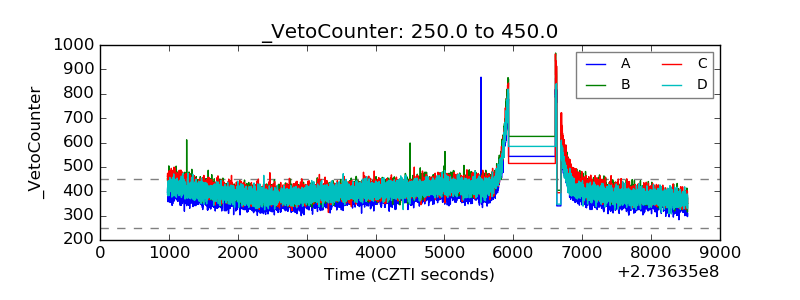 |