| Param | Original file | Final file |
|---|---|---|
| Filename | modeM0/AS1A04_143T01_9000002344_15857cztM0_level2.evt | modeM0/AS1A04_143T01_9000002344_15857cztM0_level2_quad_clean.evt |
| Size (bytes) | 883,756,800 | 131,054,400 |
| Size | 842.8 MB | 125.0 MB |
| Events in quadrant A | 8,275,502 | 773,689 |
| Events in quadrant B | 6,157,456 | 803,110 |
| Events in quadrant C | 5,874,094 | 769,478 |
| Events in quadrant D | 5,611,664 | 758,782 |
| Mode SS | |||
|---|---|---|---|
| Quadrant | BADHDUFLAG | Total packets | Discarded packets |
| A | 0 | 252 | 0 |
| B | 0 | 252 | 0 |
| C | 0 | 252 | 0 |
| D | 0 | 252 | 0 |
| Mode M0 | |||
|---|---|---|---|
| Quadrant | BADHDUFLAG | Total packets | Discarded packets |
| A | 0 | 32822 | 3 |
| B | 0 | 26182 | 2 |
| C | 0 | 25427 | 2 |
| D | 0 | 25546 | 2 |
| Mode M9 | |||
|---|---|---|---|
| Quadrant | BADHDUFLAG | Total packets | Discarded packets |
| A | 0 | 12 | 0 |
| B | 0 | 12 | 0 |
| C | 0 | 12 | 0 |
| D | 0 | 12 | 0 |
| Quadrant | Total seconds | Saturated seconds | Saturation percentage |
|---|---|---|---|
| A | 12489 | 903 | 7.230363% |
| B | 12489 | 157 | 1.257106% |
| C | 12489 | 159 | 1.273120% |
| D | 12489 | 101 | 0.808712% |
Noise dominated data is calculated using 1-second bins in cleaned event files. If a bin has >2000 counts, and if more than 50% of those come from <1% of pixels, then it is considered to be noise-dominated and hence unusable.
| Quadrant | # 1 sec bins | Bins with >0 counts | Bins with >2000 counts | High rate bins dominated by noise | Noise dominated (total time) | Noise dominated (detector-on time) | Marked lightcurve |
|---|---|---|---|---|---|---|---|
| A | 13770 | 12491 | 473 | 473 | 3.44% | 3.79% | 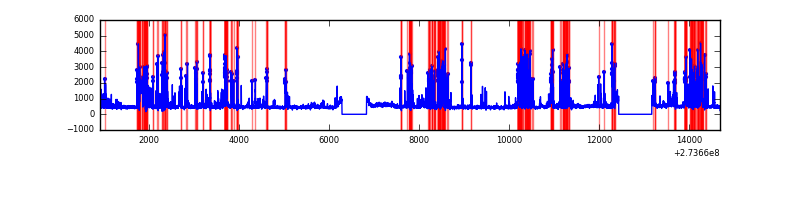 |
| B | 13770 | 12491 | 7 | 7 | 0.05% | 0.06% | 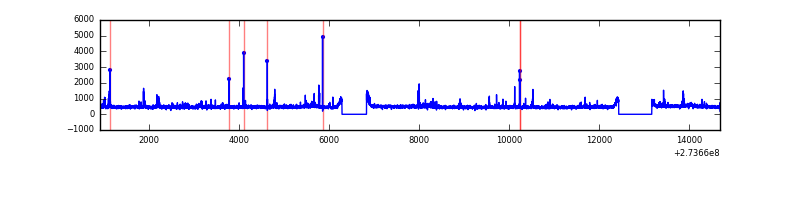 |
| C | 13770 | 12491 | 0 | 0 | 0.00% | 0.00% | 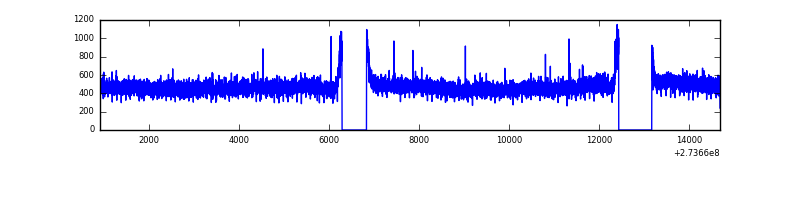 |
| D | 13770 | 12491 | 2 | 2 | 0.01% | 0.02% | 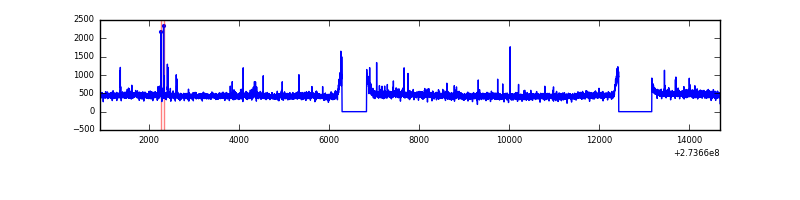 |
Top three noisy pixels from each quadrant. If the there are fewer than three noisy pixels in the level2.evt file, extra rows are filled as -1
| Pixel properties | Quadrant properties | ||||||
|---|---|---|---|---|---|---|---|
| Quadrant | DetID | PixID | Counts | Sigma | Mean | Median | Sigma |
| A | 15 | 239 | 2661549 | 8987.36 | 1449 | 1417 | 296.0 |
| A | 9 | 143 | 29546 | 95.03 | 1449 | 1417 | 296.0 |
| A | 15 | 157 | 15966 | 49.15 | 1449 | 1417 | 296.0 |
| B | 4 | 173 | 79647 | 270.29 | 1495 | 1454 | 289.3 |
| B | 10 | 245 | 53978 | 181.56 | 1495 | 1454 | 289.3 |
| B | 4 | 48 | 39507 | 131.54 | 1495 | 1454 | 289.3 |
| C | 14 | 238 | 216714 | 638.31 | 1437 | 1445 | 337.2 |
| C | 3 | 233 | 43873 | 125.81 | 1437 | 1445 | 337.2 |
| C | 13 | 61 | 10065 | 25.56 | 1437 | 1445 | 337.2 |
| D | 2 | 234 | 50929 | 137.04 | 1465 | 1418 | 361.3 |
| D | 1 | 52 | 42197 | 112.87 | 1465 | 1418 | 361.3 |
| D | 14 | 226 | 14351 | 35.8 | 1465 | 1418 | 361.3 |
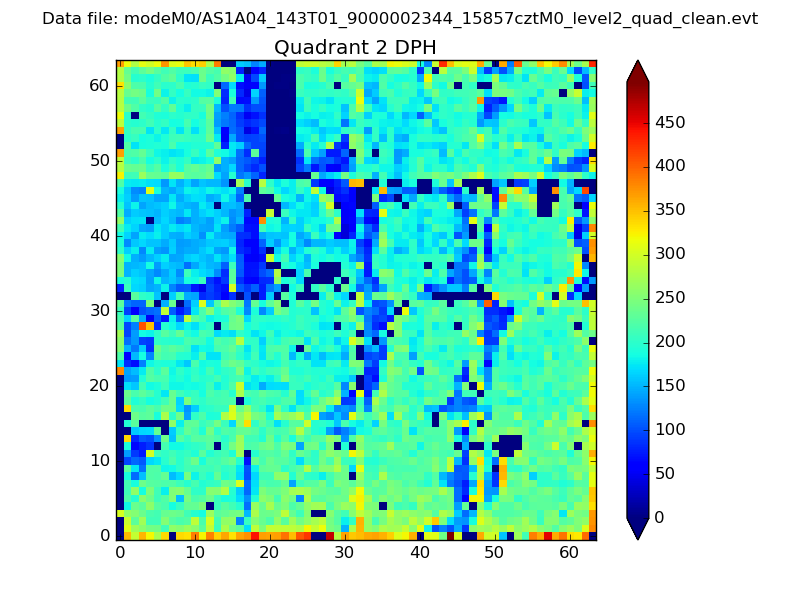
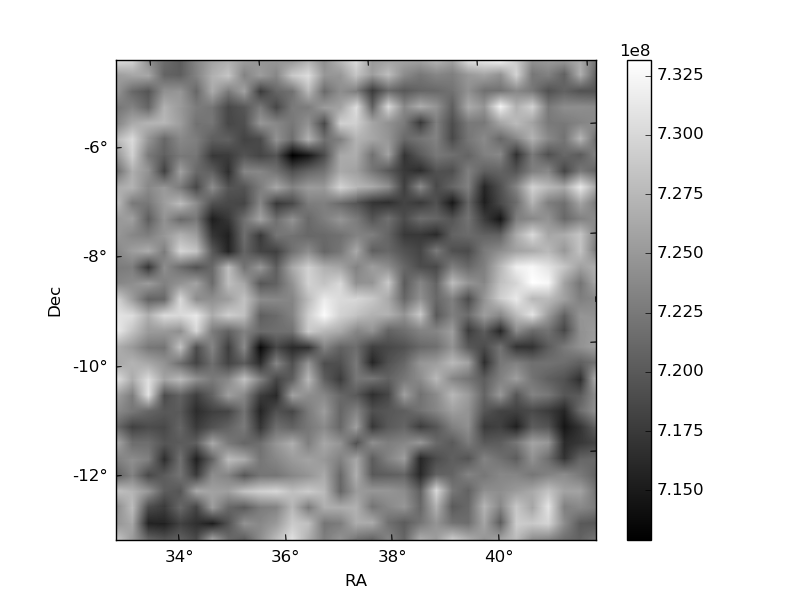
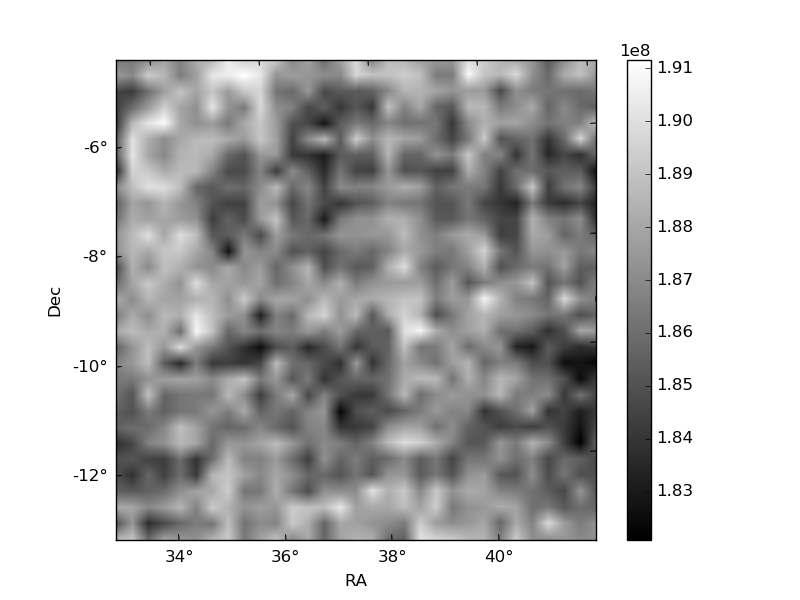
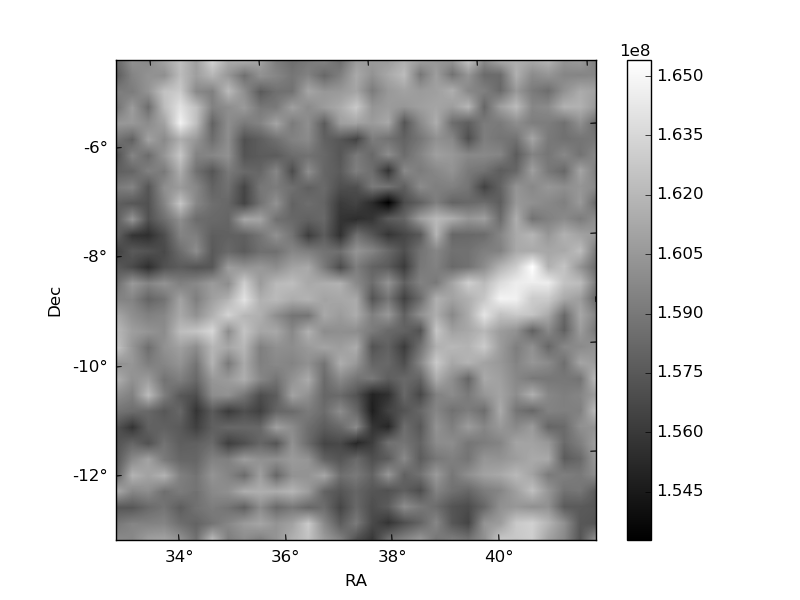
Histogram calculated using DETX and DETY for each event in the final _common_clean file
| Quadrant A | 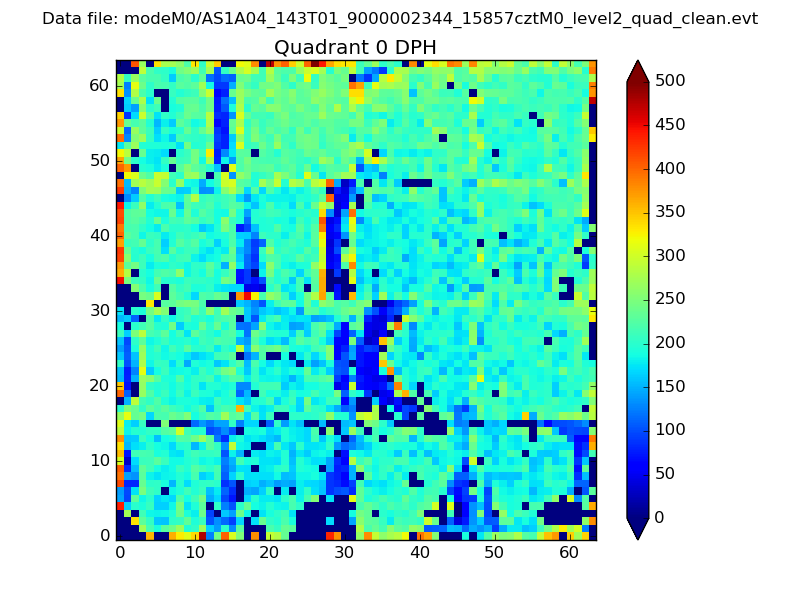 |
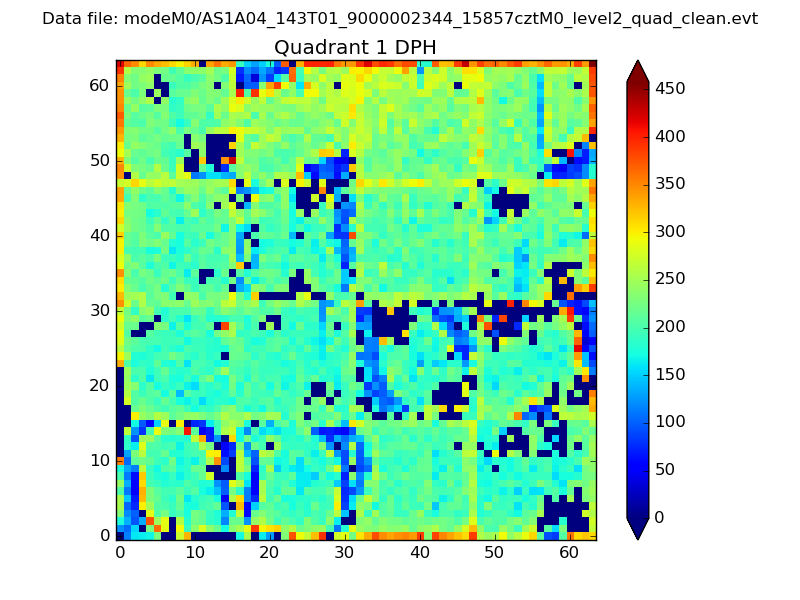 |
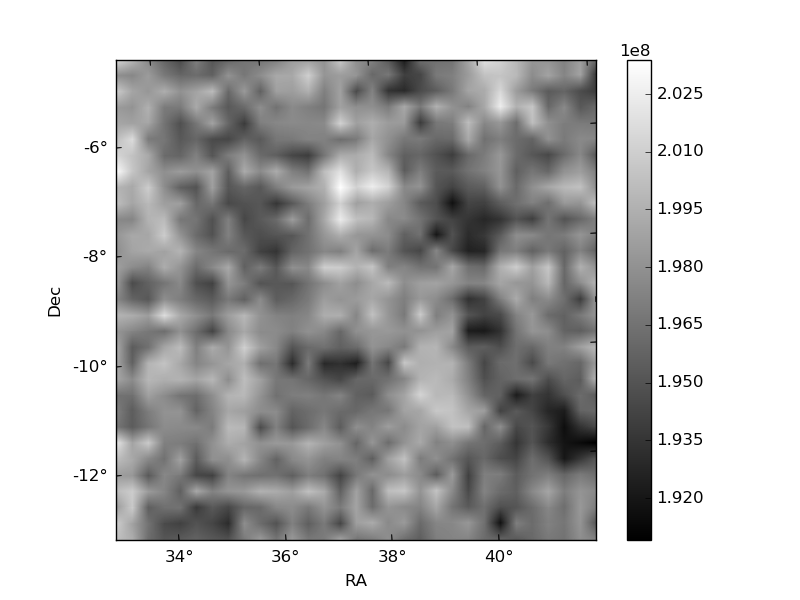
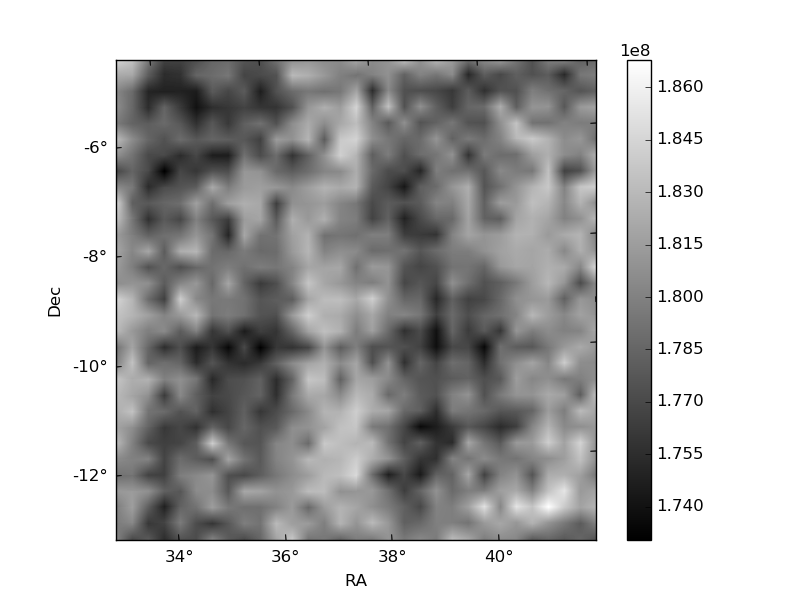
Quadrant B |
|---|---|---|---|
| Quadrant D | 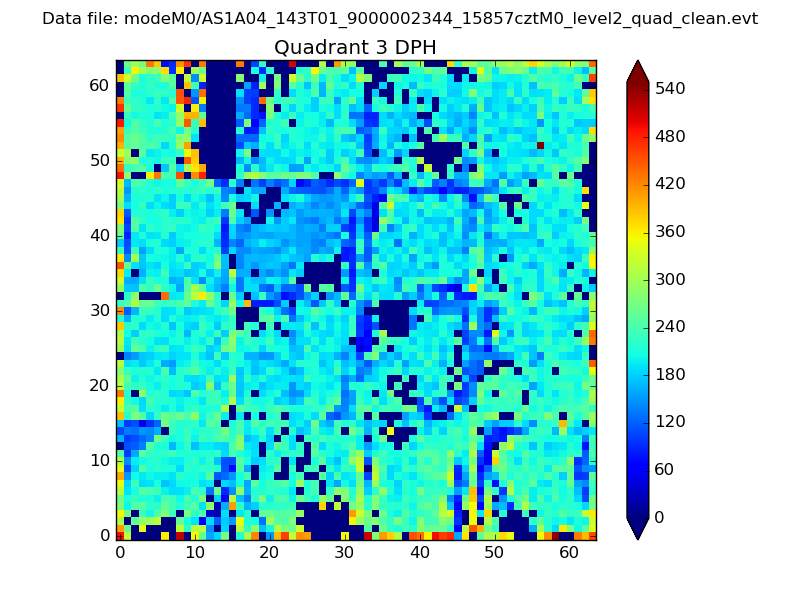 |
 |
Quadrant C |
| Plot type | Count rate plots | Images |
|---|---|---|
| Comparison with Poisson distribution Blue bars denote a histogram of data divided into 1 sec bins. Red curve is a Poisson curve with rate = median count rate of data. |
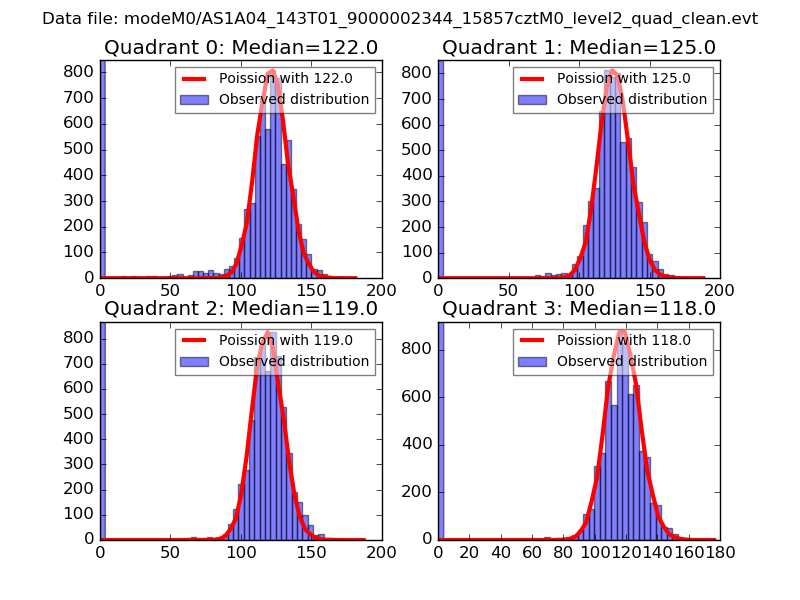 |
 |
| Quadrant-wise count rates Data is divided into 100 sec bins |
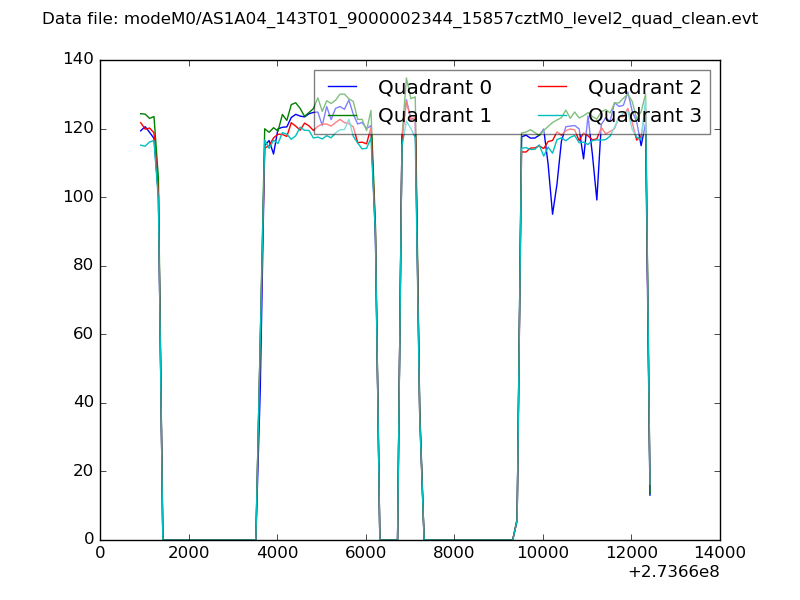 |
|
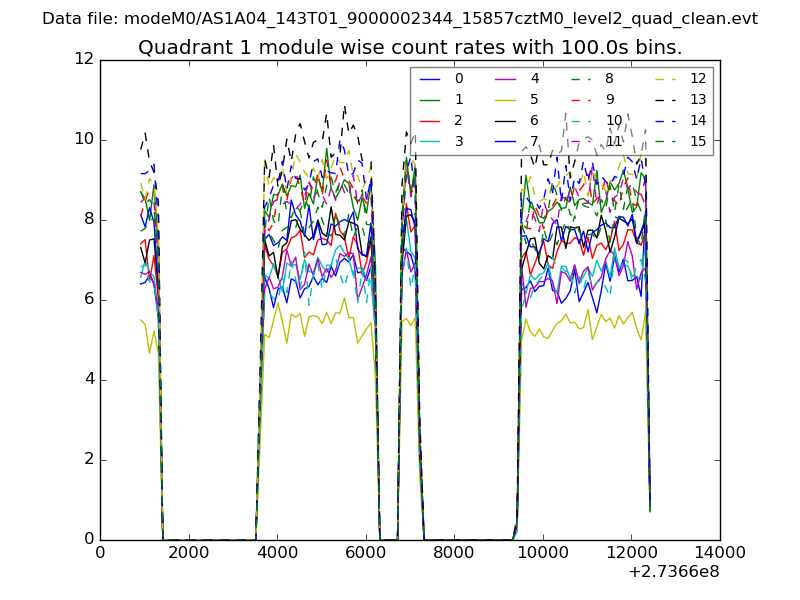
| Module-wise count rates for Quadrant A Data is divided into 100 sec bins |
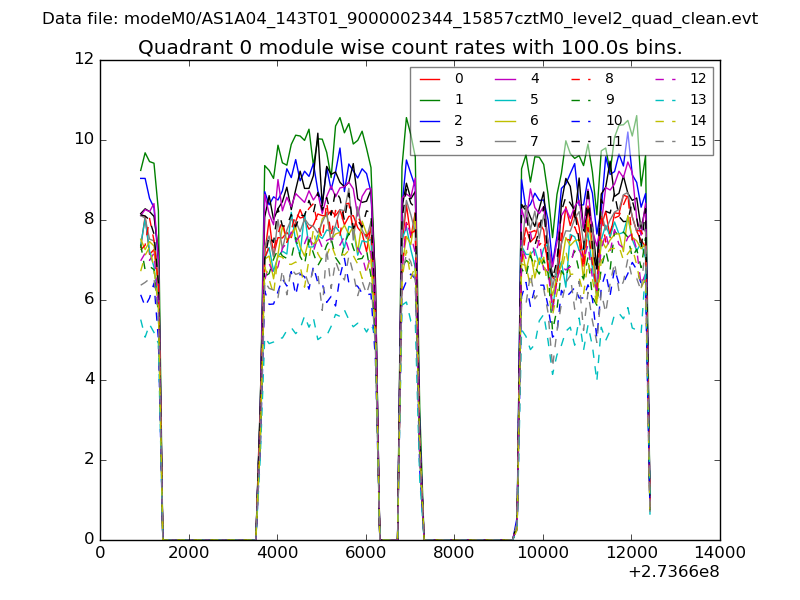 |
 |
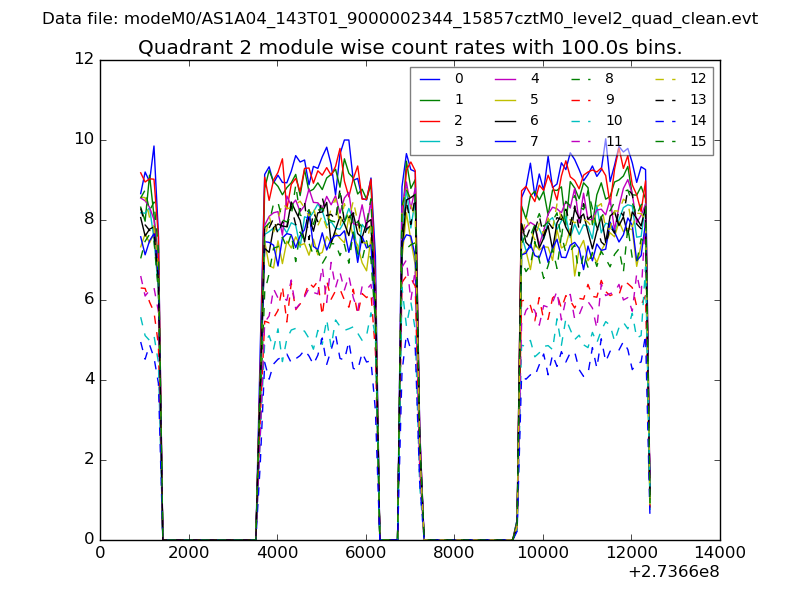
| Module-wise count rates for Quadrant B Data is divided into 100 sec bins |
 |
 |
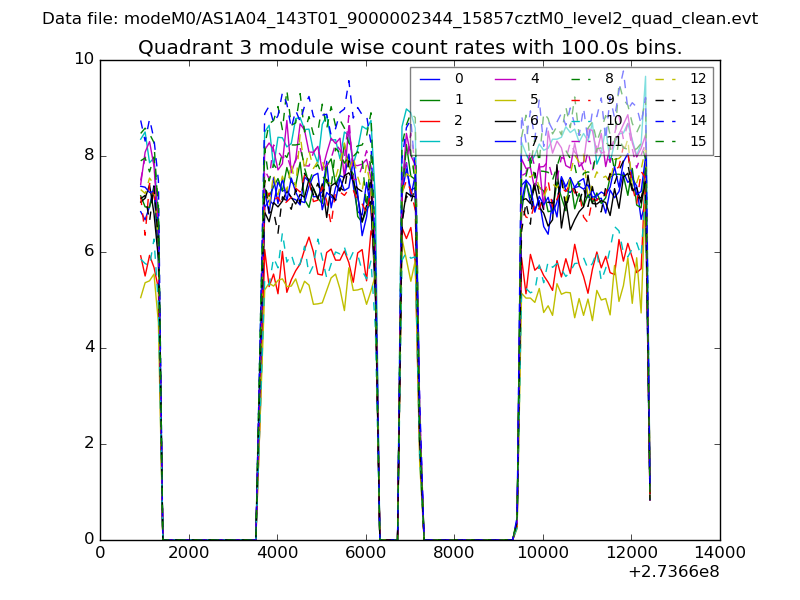
| Module-wise count rates for Quadrant C Data is divided into 100 sec bins |
 |
 |
| Module-wise count rates for Quadrant D Data is divided into 100 sec bins |
 |
 |
| Parameter | Plot |
|---|---|
| CZT HV Monitor | 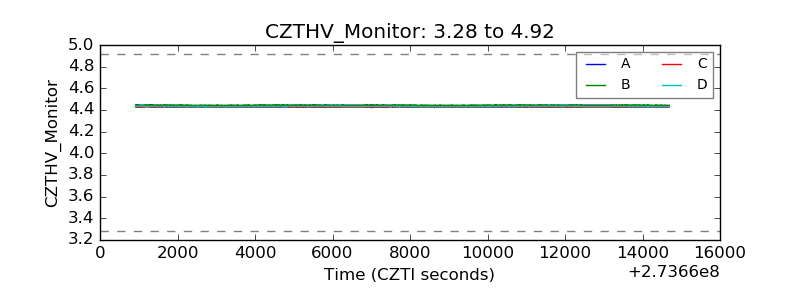 |
| D_VDD | 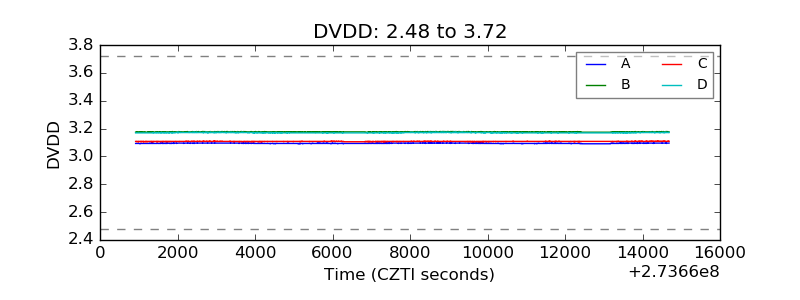 |
| Temperature 1 | 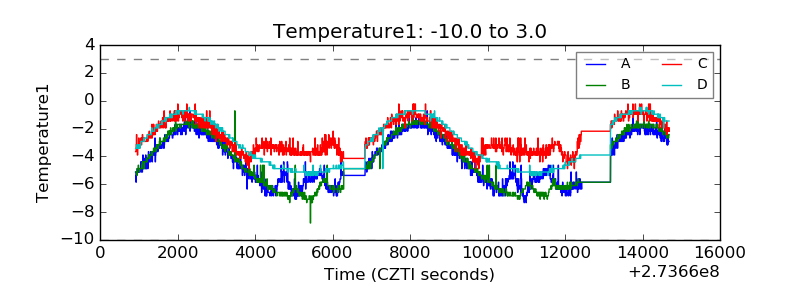 |
| Veto HV Monitor | 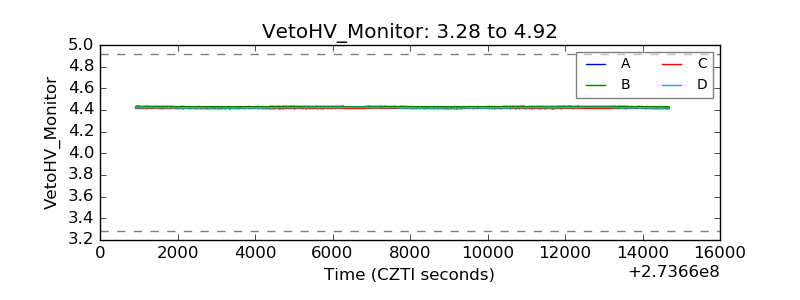 |
| Veto LLD | 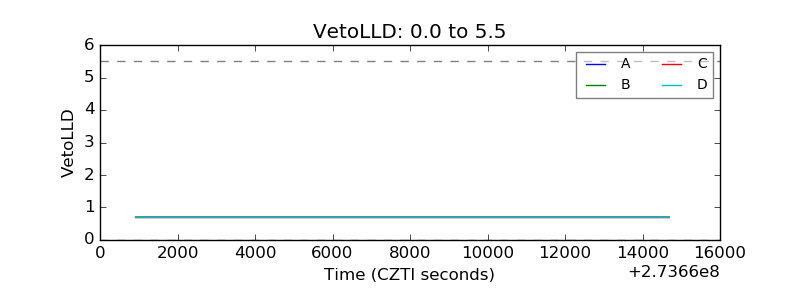 |
| Alpha Counter | 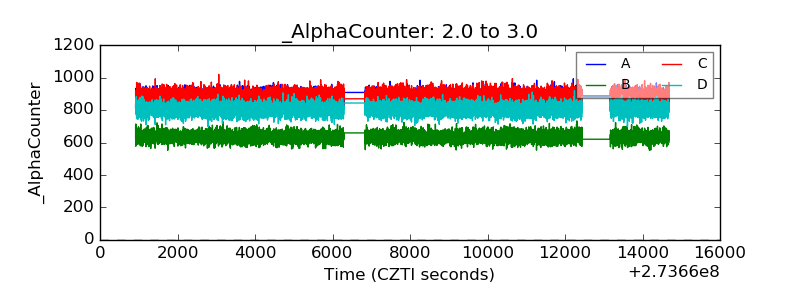 |
| _CPM_Rate | 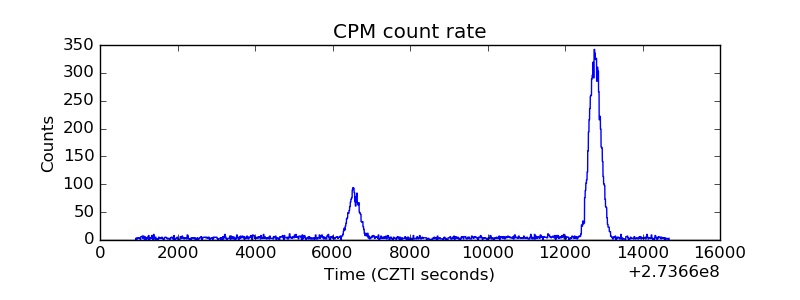 |
| CZT Counter | 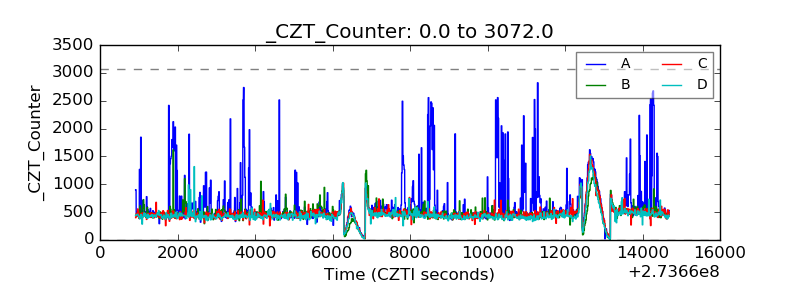 |
| +2.5 Volts monitor |  |
| +5 Volts monitor |  |
| _ROLL_ROT | 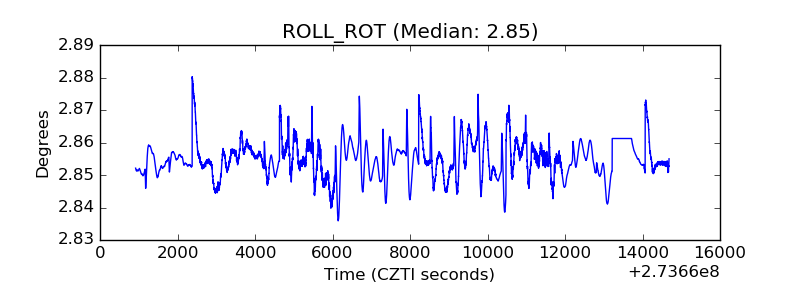 |
| _Roll_DEC | 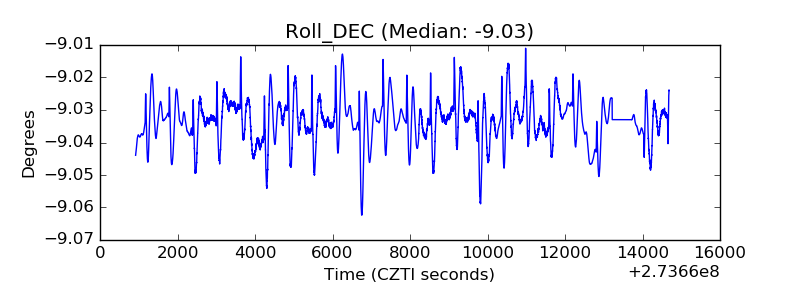 |
| _Roll_RA | 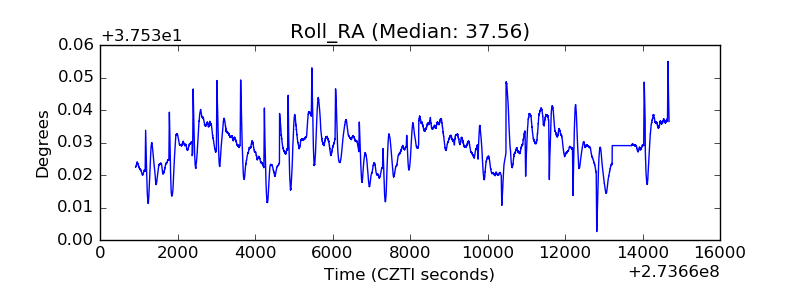 |
| Veto Counter | 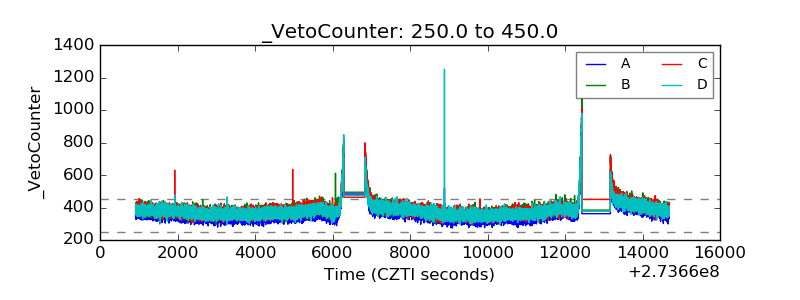 |