| Param | Original file | Final file |
|---|---|---|
| Filename | modeM0/AS1A04_143T01_9000002344_15858cztM0_level2.evt | modeM0/AS1A04_143T01_9000002344_15858cztM0_level2_quad_clean.evt |
| Size (bytes) | 2,484,100,800 | 391,985,280 |
| Size | 2.3 GB | 373.8 MB |
| Events in quadrant A | 20,760,707 | 2,390,699 |
| Events in quadrant B | 17,347,048 | 2,465,612 |
| Events in quadrant C | 16,382,454 | 2,362,504 |
| Events in quadrant D | 18,409,271 | 2,280,380 |
| Mode SS | |||
|---|---|---|---|
| Quadrant | BADHDUFLAG | Total packets | Discarded packets |
| A | 0 | 700 | 0 |
| B | 0 | 700 | 0 |
| C | 0 | 700 | 0 |
| D | 0 | 700 | 0 |
| Mode M0 | |||
|---|---|---|---|
| Quadrant | BADHDUFLAG | Total packets | Discarded packets |
| A | 0 | 84555 | 8 |
| B | 0 | 73723 | 7 |
| C | 0 | 70772 | 7 |
| D | 0 | 78906 | 7 |
| Mode M9 | |||
|---|---|---|---|
| Quadrant | BADHDUFLAG | Total packets | Discarded packets |
| A | 0 | 23 | 0 |
| B | 0 | 23 | 0 |
| C | 0 | 23 | 0 |
| D | 0 | 23 | 0 |
| Quadrant | Total seconds | Saturated seconds | Saturation percentage |
|---|---|---|---|
| A | 34513 | 1953 | 5.658737% |
| B | 34513 | 790 | 2.288993% |
| C | 34513 | 656 | 1.900733% |
| D | 34513 | 1347 | 3.902877% |
Noise dominated data is calculated using 1-second bins in cleaned event files. If a bin has >2000 counts, and if more than 50% of those come from <1% of pixels, then it is considered to be noise-dominated and hence unusable.
| Quadrant | # 1 sec bins | Bins with >0 counts | Bins with >2000 counts | High rate bins dominated by noise | Noise dominated (total time) | Noise dominated (detector-on time) | Marked lightcurve |
|---|---|---|---|---|---|---|---|
| A | 37960 | 34521 | 850 | 850 | 2.24% | 2.46% | 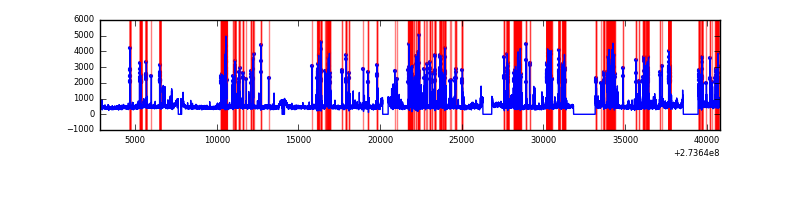 |
| B | 37960 | 34522 | 97 | 97 | 0.26% | 0.28% | 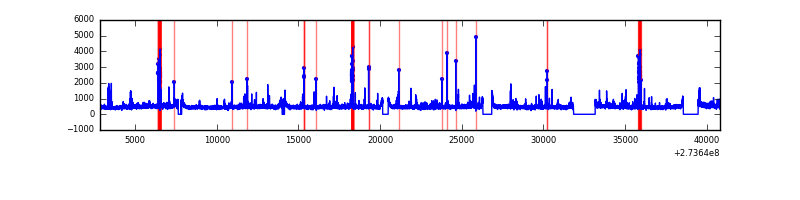 |
| C | 37960 | 34521 | 0 | 0 | 0.00% | 0.00% | 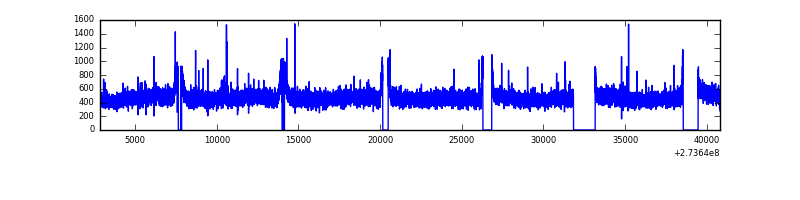 |
| D | 37960 | 34520 | 765 | 765 | 2.02% | 2.22% | 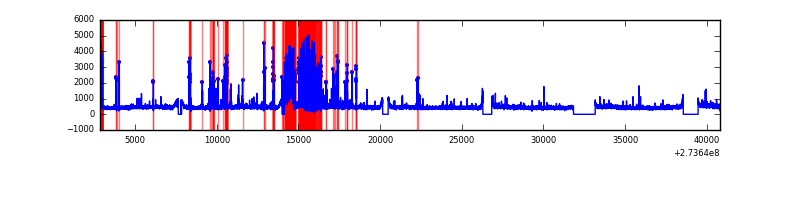 |
Top three noisy pixels from each quadrant. If the there are fewer than three noisy pixels in the level2.evt file, extra rows are filled as -1
| Pixel properties | Quadrant properties | ||||||
|---|---|---|---|---|---|---|---|
| Quadrant | DetID | PixID | Counts | Sigma | Mean | Median | Sigma |
| A | 15 | 239 | 4987776 | 6071.94 | 4074 | 3983 | 820.8 |
| A | 9 | 143 | 44574 | 49.45 | 4074 | 3983 | 820.8 |
| A | 0 | 226 | 36070 | 39.09 | 4074 | 3983 | 820.8 |
| B | 4 | 173 | 530703 | 662.7 | 4149 | 4039 | 794.7 |
| B | 4 | 216 | 142639 | 174.4 | 4149 | 4039 | 794.7 |
| B | 4 | 48 | 118583 | 144.13 | 4149 | 4039 | 794.7 |
| C | 14 | 238 | 607285 | 643.74 | 3994 | 4018 | 937.1 |
| C | 3 | 233 | 139489 | 144.56 | 3994 | 4018 | 937.1 |
| C | 0 | 207 | 31678 | 29.52 | 3994 | 4018 | 937.1 |
| D | 1 | 52 | 3000466 | 3076.3 | 4010 | 3891 | 974.1 |
| D | 2 | 234 | 138312 | 138.0 | 4010 | 3891 | 974.1 |
| D | 7 | 223 | 70462 | 68.34 | 4010 | 3891 | 974.1 |
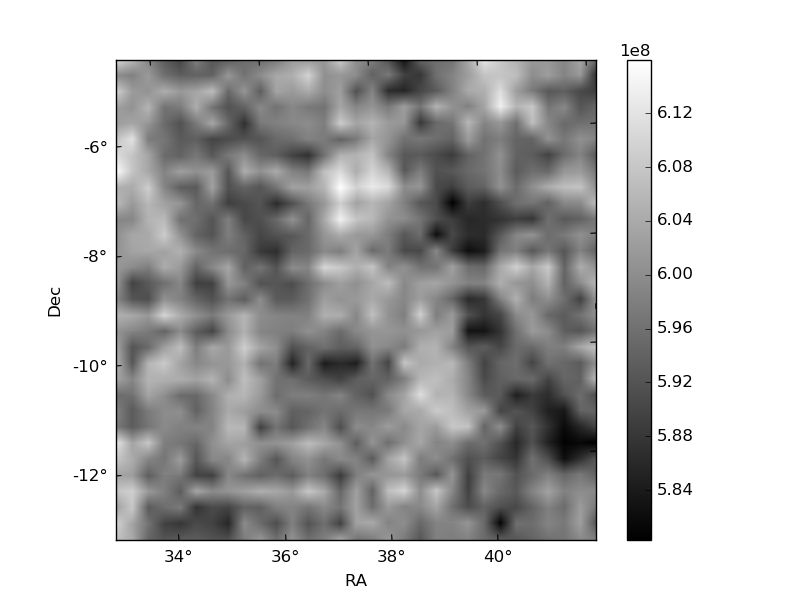
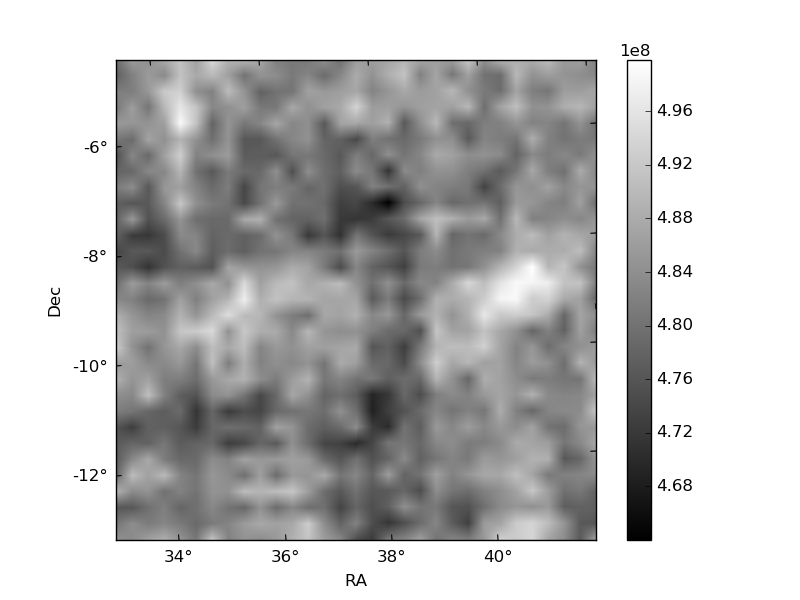
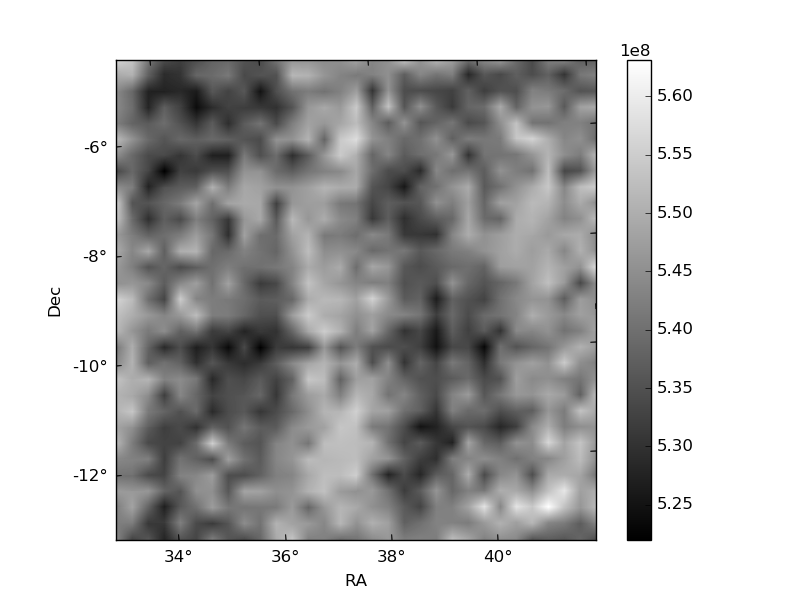
Histogram calculated using DETX and DETY for each event in the final _common_clean file
| Quadrant A | 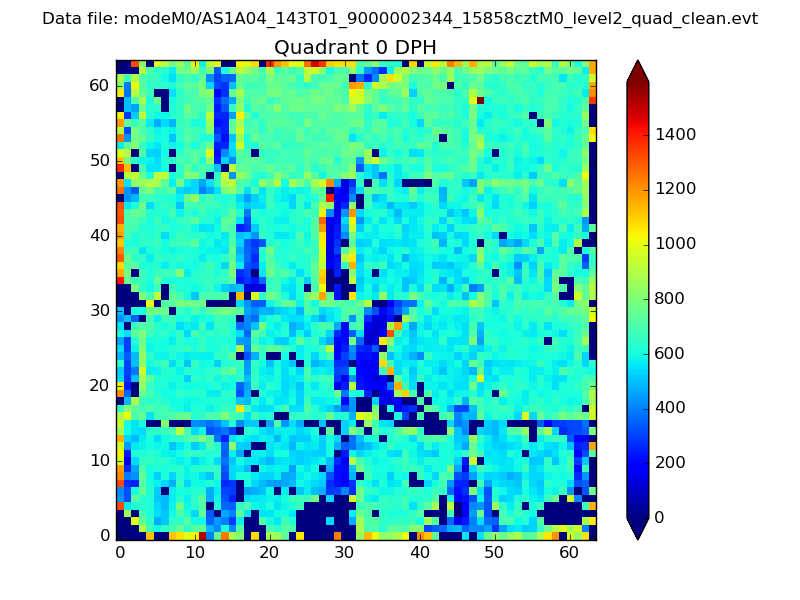 |
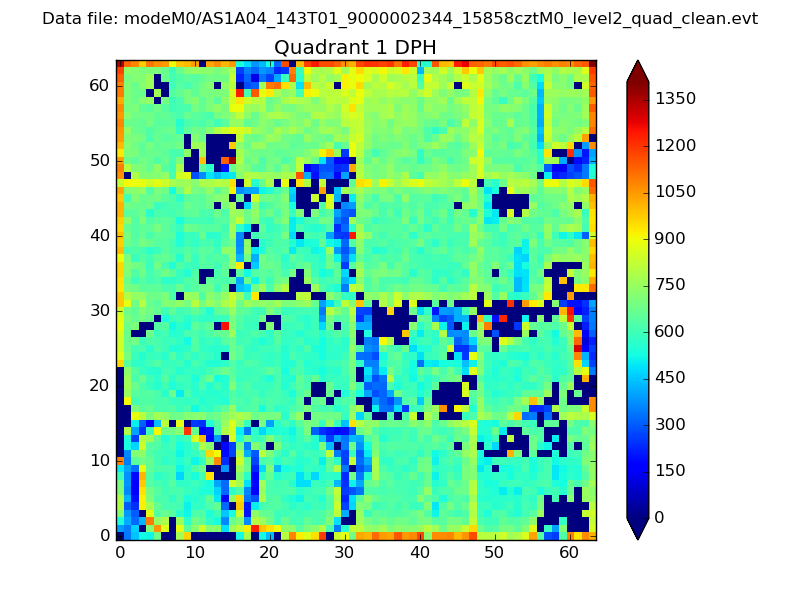 |
Quadrant B |
|---|---|---|---|
| Quadrant D | 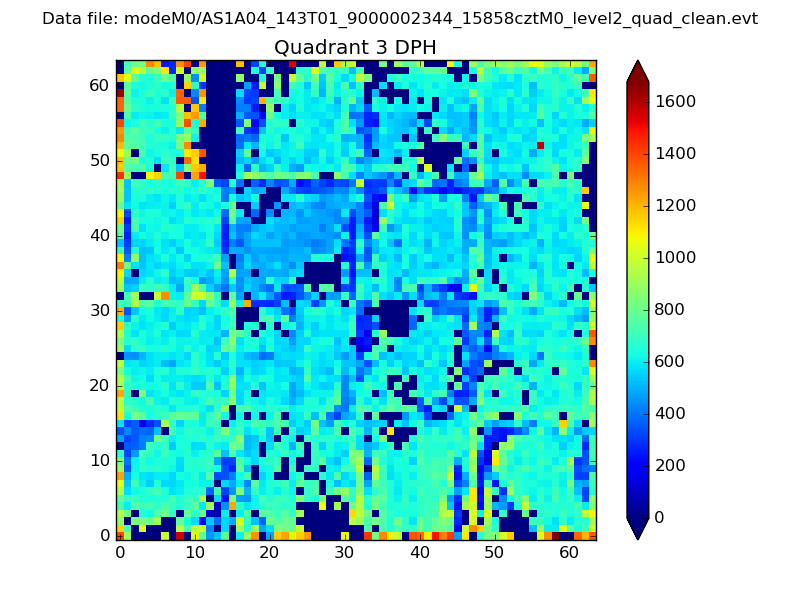 |
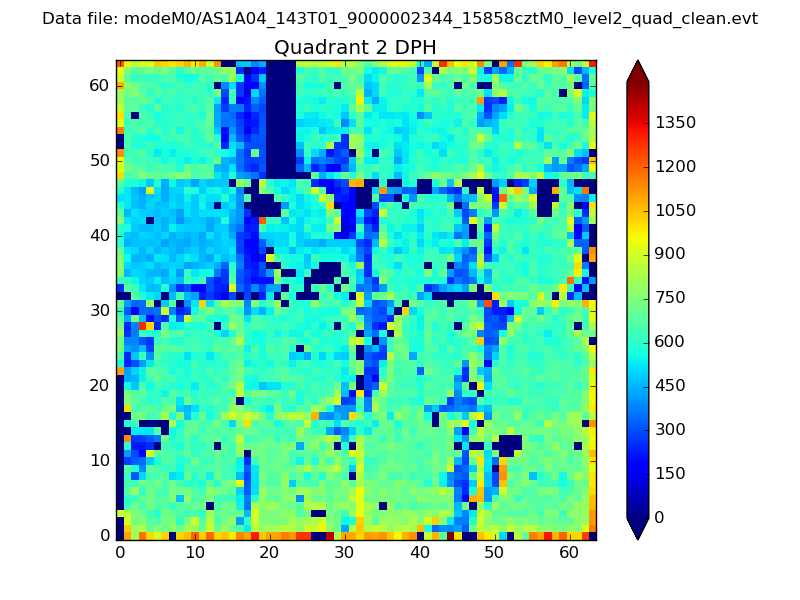 |
Quadrant C |
| Plot type | Count rate plots | Images |
|---|---|---|
| Comparison with Poisson distribution Blue bars denote a histogram of data divided into 1 sec bins. Red curve is a Poisson curve with rate = median count rate of data. |
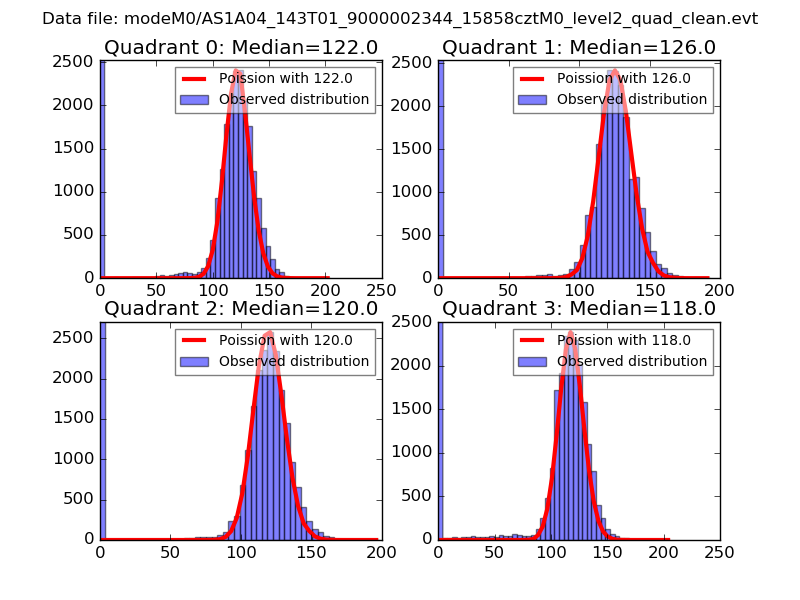 |
 |
| Quadrant-wise count rates Data is divided into 100 sec bins |
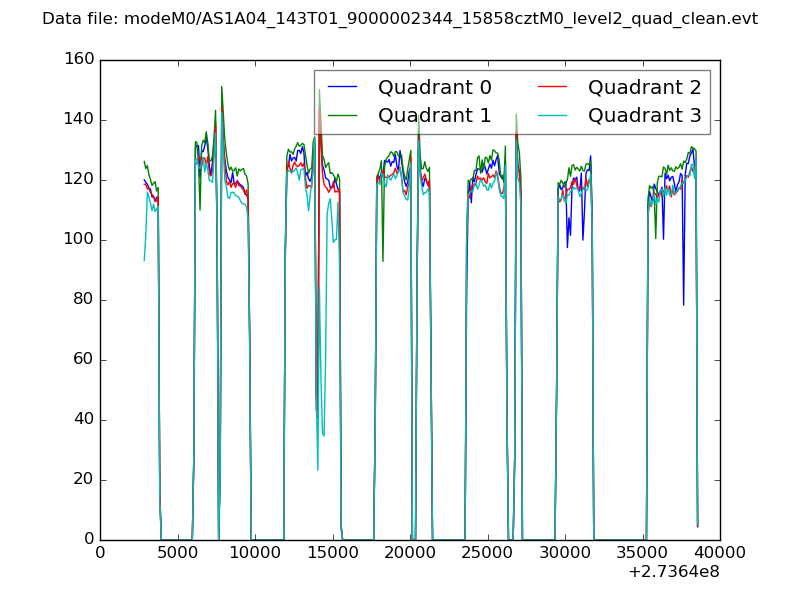 |
|
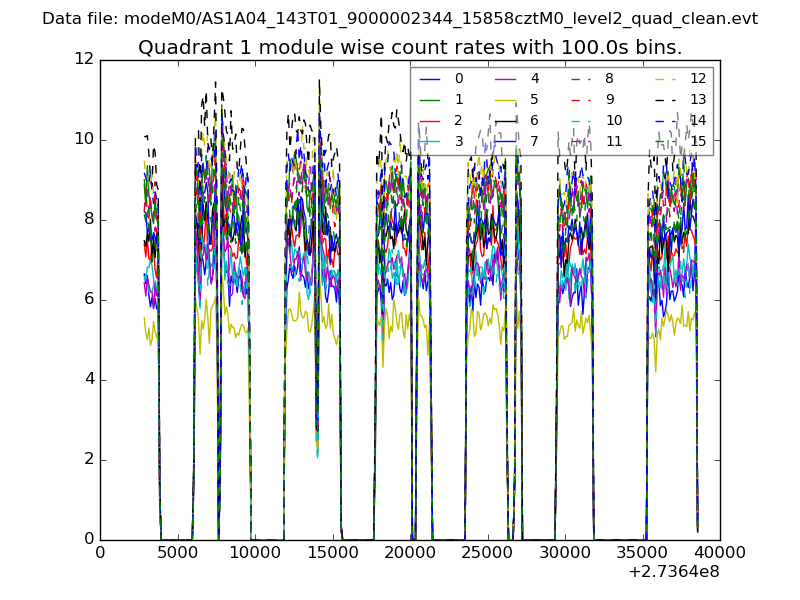
| Module-wise count rates for Quadrant A Data is divided into 100 sec bins |
 |
 |
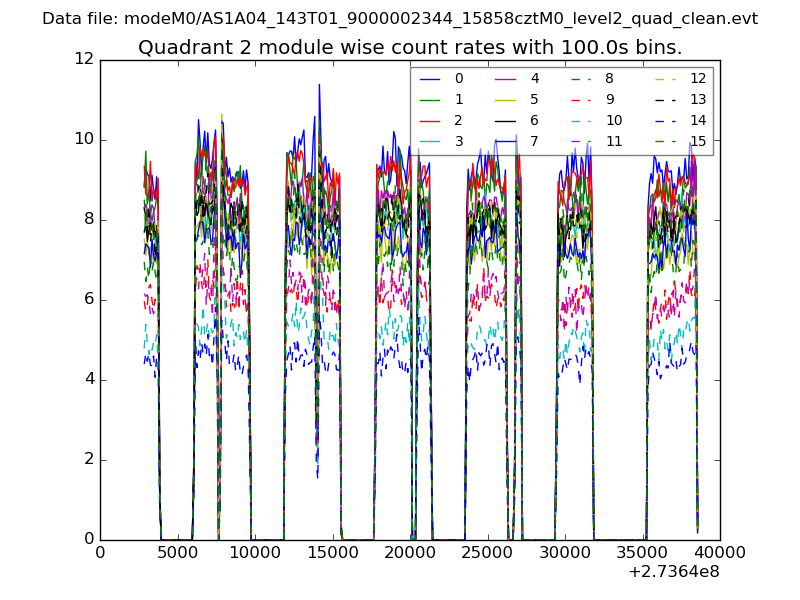
| Module-wise count rates for Quadrant B Data is divided into 100 sec bins |
 |
 |
| Module-wise count rates for Quadrant C Data is divided into 100 sec bins |
 |
 |
| Module-wise count rates for Quadrant D Data is divided into 100 sec bins |
 |
 |
| Parameter | Plot |
|---|---|
| CZT HV Monitor | 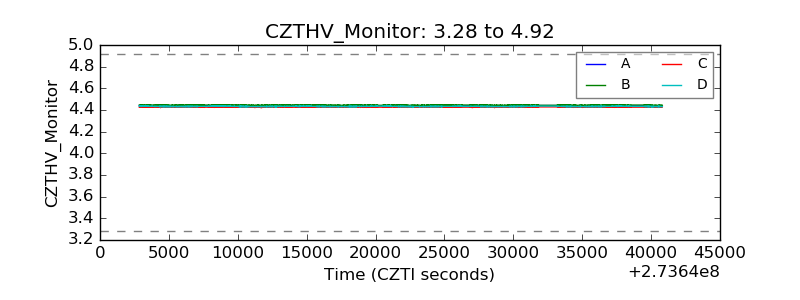 |
| D_VDD | 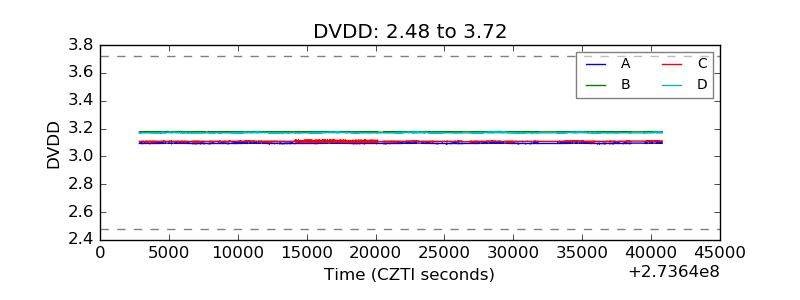 |
| Temperature 1 |  |
| Veto HV Monitor | 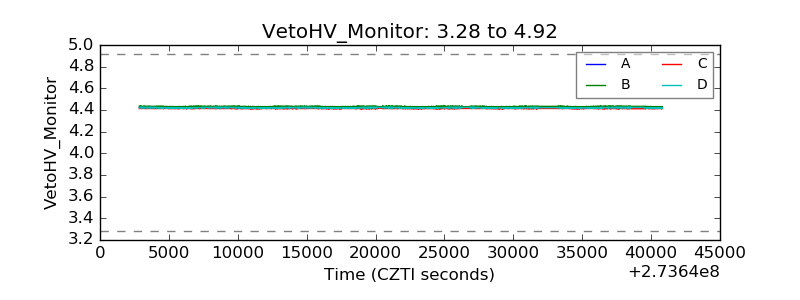 |
| Veto LLD | 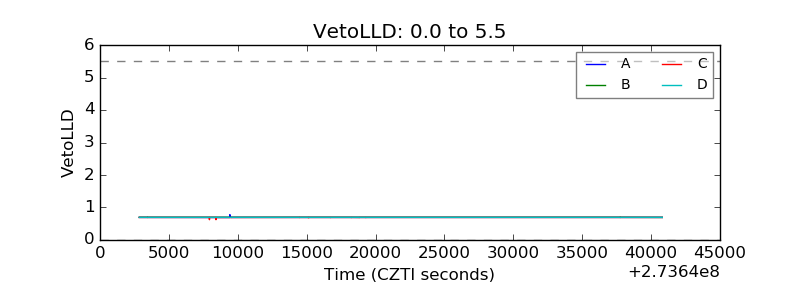 |
| Alpha Counter | 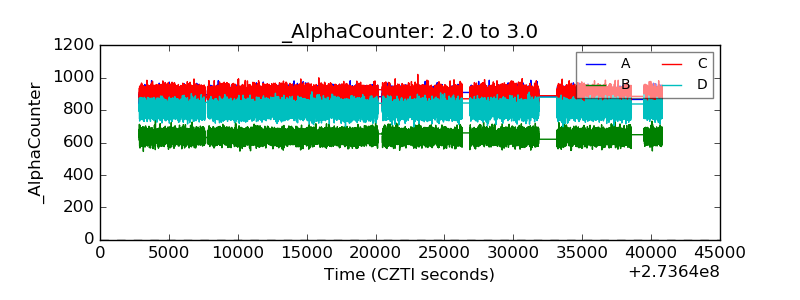 |
| _CPM_Rate | 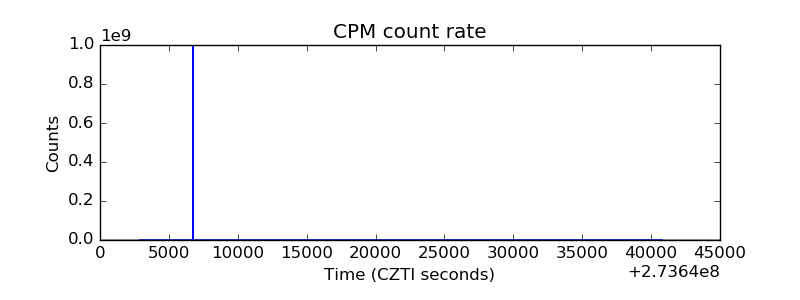 |
| CZT Counter | 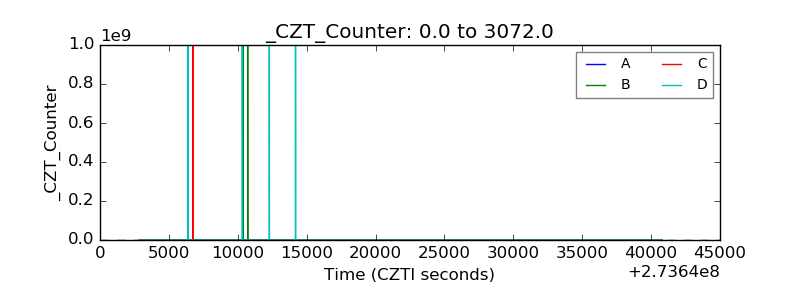 |
| +2.5 Volts monitor |  |
| +5 Volts monitor |  |
| _ROLL_ROT |  |
| _Roll_DEC | 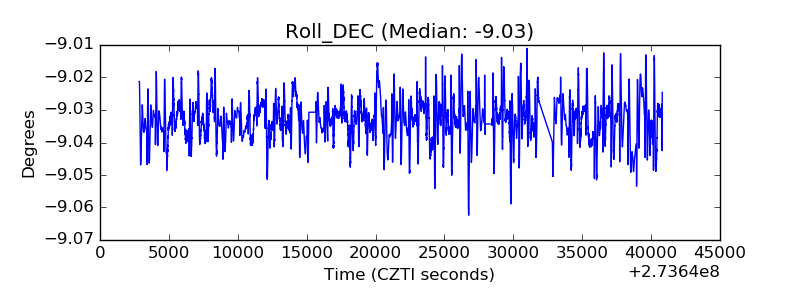 |
| _Roll_RA | 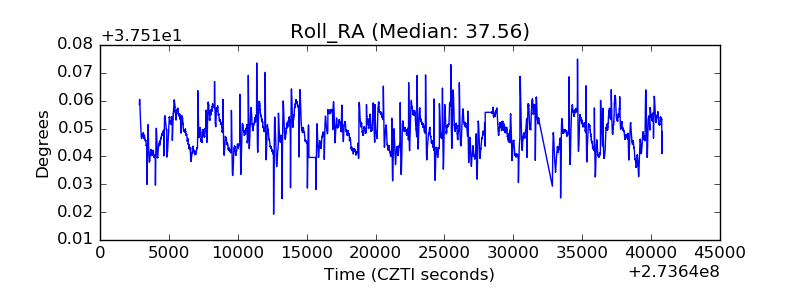 |
| Veto Counter |  |