| Param | Original file | Final file |
|---|---|---|
| Filename | modeM0/AS1A04_143T01_9000002344_15861cztM0_level2.evt | modeM0/AS1A04_143T01_9000002344_15861cztM0_level2_quad_clean.evt |
| Size (bytes) | 466,989,120 | 82,114,560 |
| Size | 445.4 MB | 78.3 MB |
| Events in quadrant A | 4,068,274 | 513,723 |
| Events in quadrant B | 3,346,944 | 529,142 |
| Events in quadrant C | 3,237,549 | 503,451 |
| Events in quadrant D | 3,058,684 | 497,176 |
| Mode SS | |||
|---|---|---|---|
| Quadrant | BADHDUFLAG | Total packets | Discarded packets |
| A | 0 | 130 | 0 |
| B | 0 | 130 | 0 |
| C | 0 | 130 | 0 |
| D | 0 | 130 | 0 |
| Mode M0 | |||
|---|---|---|---|
| Quadrant | BADHDUFLAG | Total packets | Discarded packets |
| A | 0 | 16350 | 3 |
| B | 0 | 14076 | 2 |
| C | 0 | 13697 | 2 |
| D | 0 | 13369 | 2 |
| Mode M9 | |||
|---|---|---|---|
| Quadrant | BADHDUFLAG | Total packets | Discarded packets |
| A | 0 | 21 | 0 |
| B | 0 | 21 | 0 |
| C | 0 | 21 | 0 |
| D | 0 | 22 | 0 |
| Quadrant | Total seconds | Saturated seconds | Saturation percentage |
|---|---|---|---|
| A | 6346 | 309 | 4.869209% |
| B | 6346 | 71 | 1.118815% |
| C | 6346 | 86 | 1.355184% |
| D | 6346 | 28 | 0.441223% |
Noise dominated data is calculated using 1-second bins in cleaned event files. If a bin has >2000 counts, and if more than 50% of those come from <1% of pixels, then it is considered to be noise-dominated and hence unusable.
| Quadrant | # 1 sec bins | Bins with >0 counts | Bins with >2000 counts | High rate bins dominated by noise | Noise dominated (total time) | Noise dominated (detector-on time) | Marked lightcurve |
|---|---|---|---|---|---|---|---|
| A | 7562 | 6348 | 141 | 141 | 1.86% | 2.22% | 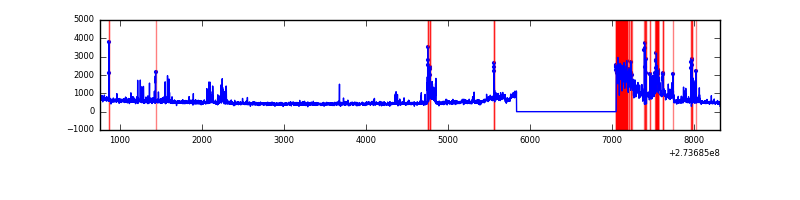 |
| B | 7562 | 6348 | 5 | 5 | 0.07% | 0.08% | 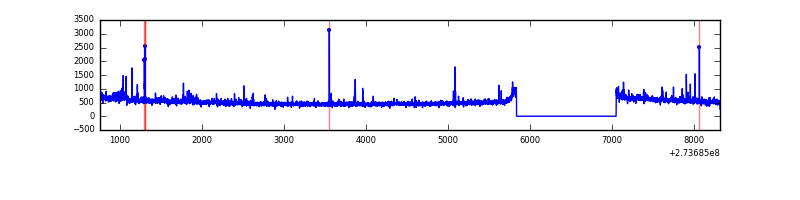 |
| C | 7562 | 6348 | 0 | 0 | 0.00% | 0.00% | 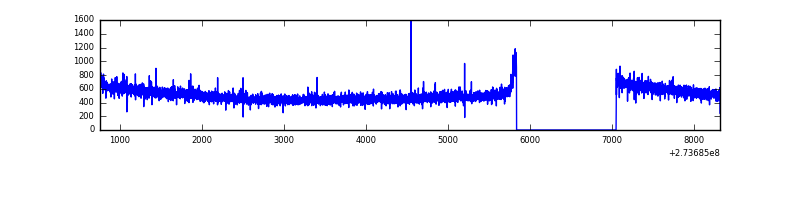 |
| D | 7562 | 6348 | 1 | 1 | 0.01% | 0.02% | 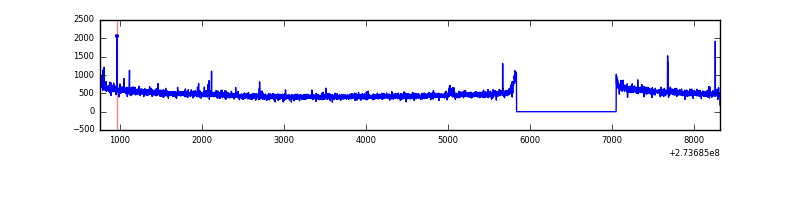 |
Top three noisy pixels from each quadrant. If the there are fewer than three noisy pixels in the level2.evt file, extra rows are filled as -1
| Pixel properties | Quadrant properties | ||||||
|---|---|---|---|---|---|---|---|
| Quadrant | DetID | PixID | Counts | Sigma | Mean | Median | Sigma |
| A | 15 | 239 | 969791 | 5988.89 | 802 | 786 | 161.8 |
| A | 13 | 248 | 9091 | 51.33 | 802 | 786 | 161.8 |
| A | 0 | 226 | 7174 | 39.48 | 802 | 786 | 161.8 |
| B | 4 | 216 | 40594 | 256.07 | 819 | 800 | 155.4 |
| B | 5 | 236 | 30725 | 192.56 | 819 | 800 | 155.4 |
| B | 10 | 245 | 26681 | 166.54 | 819 | 800 | 155.4 |
| C | 14 | 238 | 122005 | 660.37 | 786 | 791 | 183.6 |
| C | 3 | 233 | 37277 | 198.77 | 786 | 791 | 183.6 |
| C | 0 | 207 | 10214 | 51.34 | 786 | 791 | 183.6 |
| D | 2 | 234 | 25020 | 124.62 | 797 | 776 | 194.5 |
| D | 12 | 110 | 15045 | 73.35 | 797 | 776 | 194.5 |
| D | 10 | 70 | 13806 | 66.98 | 797 | 776 | 194.5 |
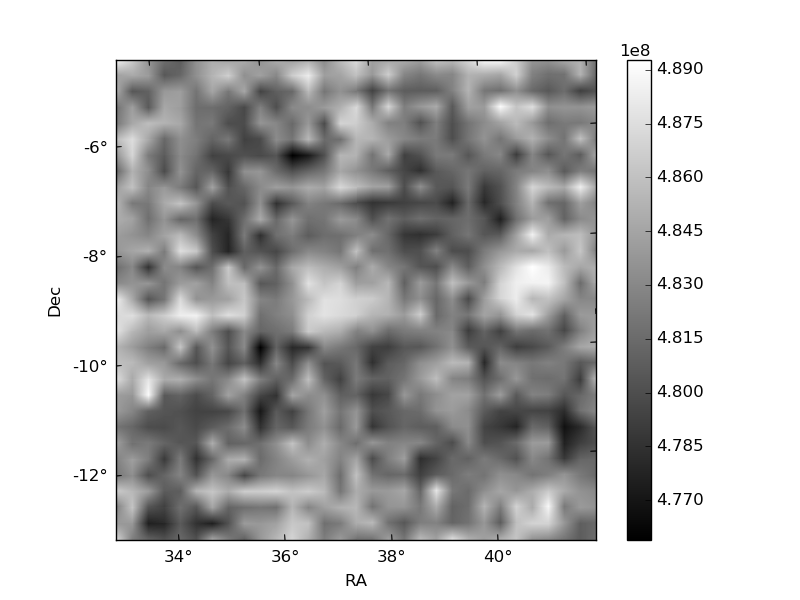
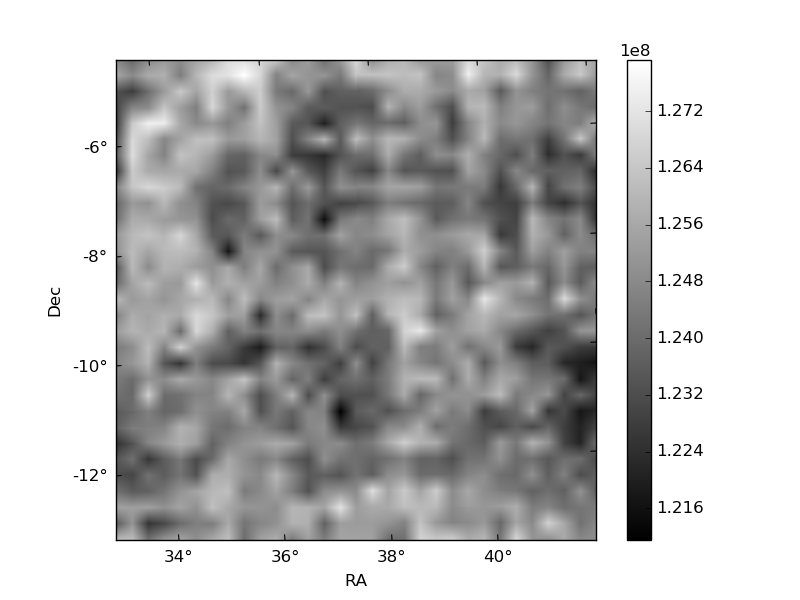
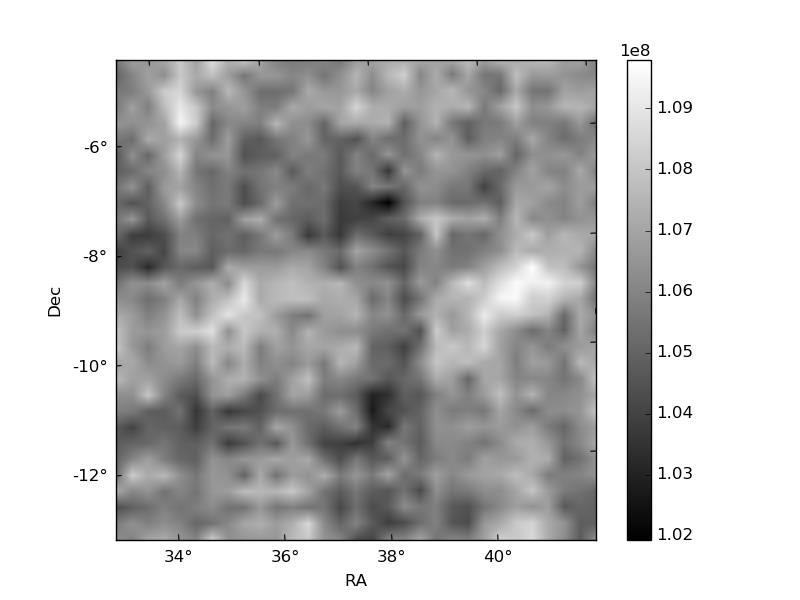
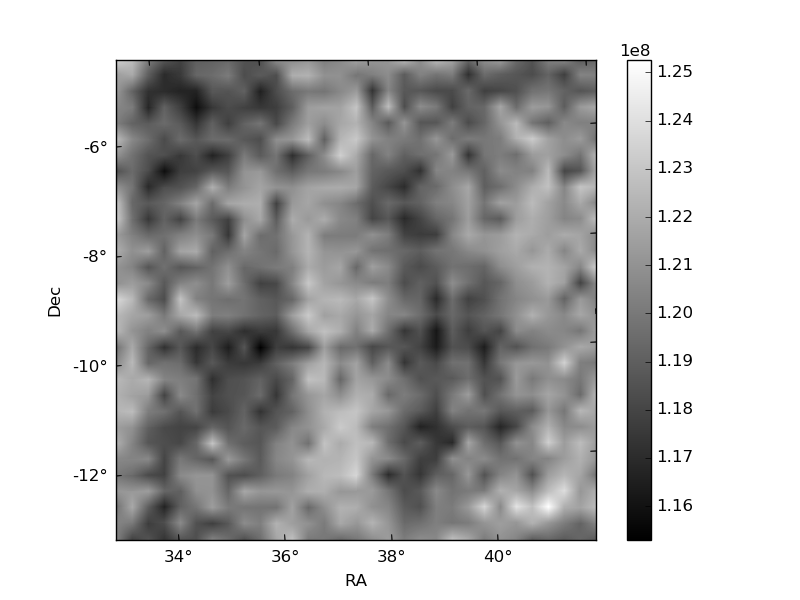
Histogram calculated using DETX and DETY for each event in the final _common_clean file
| Quadrant A | 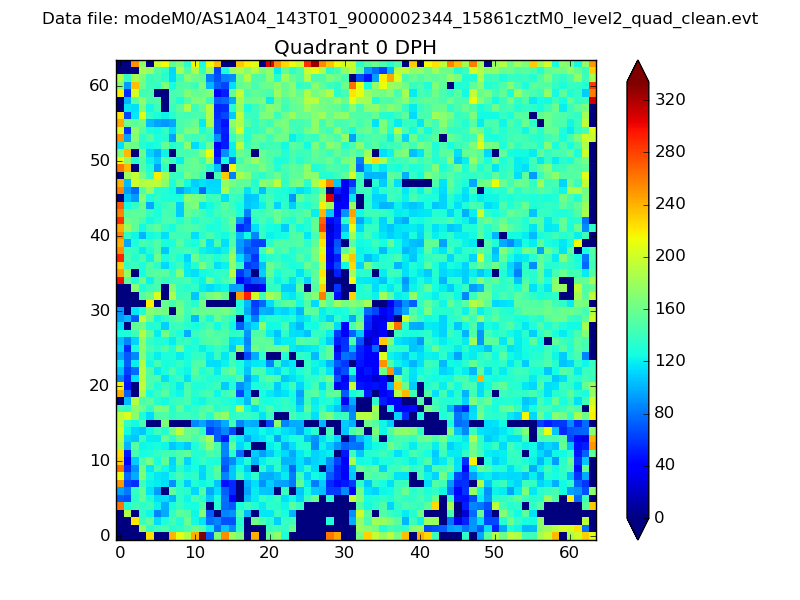 |
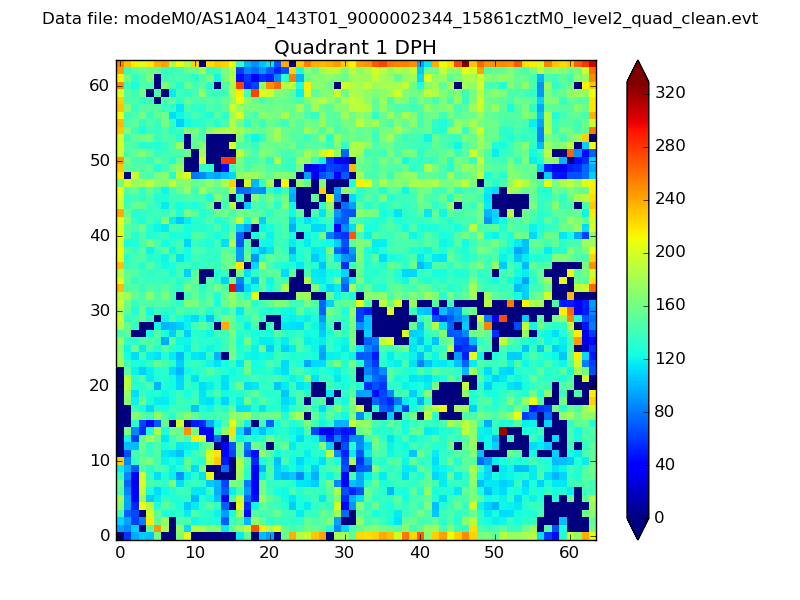 |
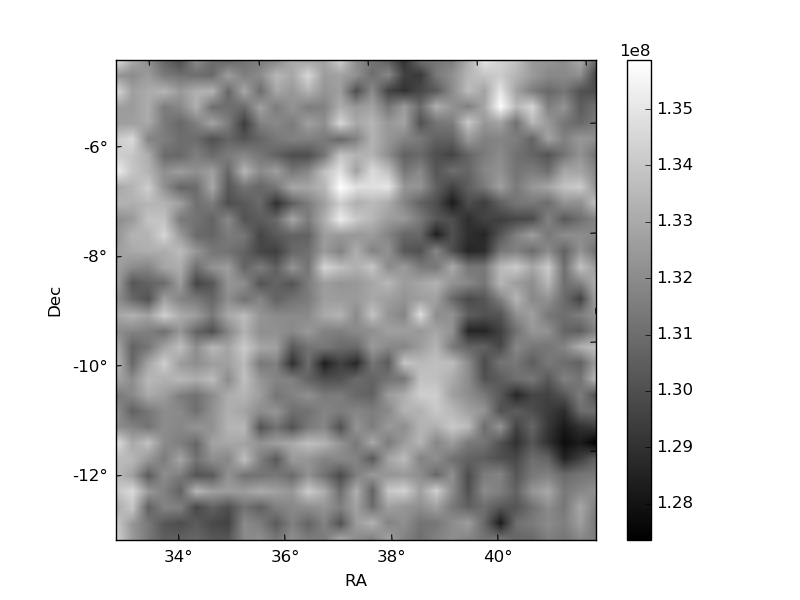
Quadrant B |
|---|---|---|---|
| Quadrant D | 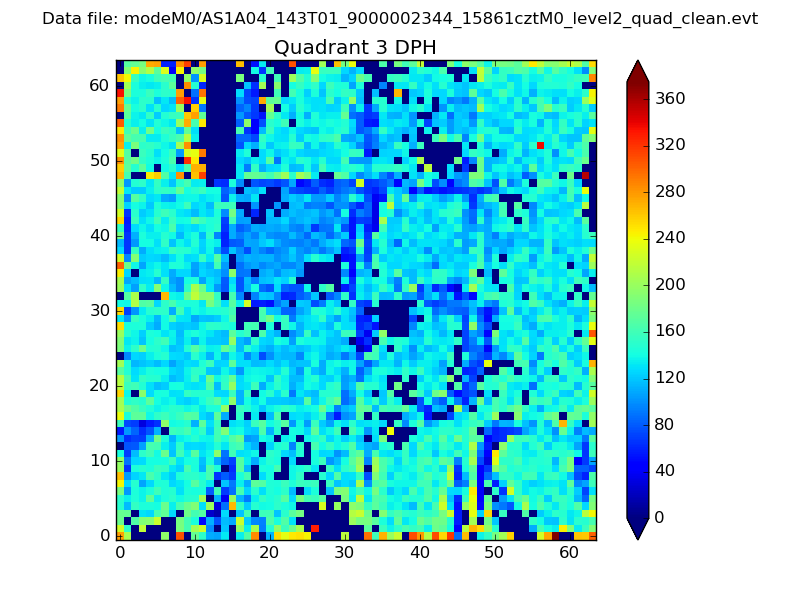 |
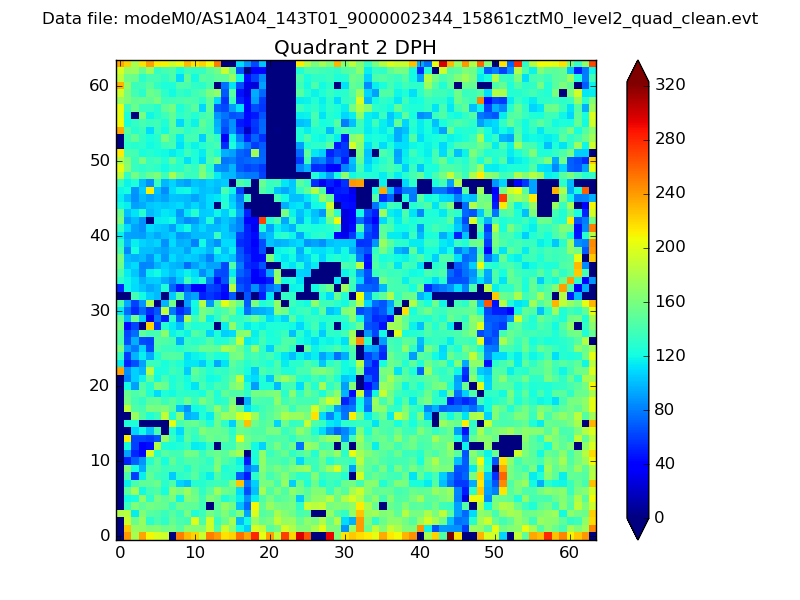 |
Quadrant C |
| Plot type | Count rate plots | Images |
|---|---|---|
| Comparison with Poisson distribution Blue bars denote a histogram of data divided into 1 sec bins. Red curve is a Poisson curve with rate = median count rate of data. |
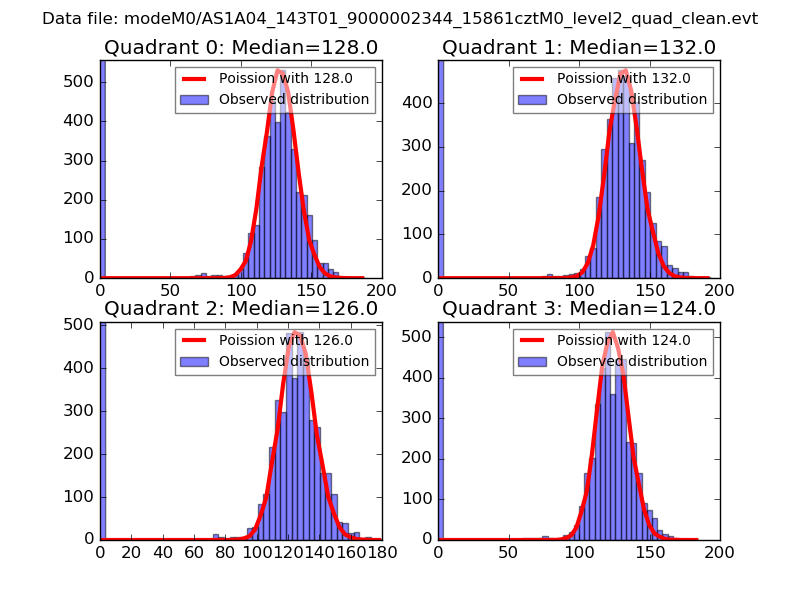 |
 |
| Quadrant-wise count rates Data is divided into 100 sec bins |
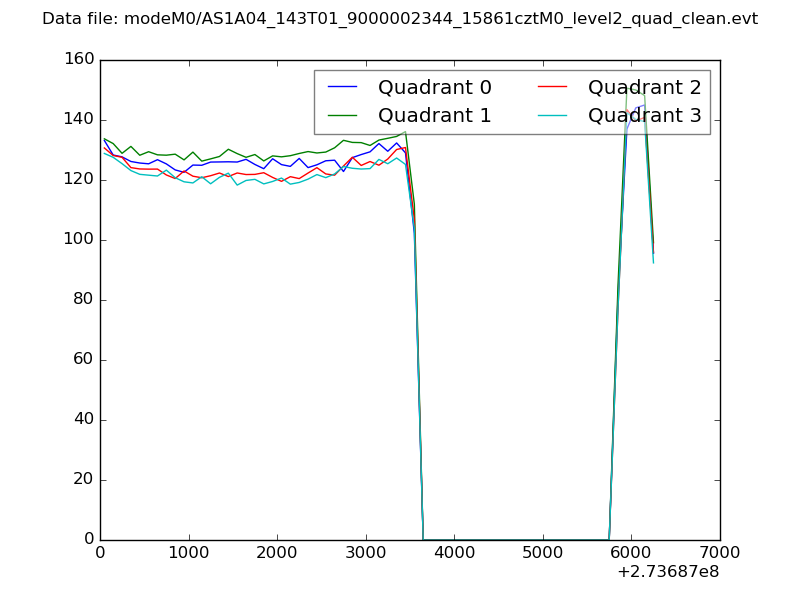 |
|
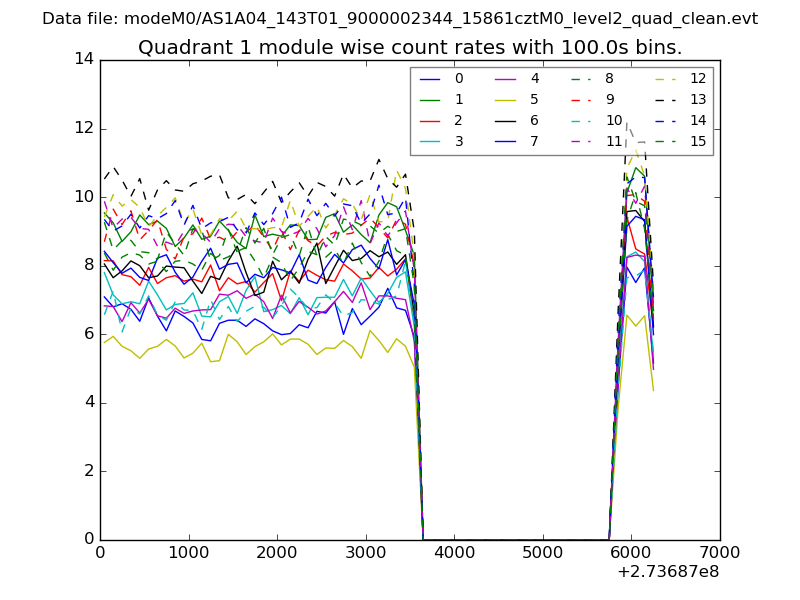
| Module-wise count rates for Quadrant A Data is divided into 100 sec bins |
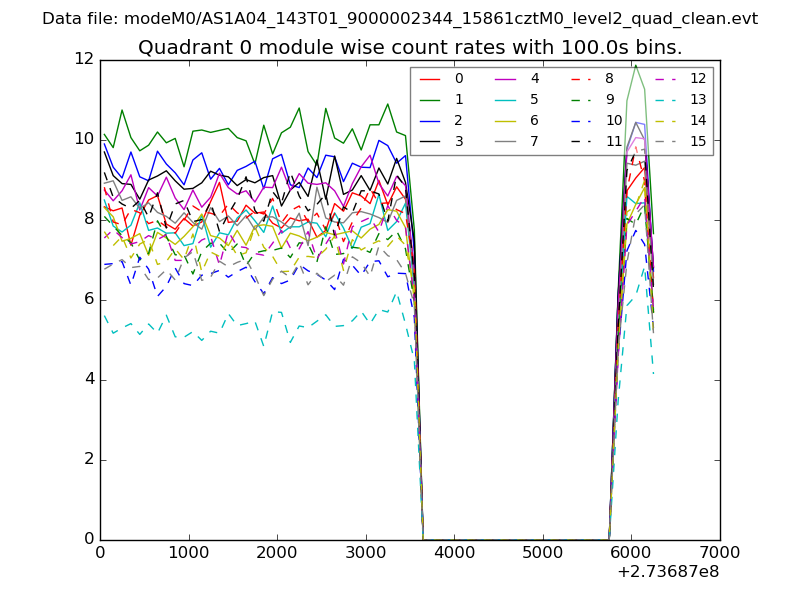 |
 |
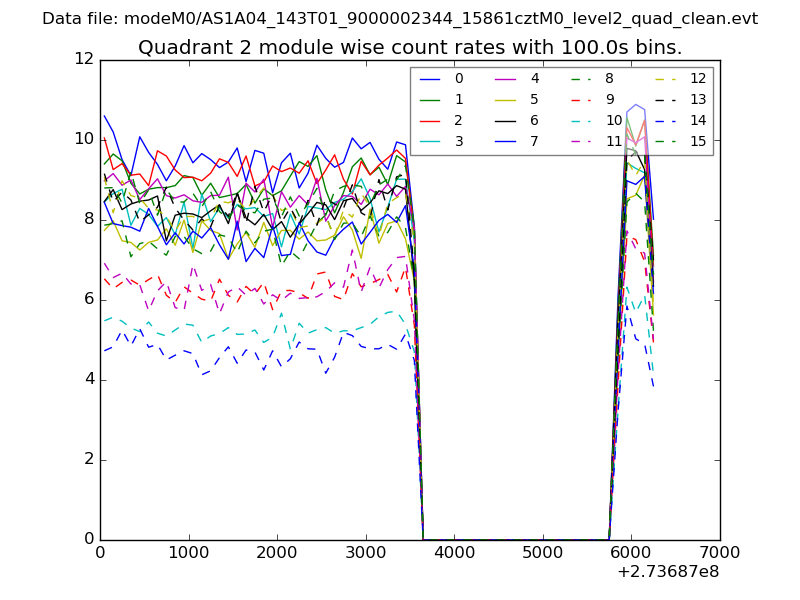
| Module-wise count rates for Quadrant B Data is divided into 100 sec bins |
 |
 |
| Module-wise count rates for Quadrant C Data is divided into 100 sec bins |
 |
 |
| Module-wise count rates for Quadrant D Data is divided into 100 sec bins |
 |
 |
| Parameter | Plot |
|---|---|
| CZT HV Monitor | 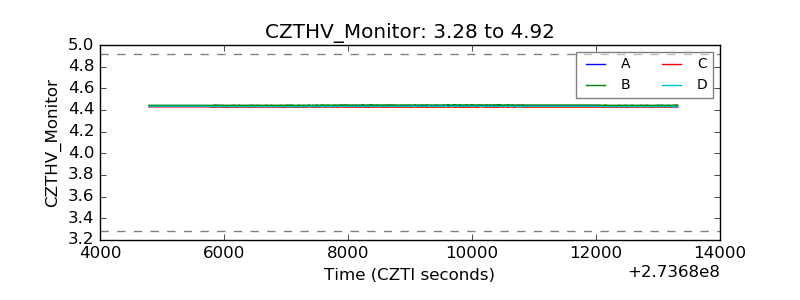 |
| D_VDD | 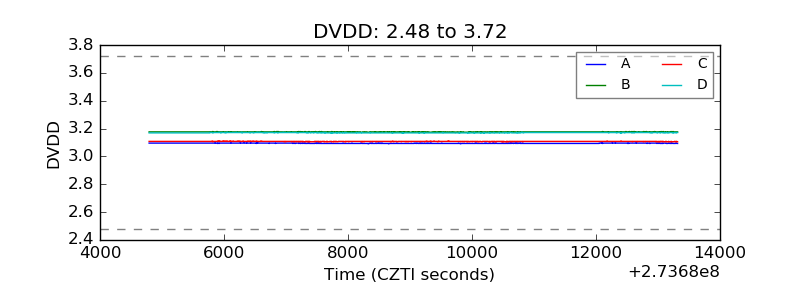 |
| Temperature 1 | 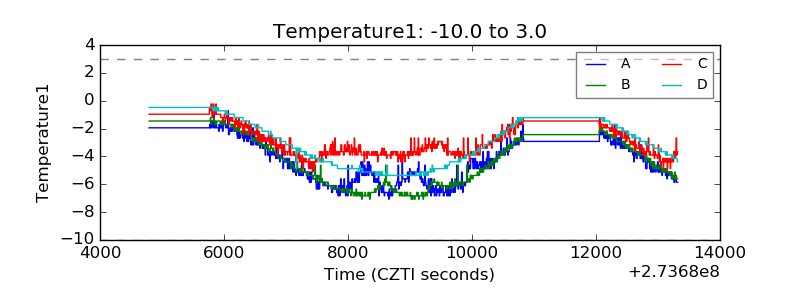 |
| Veto HV Monitor | 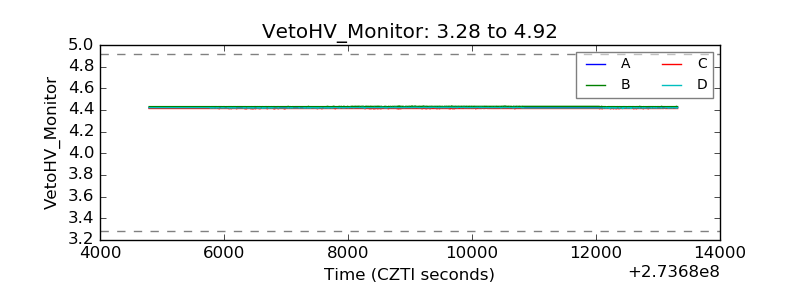 |
| Veto LLD |  |
| Alpha Counter | 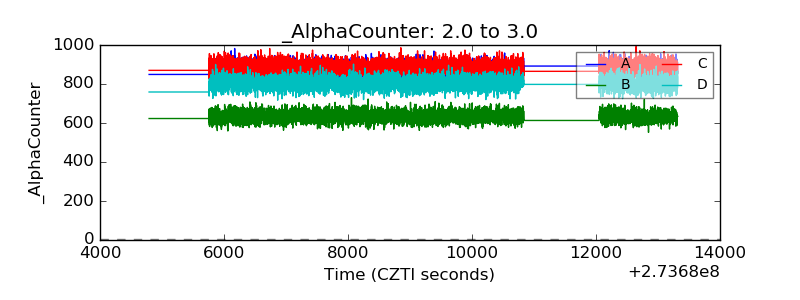 |
| _CPM_Rate | 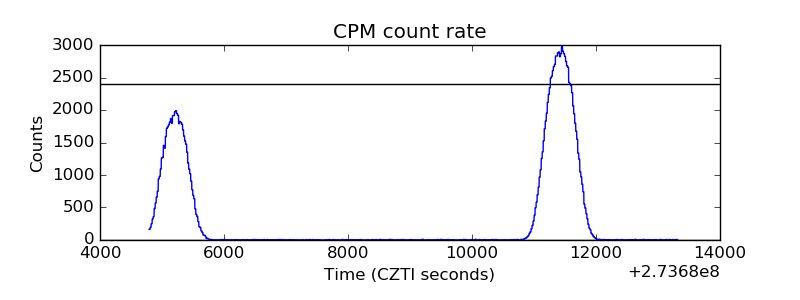 |
| CZT Counter | 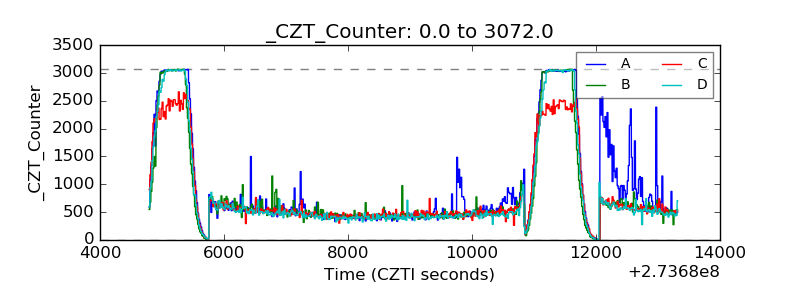 |
| +2.5 Volts monitor |  |
| +5 Volts monitor |  |
| _ROLL_ROT |  |
| _Roll_DEC | 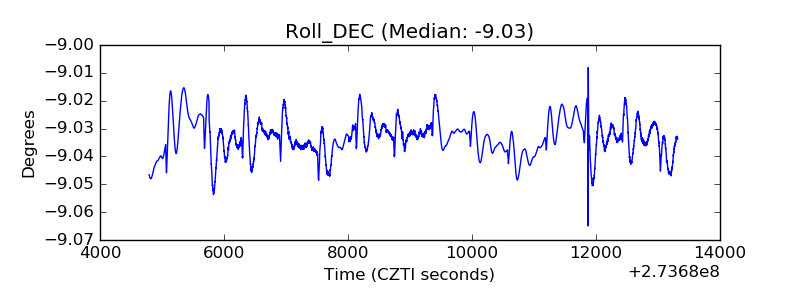 |
| _Roll_RA | 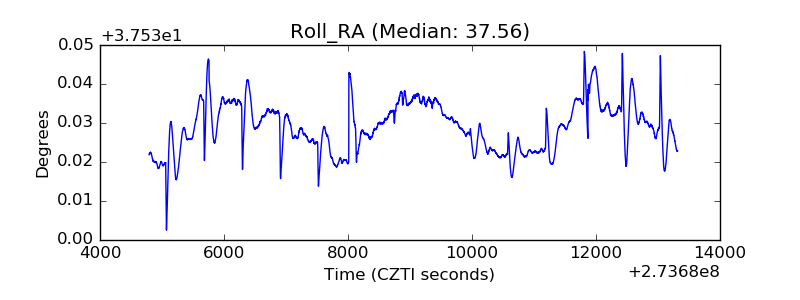 |
| Veto Counter |  |