| Param | Original file | Final file |
|---|---|---|
| Filename | modeM0/AS1A04_143T01_9000002344_15862cztM0_level2.evt | modeM0/AS1A04_143T01_9000002344_15862cztM0_level2_quad_clean.evt |
| Size (bytes) | 523,644,480 | 93,948,480 |
| Size | 499.4 MB | 89.6 MB |
| Events in quadrant A | 5,093,290 | 597,148 |
| Events in quadrant B | 3,674,439 | 623,314 |
| Events in quadrant C | 3,436,551 | 592,259 |
| Events in quadrant D | 3,215,954 | 581,518 |
| Mode SS | |||
|---|---|---|---|
| Quadrant | BADHDUFLAG | Total packets | Discarded packets |
| A | 0 | 136 | 0 |
| B | 0 | 136 | 0 |
| C | 0 | 136 | 0 |
| D | 0 | 136 | 0 |
| Mode M0 | |||
|---|---|---|---|
| Quadrant | BADHDUFLAG | Total packets | Discarded packets |
| A | 0 | 19576 | 3 |
| B | 0 | 15147 | 2 |
| C | 0 | 14318 | 2 |
| D | 0 | 13796 | 2 |
| Mode M9 | |||
|---|---|---|---|
| Quadrant | BADHDUFLAG | Total packets | Discarded packets |
| A | 0 | 24 | 0 |
| B | 0 | 24 | 0 |
| C | 0 | 24 | 0 |
| D | 0 | 24 | 0 |
| Quadrant | Total seconds | Saturated seconds | Saturation percentage |
|---|---|---|---|
| A | 6453 | 429 | 6.648071% |
| B | 6453 | 154 | 2.386487% |
| C | 6453 | 117 | 1.813110% |
| D | 6453 | 58 | 0.898807% |
Noise dominated data is calculated using 1-second bins in cleaned event files. If a bin has >2000 counts, and if more than 50% of those come from <1% of pixels, then it is considered to be noise-dominated and hence unusable.
| Quadrant | # 1 sec bins | Bins with >0 counts | Bins with >2000 counts | High rate bins dominated by noise | Noise dominated (total time) | Noise dominated (detector-on time) | Marked lightcurve |
|---|---|---|---|---|---|---|---|
| A | 8959 | 6456 | 209 | 209 | 2.33% | 3.24% | 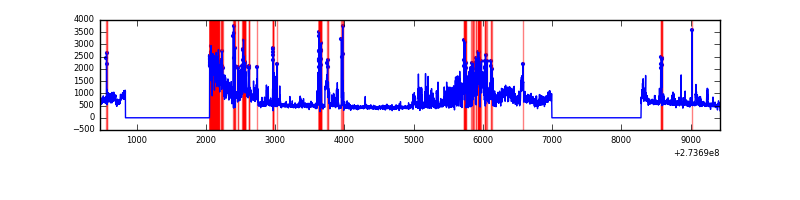 |
| B | 8959 | 6456 | 38 | 38 | 0.42% | 0.59% | 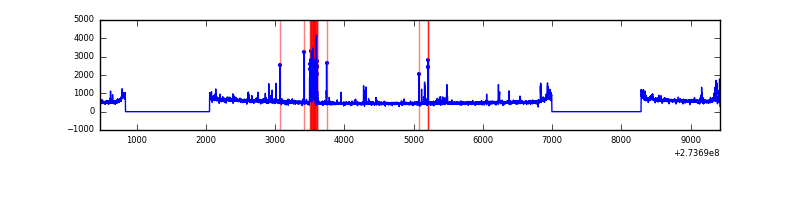 |
| C | 8959 | 6456 | 0 | 0 | 0.00% | 0.00% | 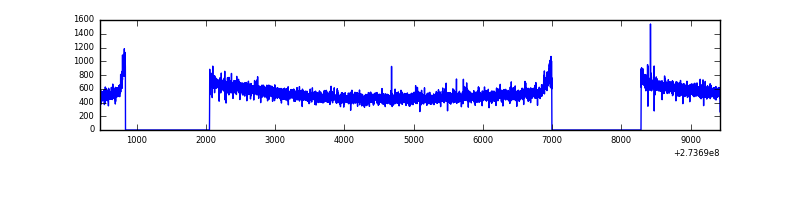 |
| D | 8959 | 6456 | 4 | 4 | 0.04% | 0.06% | 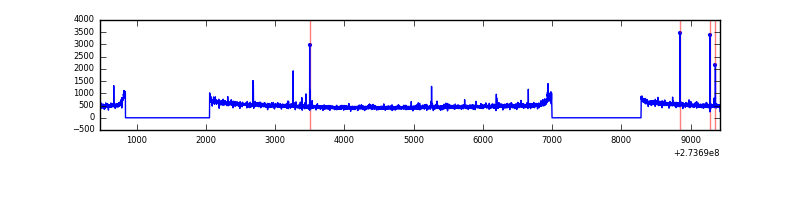 |
Top three noisy pixels from each quadrant. If the there are fewer than three noisy pixels in the level2.evt file, extra rows are filled as -1
| Pixel properties | Quadrant properties | ||||||
|---|---|---|---|---|---|---|---|
| Quadrant | DetID | PixID | Counts | Sigma | Mean | Median | Sigma |
| A | 15 | 239 | 1874501 | 11159.94 | 837 | 822 | 167.9 |
| A | 0 | 226 | 7513 | 39.85 | 837 | 822 | 167.9 |
| A | 12 | 194 | 6131 | 31.62 | 837 | 822 | 167.9 |
| B | 4 | 173 | 150145 | 915.26 | 860 | 841 | 163.1 |
| B | 10 | 245 | 77344 | 468.98 | 860 | 841 | 163.1 |
| B | 4 | 216 | 25033 | 148.3 | 860 | 841 | 163.1 |
| C | 14 | 238 | 127956 | 661.83 | 825 | 832 | 192.1 |
| C | 3 | 233 | 67832 | 348.82 | 825 | 832 | 192.1 |
| C | 0 | 207 | 22573 | 113.19 | 825 | 832 | 192.1 |
| D | 2 | 234 | 24757 | 117.83 | 835 | 812 | 203.2 |
| D | 12 | 110 | 17956 | 84.36 | 835 | 812 | 203.2 |
| D | 7 | 223 | 13104 | 60.49 | 835 | 812 | 203.2 |
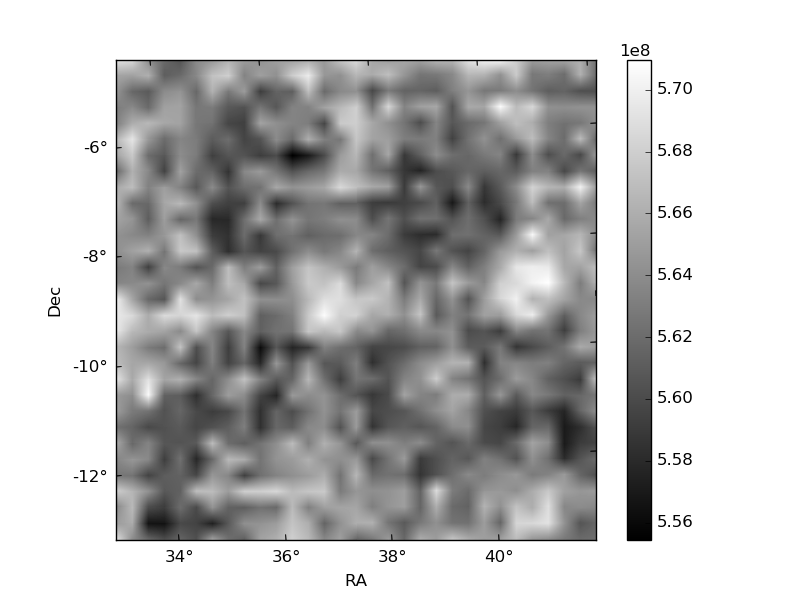
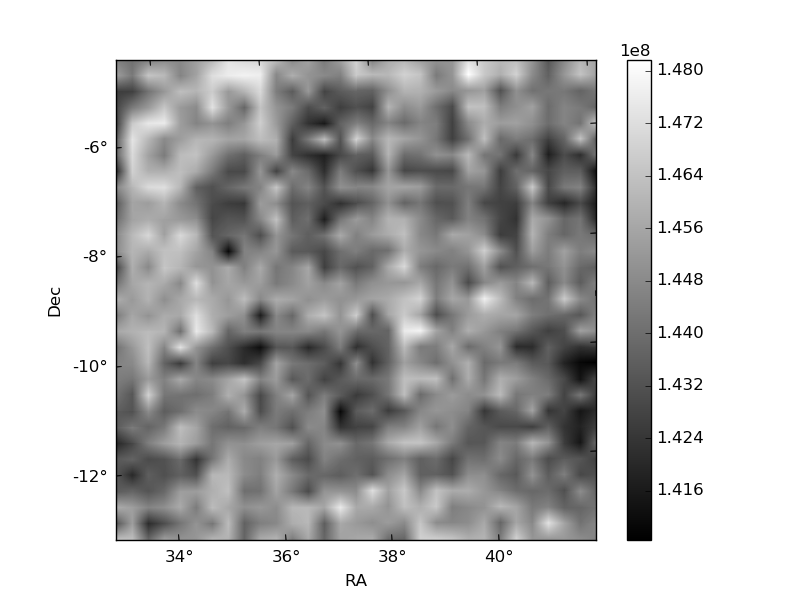
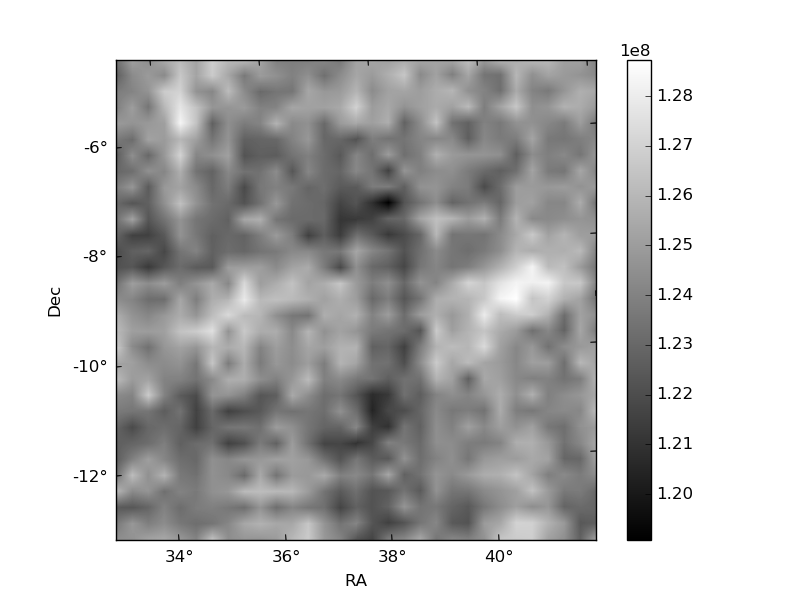
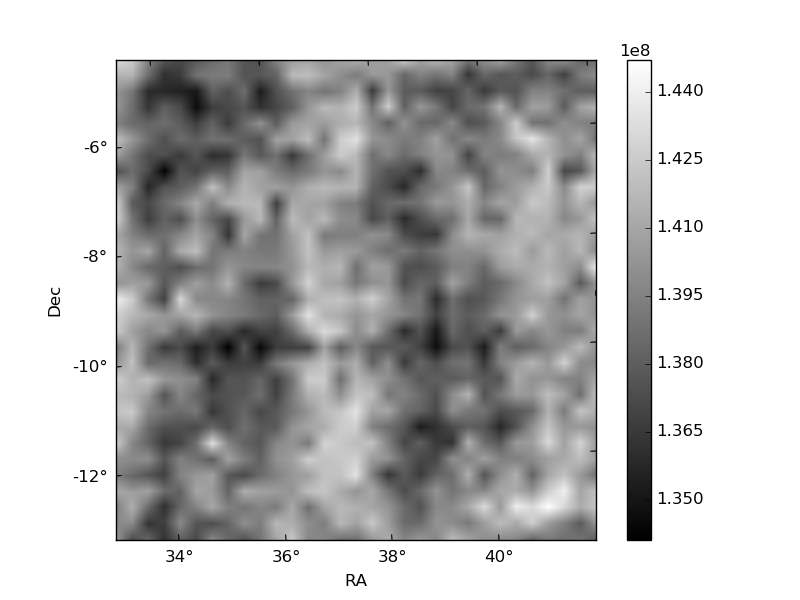
Histogram calculated using DETX and DETY for each event in the final _common_clean file
| Quadrant A | 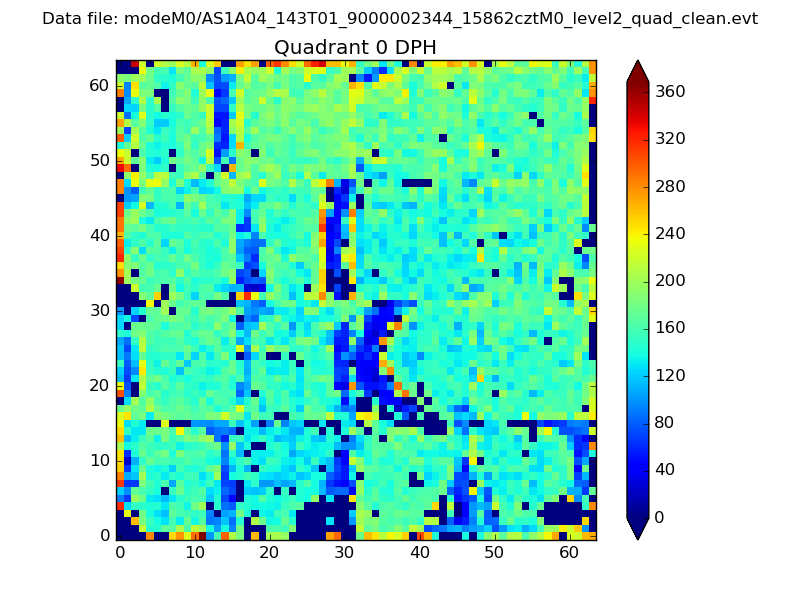 |
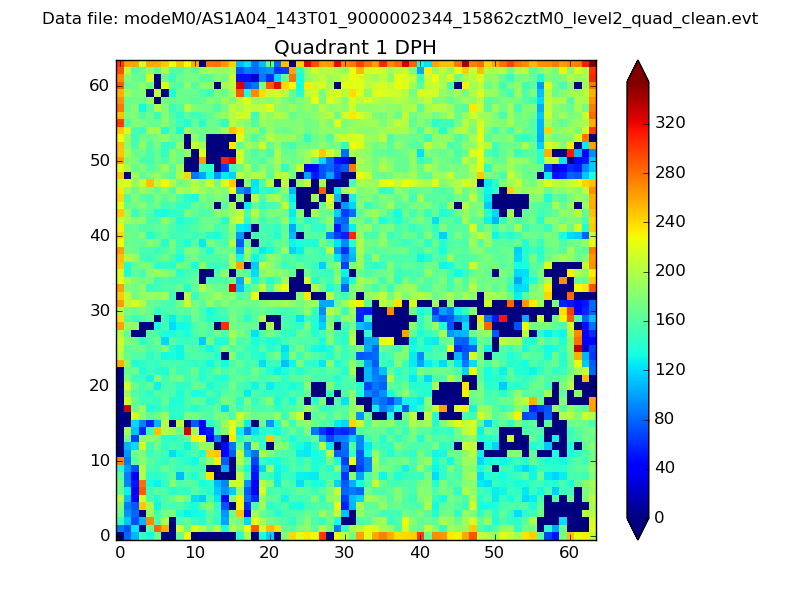 |
Quadrant B |
|---|---|---|---|
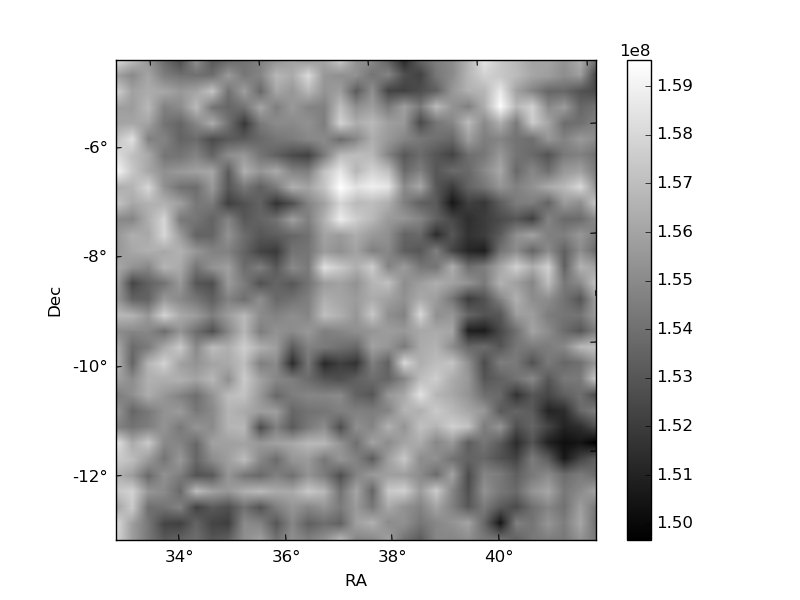
| Quadrant D | 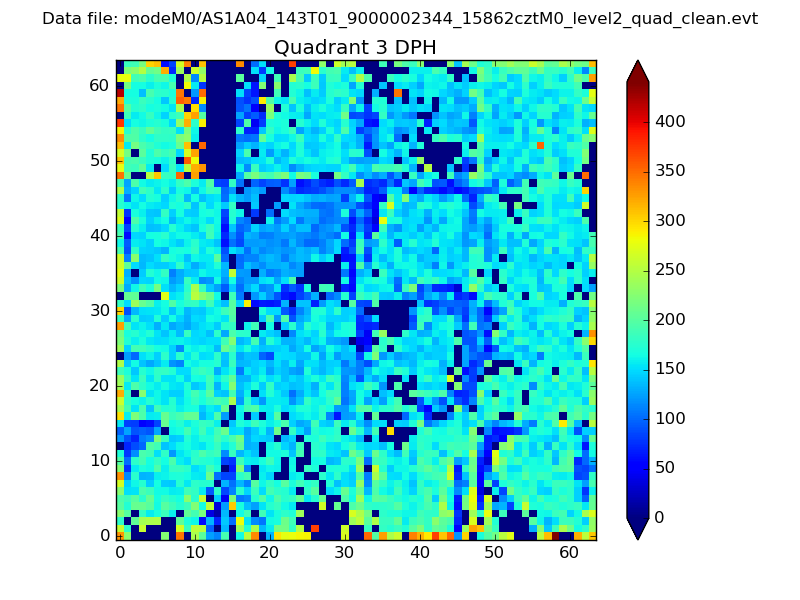 |
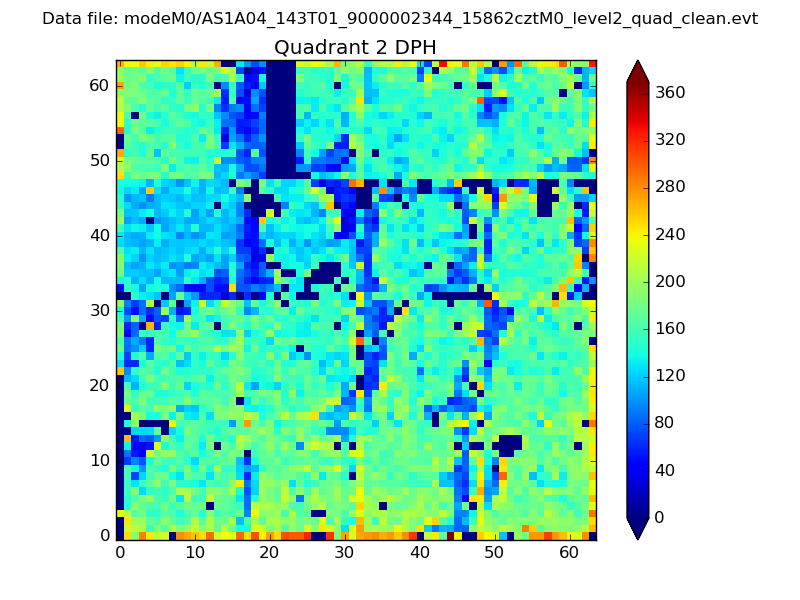 |
Quadrant C |
| Plot type | Count rate plots | Images |
|---|---|---|
| Comparison with Poisson distribution Blue bars denote a histogram of data divided into 1 sec bins. Red curve is a Poisson curve with rate = median count rate of data. |
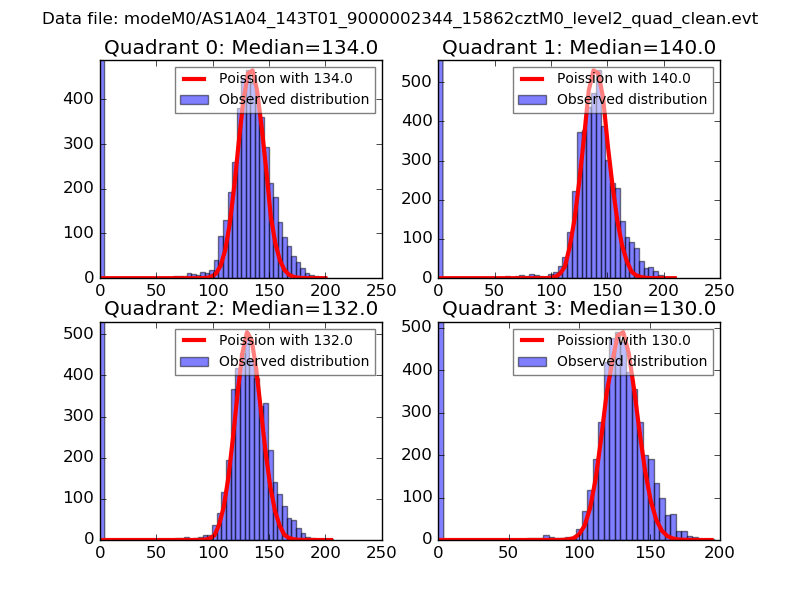 |
 |
| Quadrant-wise count rates Data is divided into 100 sec bins |
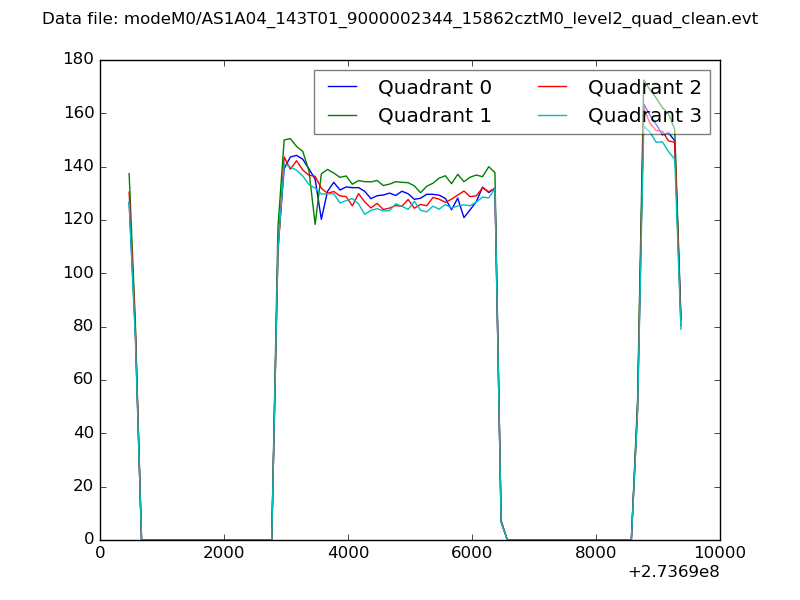 |
|
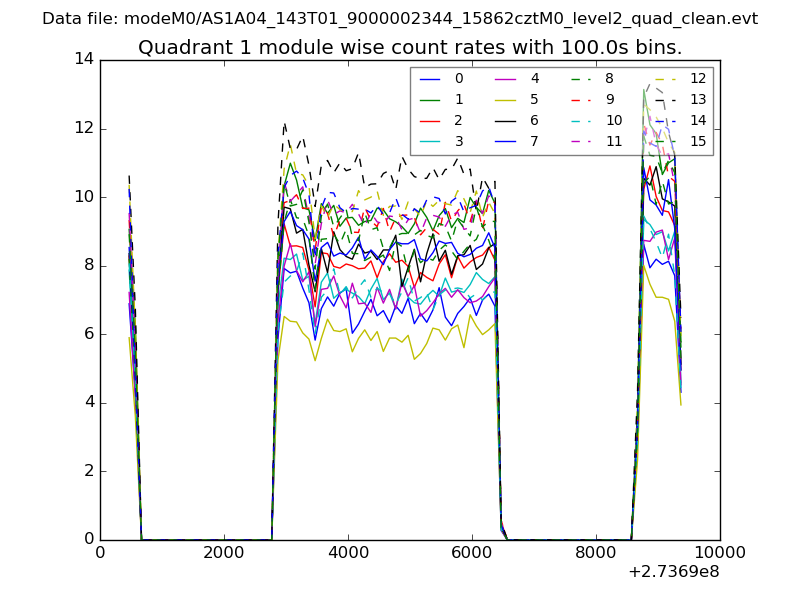
| Module-wise count rates for Quadrant A Data is divided into 100 sec bins |
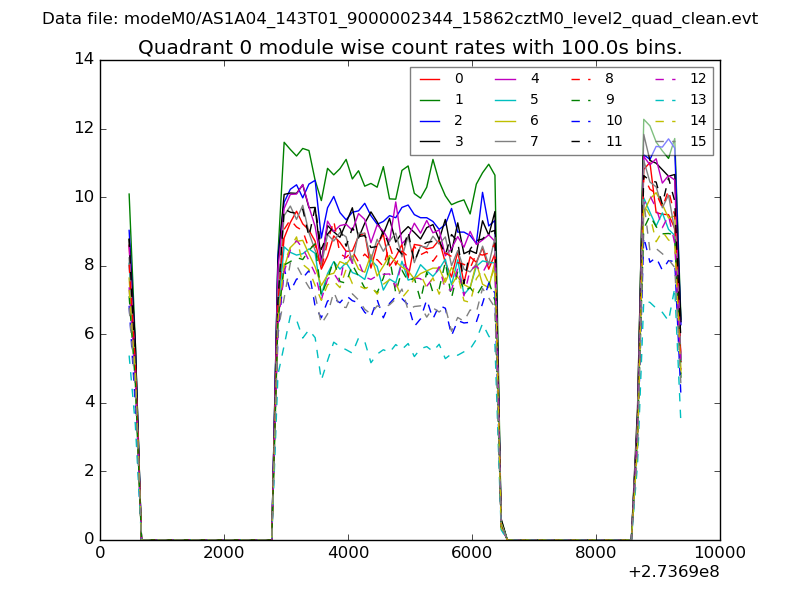 |
 |
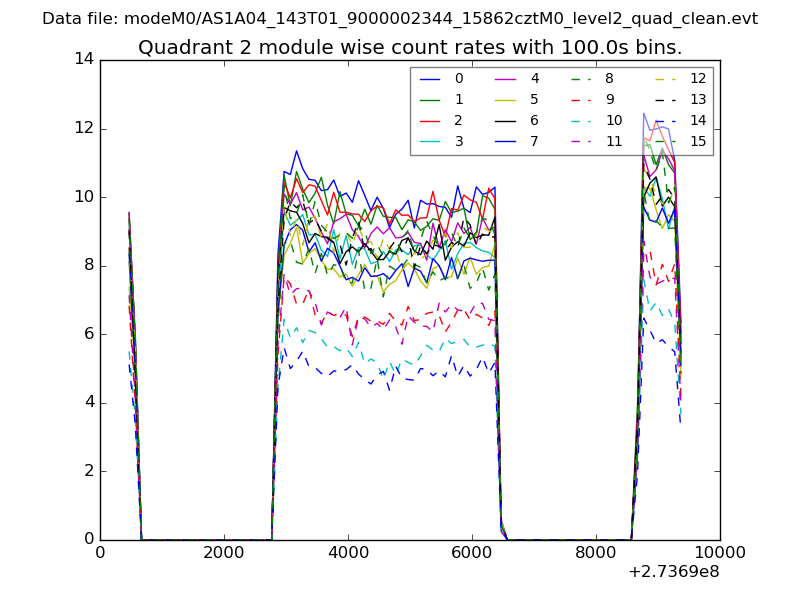
| Module-wise count rates for Quadrant B Data is divided into 100 sec bins |
 |
 |
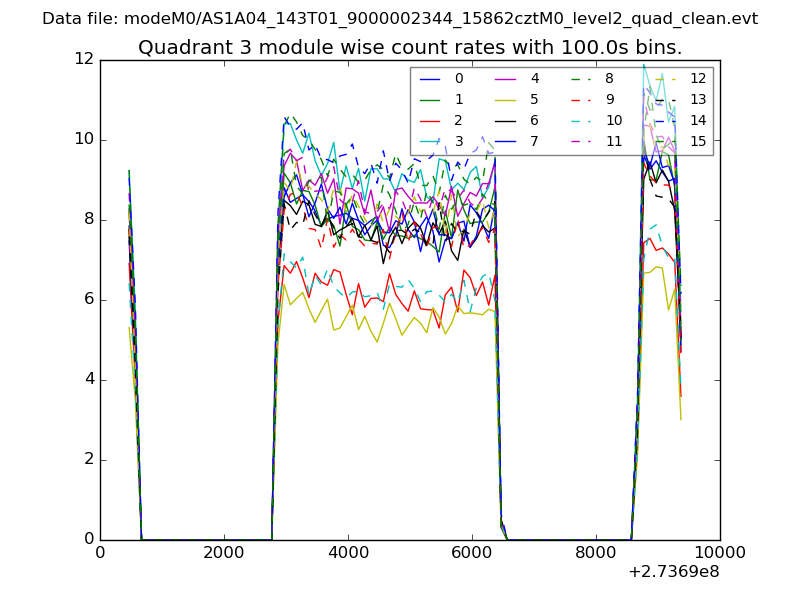
| Module-wise count rates for Quadrant C Data is divided into 100 sec bins |
 |
 |
| Module-wise count rates for Quadrant D Data is divided into 100 sec bins |
 |
 |
| Parameter | Plot |
|---|---|
| CZT HV Monitor | 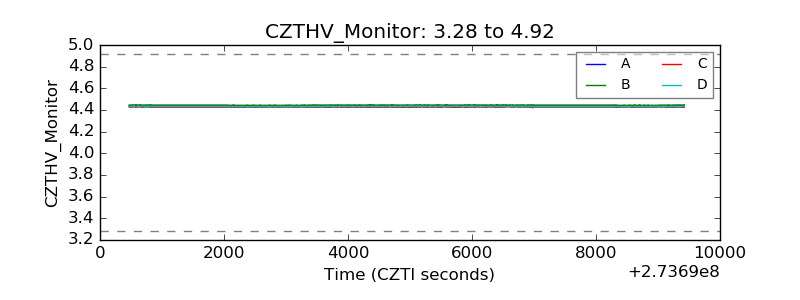 |
| D_VDD | 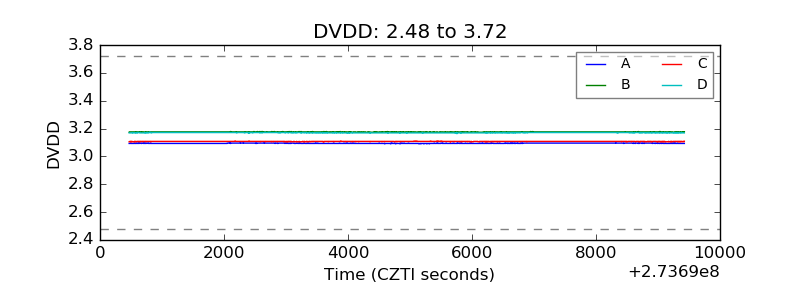 |
| Temperature 1 | 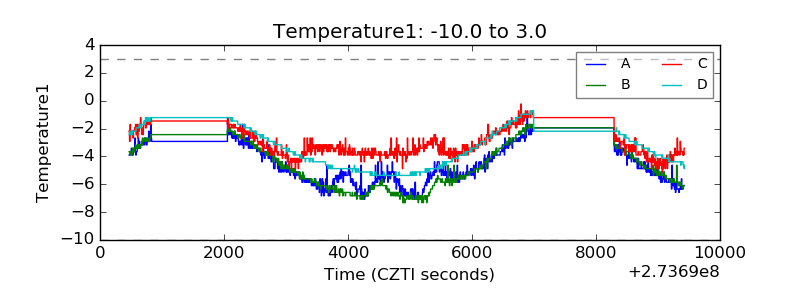 |
| Veto HV Monitor | 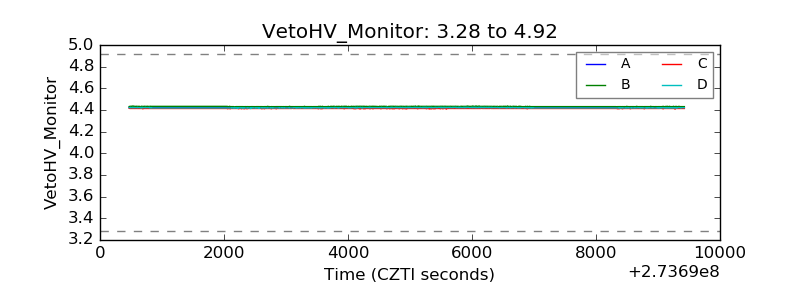 |
| Veto LLD | 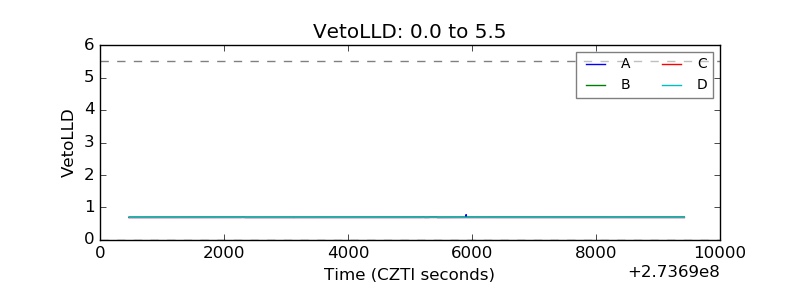 |
| Alpha Counter | 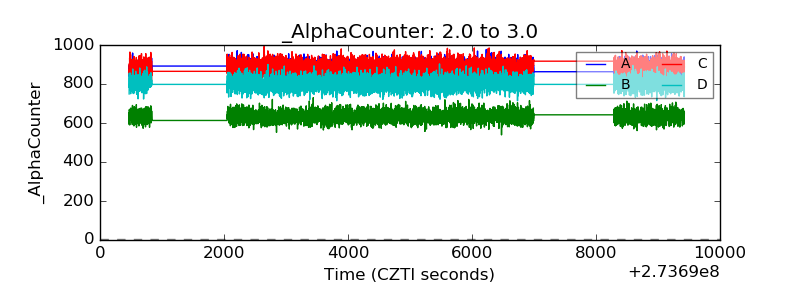 |
| _CPM_Rate | 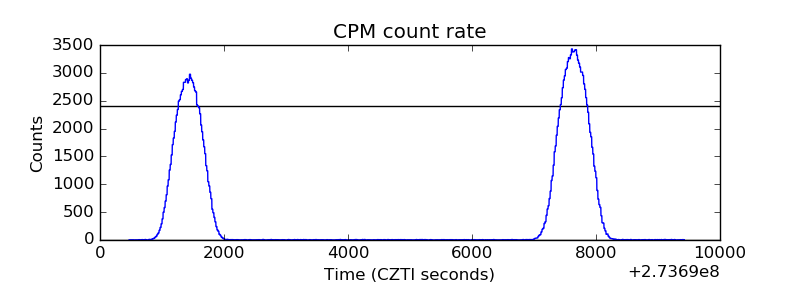 |
| CZT Counter | 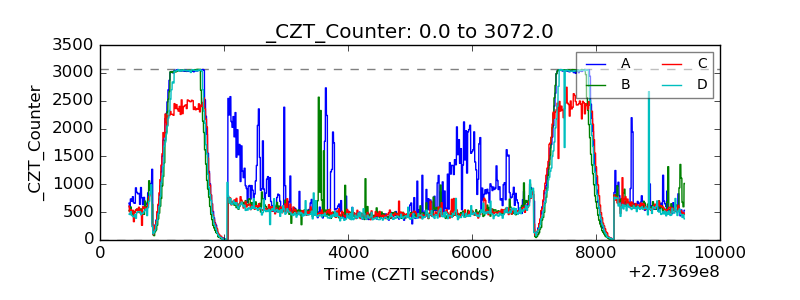 |
| +2.5 Volts monitor | 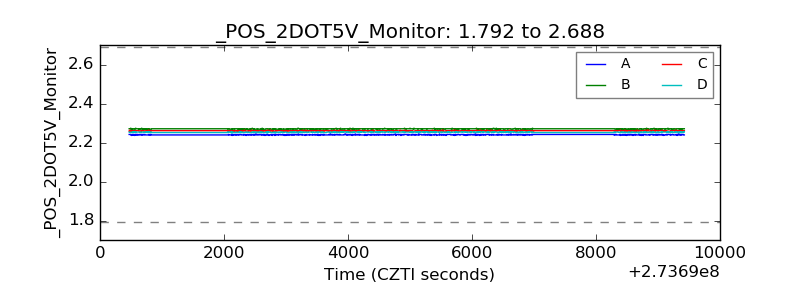 |
| +5 Volts monitor |  |
| _ROLL_ROT | 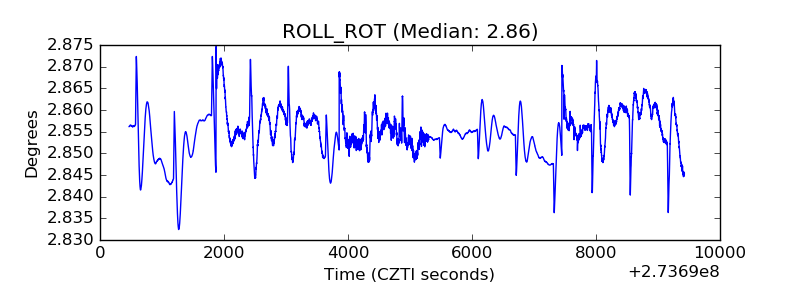 |
| _Roll_DEC | 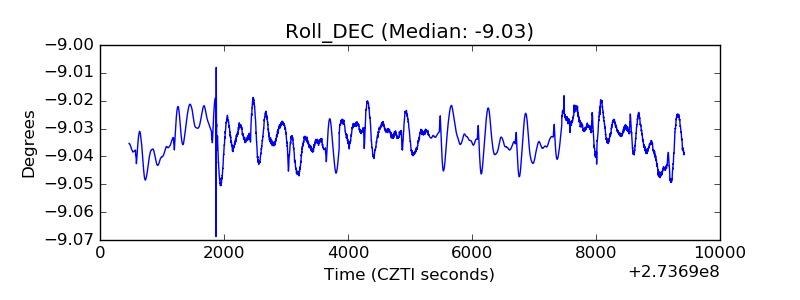 |
| _Roll_RA | 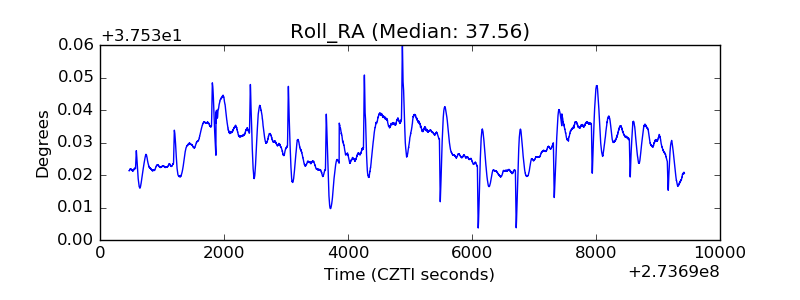 |
| Veto Counter | 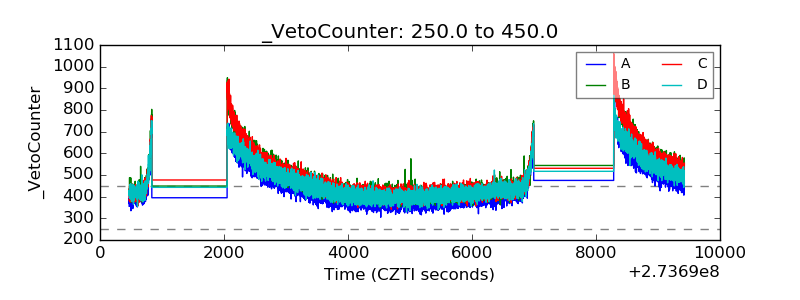 |