| Param | Original file | Final file |
|---|---|---|
| Filename | modeM0/AS1A04_143T01_9000002344_15863cztM0_level2.evt | modeM0/AS1A04_143T01_9000002344_15863cztM0_level2_quad_clean.evt |
| Size (bytes) | 440,078,400 | 103,242,240 |
| Size | 419.7 MB | 98.5 MB |
| Events in quadrant A | 3,348,051 | 679,722 |
| Events in quadrant B | 3,314,172 | 707,572 |
| Events in quadrant C | 3,233,016 | 668,337 |
| Events in quadrant D | 3,020,718 | 647,821 |
| Mode SS | |||
|---|---|---|---|
| Quadrant | BADHDUFLAG | Total packets | Discarded packets |
| A | 0 | 124 | 0 |
| B | 0 | 124 | 0 |
| C | 0 | 124 | 0 |
| D | 0 | 124 | 0 |
| Mode M0 | |||
|---|---|---|---|
| Quadrant | BADHDUFLAG | Total packets | Discarded packets |
| A | 0 | 13969 | 3 |
| B | 0 | 13760 | 2 |
| C | 0 | 13353 | 2 |
| D | 0 | 12905 | 2 |
| Mode M9 | |||
|---|---|---|---|
| Quadrant | BADHDUFLAG | Total packets | Discarded packets |
| A | 0 | 17 | 0 |
| B | 0 | 17 | 0 |
| C | 0 | 17 | 0 |
| D | 0 | 18 | 0 |
| Quadrant | Total seconds | Saturated seconds | Saturation percentage |
|---|---|---|---|
| A | 6060 | 50 | 0.825083% |
| B | 6060 | 41 | 0.676568% |
| C | 6060 | 64 | 1.056106% |
| D | 6060 | 17 | 0.280528% |
Noise dominated data is calculated using 1-second bins in cleaned event files. If a bin has >2000 counts, and if more than 50% of those come from <1% of pixels, then it is considered to be noise-dominated and hence unusable.
| Quadrant | # 1 sec bins | Bins with >0 counts | Bins with >2000 counts | High rate bins dominated by noise | Noise dominated (total time) | Noise dominated (detector-on time) | Marked lightcurve |
|---|---|---|---|---|---|---|---|
| A | 7431 | 6062 | 13 | 13 | 0.17% | 0.21% | 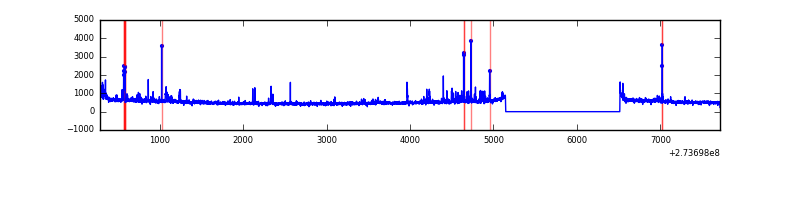 |
| B | 7431 | 6062 | 1 | 1 | 0.01% | 0.02% | 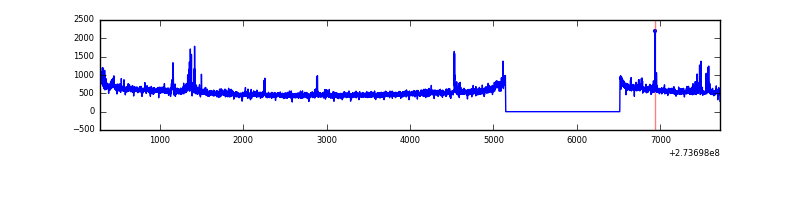 |
| C | 7431 | 6062 | 0 | 0 | 0.00% | 0.00% | 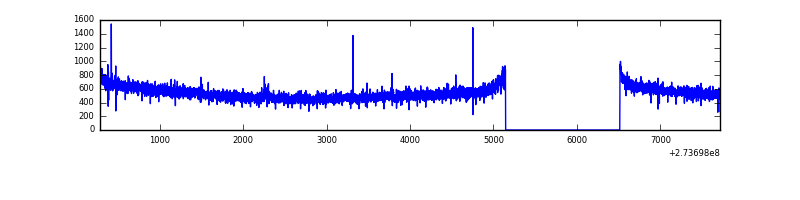 |
| D | 7431 | 6062 | 7 | 7 | 0.09% | 0.12% | 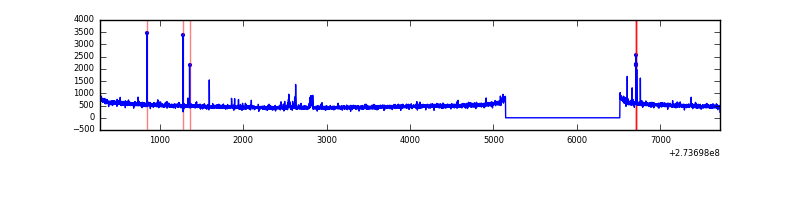 |
Top three noisy pixels from each quadrant. If the there are fewer than three noisy pixels in the level2.evt file, extra rows are filled as -1
| Pixel properties | Quadrant properties | ||||||
|---|---|---|---|---|---|---|---|
| Quadrant | DetID | PixID | Counts | Sigma | Mean | Median | Sigma |
| A | 15 | 239 | 275499 | 1720.16 | 797 | 783 | 159.7 |
| A | 9 | 143 | 13175 | 77.59 | 797 | 783 | 159.7 |
| A | 0 | 226 | 7165 | 39.96 | 797 | 783 | 159.7 |
| B | 10 | 245 | 40026 | 259.4 | 811 | 795 | 151.2 |
| B | 12 | 111 | 17101 | 107.82 | 811 | 795 | 151.2 |
| B | 4 | 173 | 16758 | 105.55 | 811 | 795 | 151.2 |
| C | 14 | 238 | 122742 | 678.1 | 778 | 788 | 179.8 |
| C | 3 | 233 | 48746 | 266.66 | 778 | 788 | 179.8 |
| C | 0 | 207 | 24316 | 130.82 | 778 | 788 | 179.8 |
| D | 1 | 52 | 29262 | 150.32 | 780 | 759 | 189.6 |
| D | 2 | 234 | 21921 | 111.61 | 780 | 759 | 189.6 |
| D | 10 | 70 | 21881 | 111.4 | 780 | 759 | 189.6 |
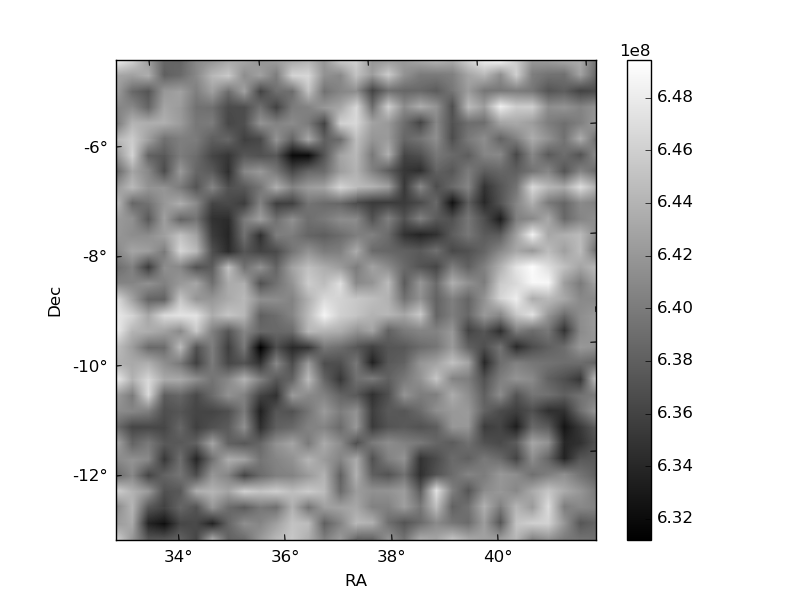
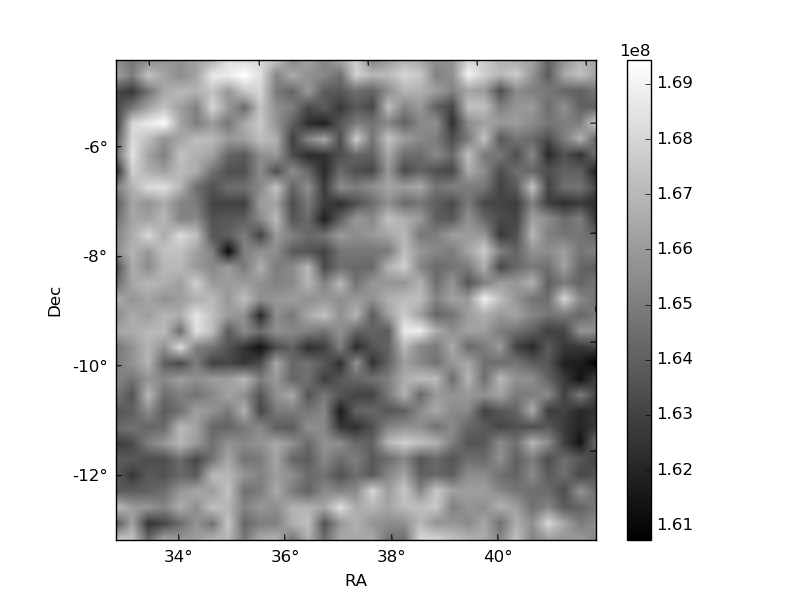
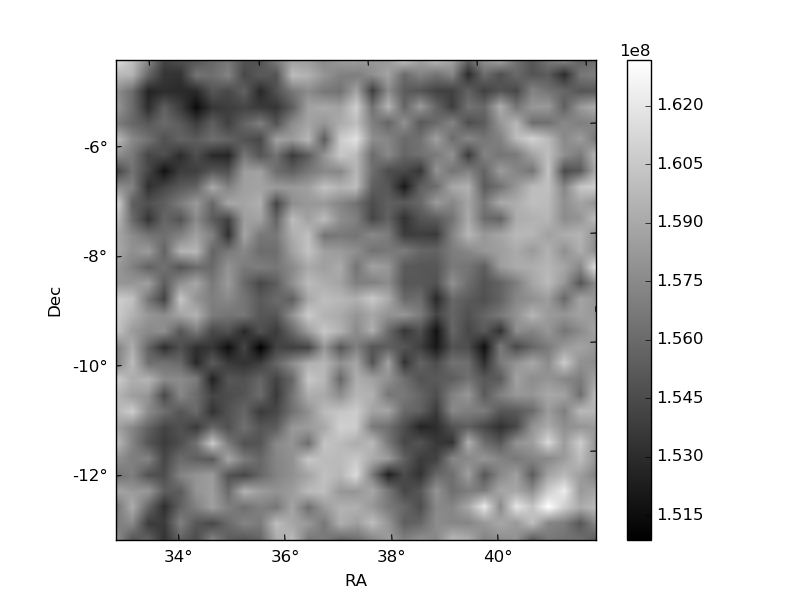
Histogram calculated using DETX and DETY for each event in the final _common_clean file
| Quadrant A | 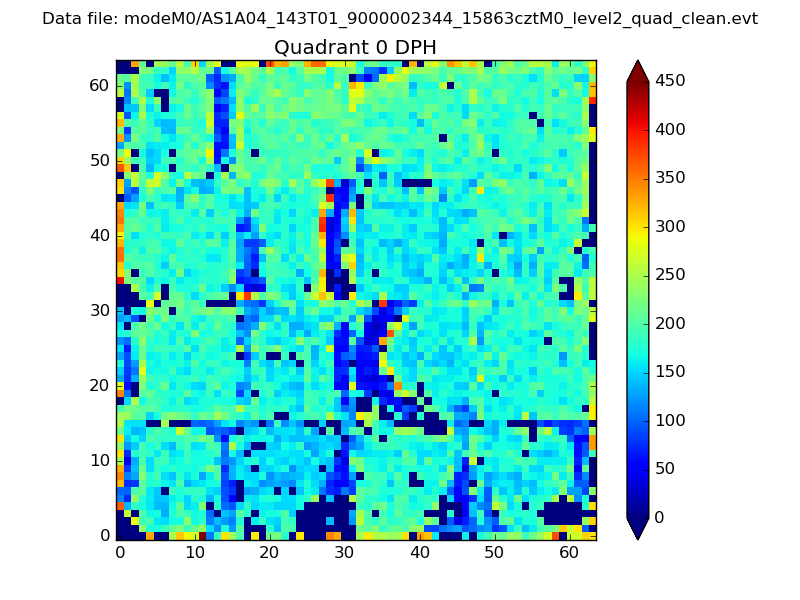 |
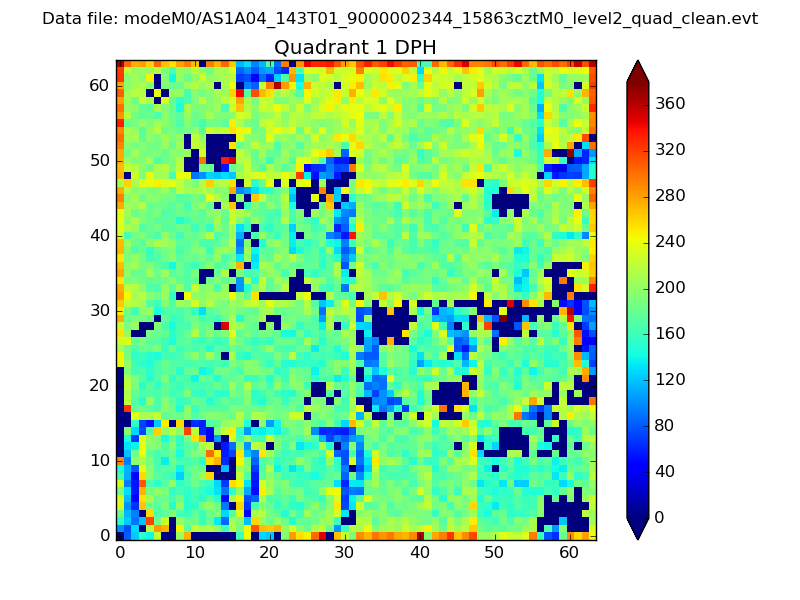 |
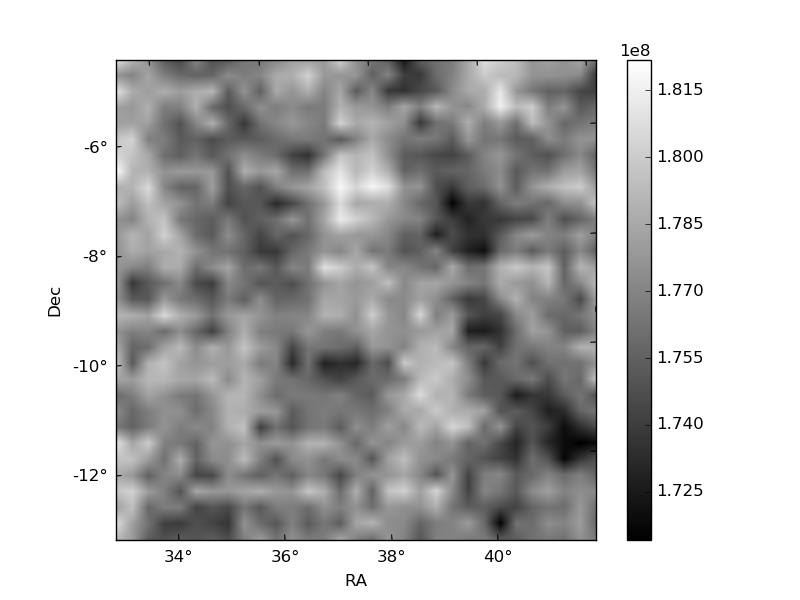
Quadrant B |
|---|---|---|---|
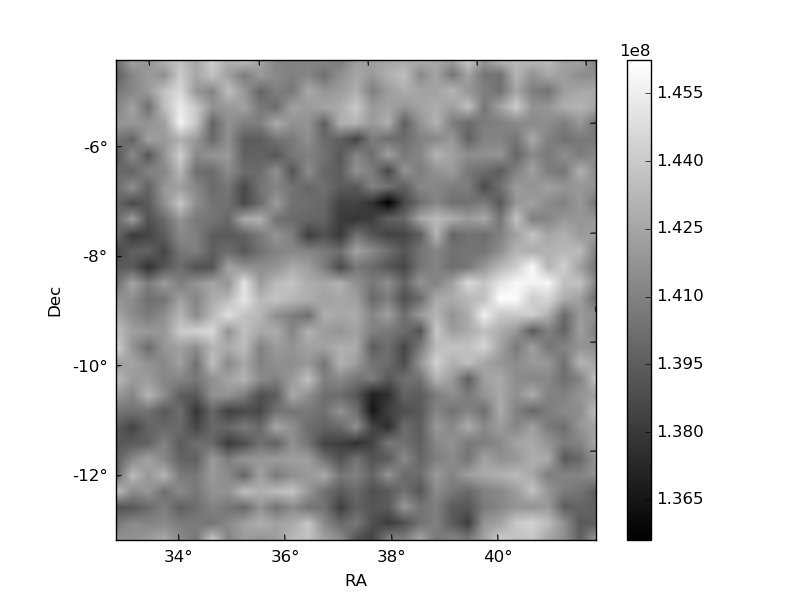
| Quadrant D | 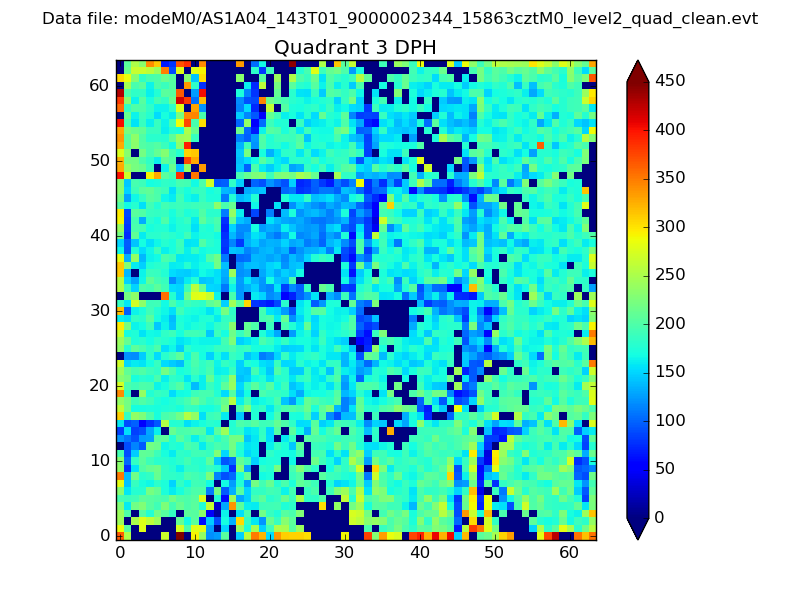 |
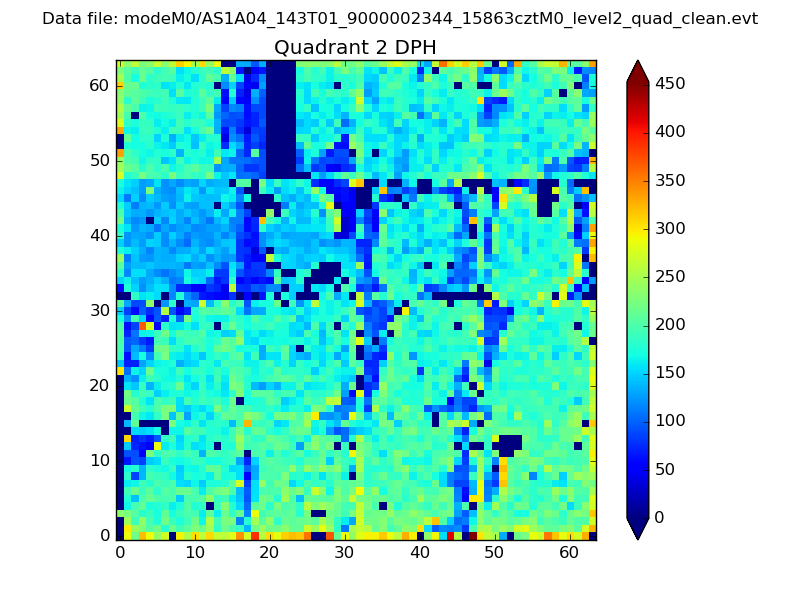 |
Quadrant C |
| Plot type | Count rate plots | Images |
|---|---|---|
| Comparison with Poisson distribution Blue bars denote a histogram of data divided into 1 sec bins. Red curve is a Poisson curve with rate = median count rate of data. |
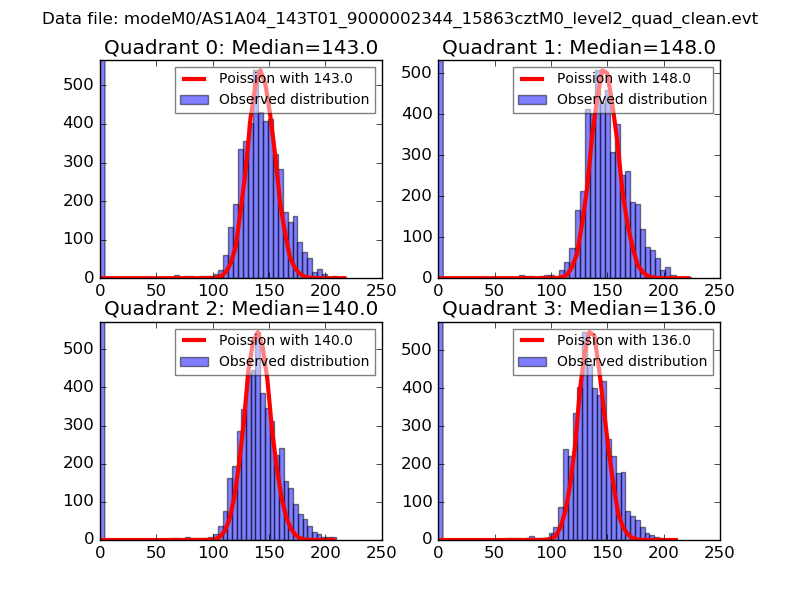 |
 |
| Quadrant-wise count rates Data is divided into 100 sec bins |
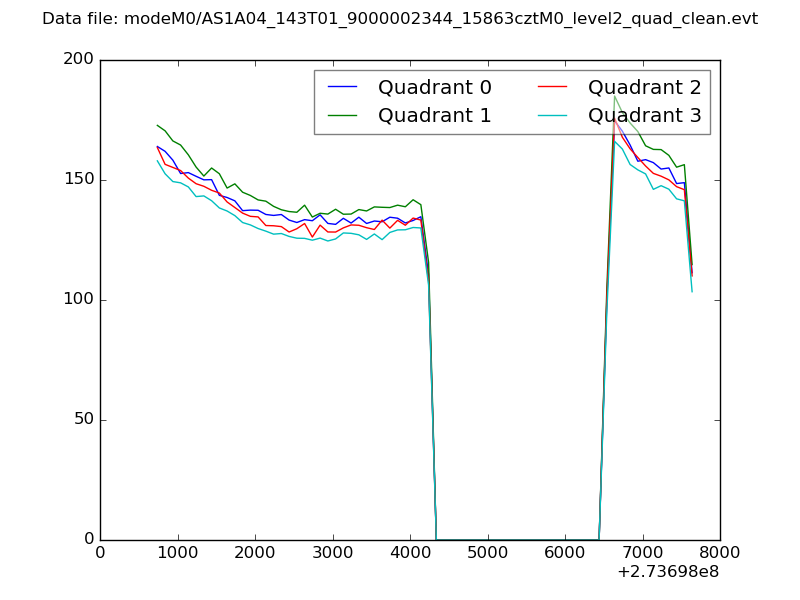 |
|
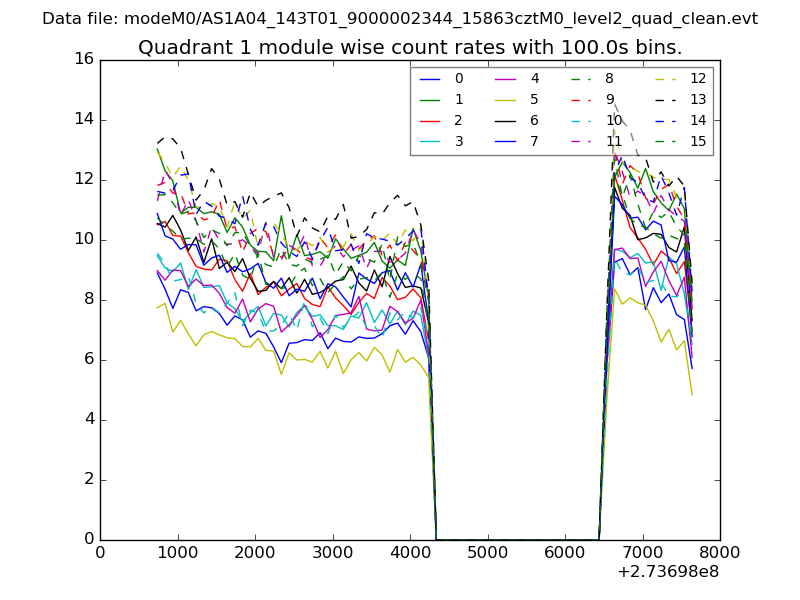
| Module-wise count rates for Quadrant A Data is divided into 100 sec bins |
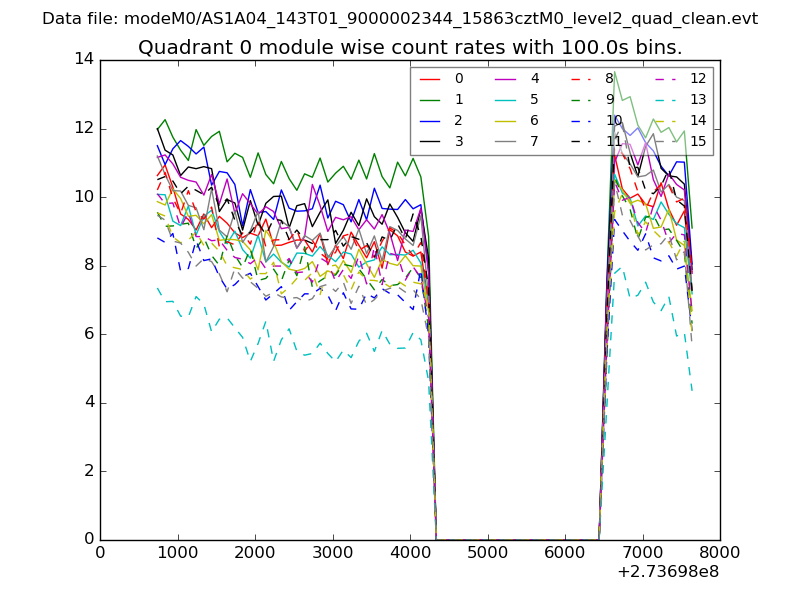 |
 |
| Module-wise count rates for Quadrant B Data is divided into 100 sec bins |
 |
 |
| Module-wise count rates for Quadrant C Data is divided into 100 sec bins |
 |
 |
| Module-wise count rates for Quadrant D Data is divided into 100 sec bins |
 |
 |
| Parameter | Plot |
|---|---|
| CZT HV Monitor | 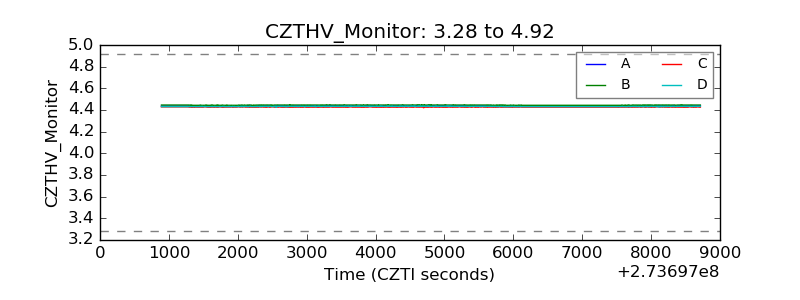 |
| D_VDD | 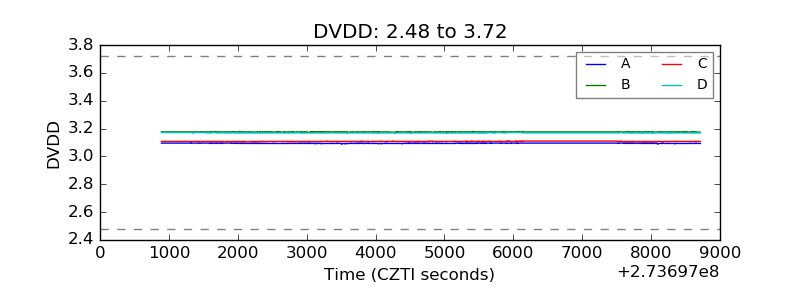 |
| Temperature 1 | 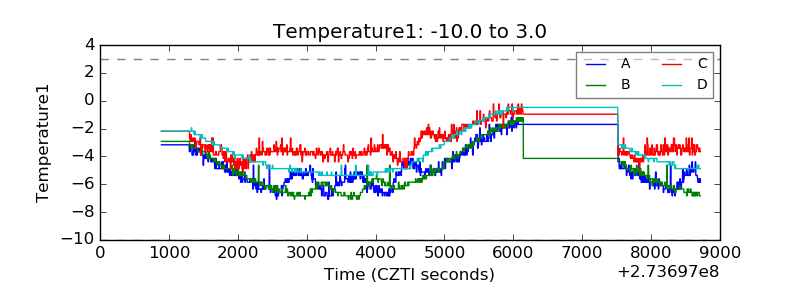 |
| Veto HV Monitor | 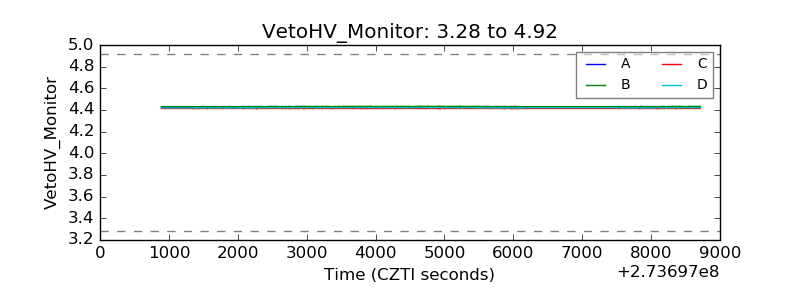 |
| Veto LLD | 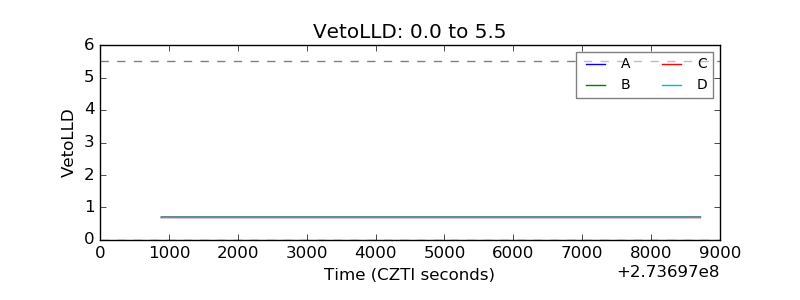 |
| Alpha Counter | 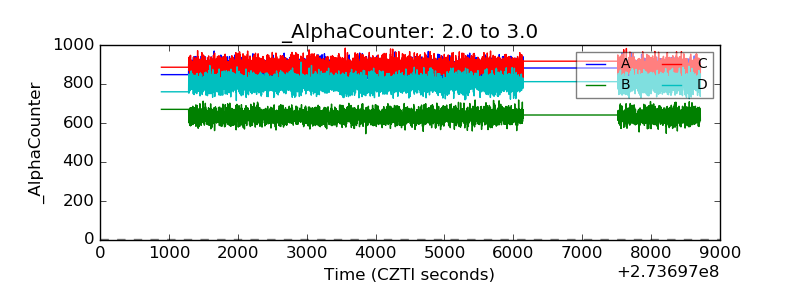 |
| _CPM_Rate | 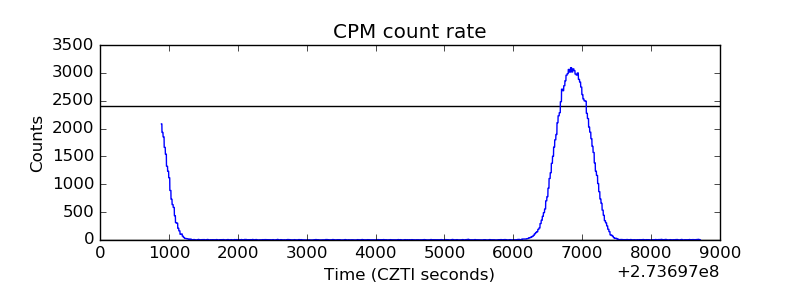 |
| CZT Counter | 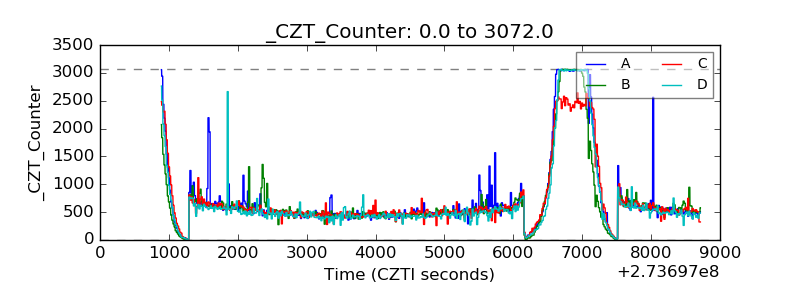 |
| +2.5 Volts monitor |  |
| +5 Volts monitor |  |
| _ROLL_ROT |  |
| _Roll_DEC | 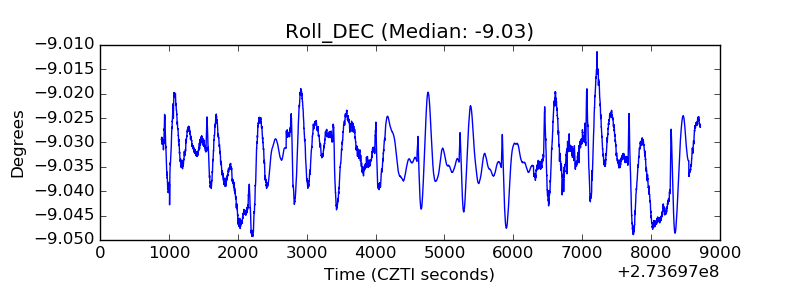 |
| _Roll_RA | 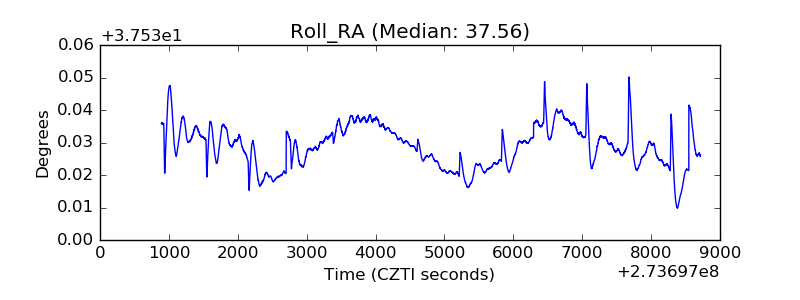 |
| Veto Counter | 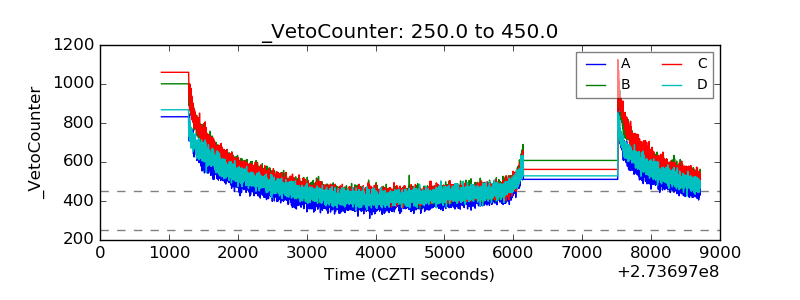 |