| Param | Original file | Final file |
|---|---|---|
| Filename | modeM0/AS1A04_143T01_9000002344_15866cztM0_level2.evt | modeM0/AS1A04_143T01_9000002344_15866cztM0_level2_quad_clean.evt |
| Size (bytes) | 498,666,240 | 96,168,960 |
| Size | 475.6 MB | 91.7 MB |
| Events in quadrant A | 3,871,281 | 605,026 |
| Events in quadrant B | 3,634,383 | 627,773 |
| Events in quadrant C | 3,804,131 | 593,029 |
| Events in quadrant D | 3,302,165 | 583,999 |
| Mode SS | |||
|---|---|---|---|
| Quadrant | BADHDUFLAG | Total packets | Discarded packets |
| A | 0 | 148 | 0 |
| B | 0 | 148 | 0 |
| C | 0 | 148 | 0 |
| D | 0 | 148 | 0 |
| Mode M0 | |||
|---|---|---|---|
| Quadrant | BADHDUFLAG | Total packets | Discarded packets |
| A | 0 | 16436 | 3 |
| B | 0 | 15488 | 2 |
| C | 0 | 15725 | 2 |
| D | 0 | 14945 | 2 |
| Mode M9 | |||
|---|---|---|---|
| Quadrant | BADHDUFLAG | Total packets | Discarded packets |
| A | 0 | 22 | 0 |
| B | 0 | 22 | 0 |
| C | 0 | 22 | 0 |
| D | 0 | 22 | 0 |
| Quadrant | Total seconds | Saturated seconds | Saturation percentage |
|---|---|---|---|
| A | 7218 | 95 | 1.316154% |
| B | 7218 | 118 | 1.634802% |
| C | 7218 | 96 | 1.330008% |
| D | 7218 | 16 | 0.221668% |
Noise dominated data is calculated using 1-second bins in cleaned event files. If a bin has >2000 counts, and if more than 50% of those come from <1% of pixels, then it is considered to be noise-dominated and hence unusable.
| Quadrant | # 1 sec bins | Bins with >0 counts | Bins with >2000 counts | High rate bins dominated by noise | Noise dominated (total time) | Noise dominated (detector-on time) | Marked lightcurve |
|---|---|---|---|---|---|---|---|
| A | 9434 | 7221 | 18 | 18 | 0.19% | 0.25% | 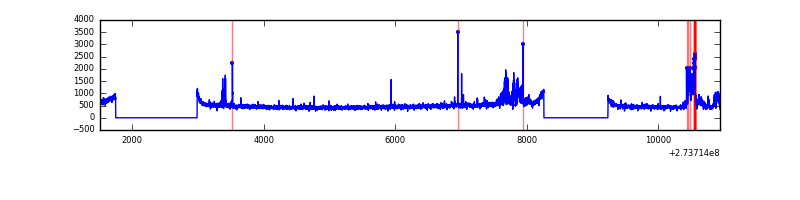 |
| B | 9434 | 7221 | 3 | 3 | 0.03% | 0.04% | 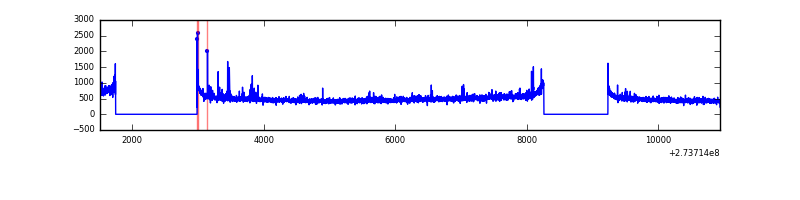 |
| C | 9434 | 7221 | 7 | 7 | 0.07% | 0.10% | 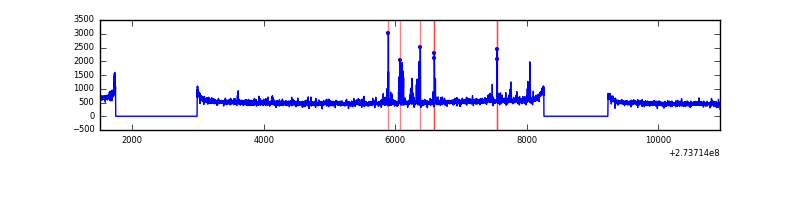 |
| D | 9434 | 7221 | 0 | 0 | 0.00% | 0.00% | 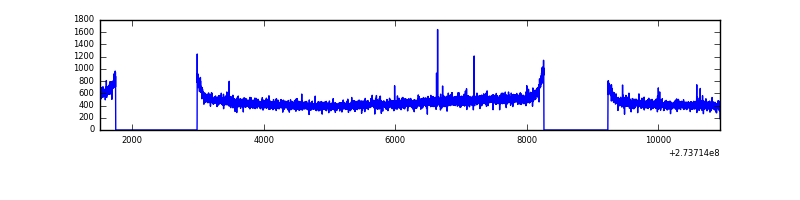 |
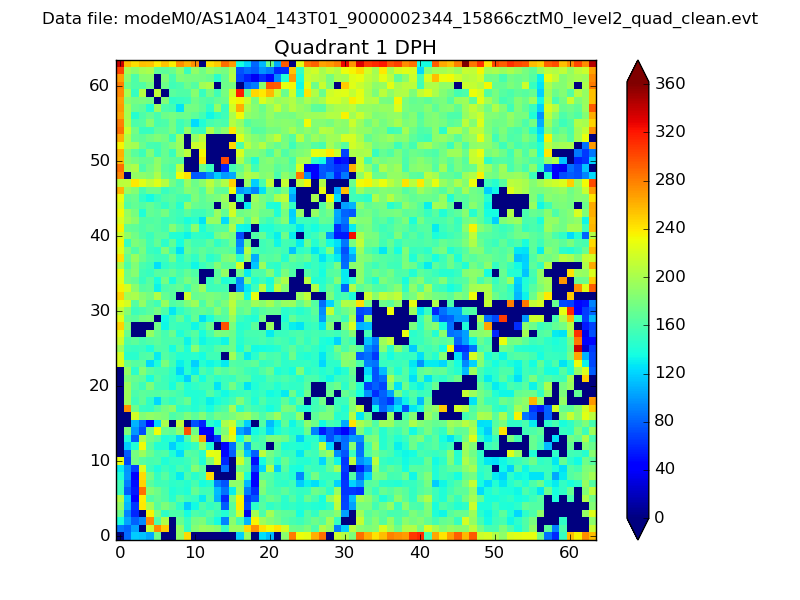
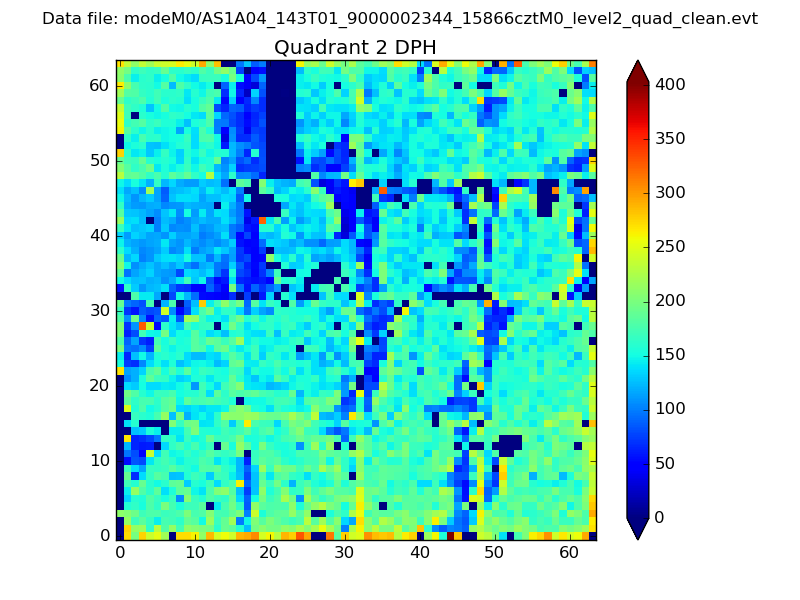
Top three noisy pixels from each quadrant. If the there are fewer than three noisy pixels in the level2.evt file, extra rows are filled as -1
| Pixel properties | Quadrant properties | ||||||
|---|---|---|---|---|---|---|---|
| Quadrant | DetID | PixID | Counts | Sigma | Mean | Median | Sigma |
| A | 15 | 239 | 436501 | 2399.4 | 891 | 873 | 181.6 |
| A | 9 | 143 | 7976 | 39.12 | 891 | 873 | 181.6 |
| A | 0 | 226 | 7831 | 38.32 | 891 | 873 | 181.6 |
| B | 5 | 65 | 42609 | 240.62 | 901 | 876 | 173.4 |
| B | 4 | 173 | 24586 | 136.7 | 901 | 876 | 173.4 |
| B | 12 | 16 | 21243 | 117.43 | 901 | 876 | 173.4 |
| C | 3 | 233 | 144711 | 710.66 | 862 | 867 | 202.4 |
| C | 0 | 207 | 140943 | 692.04 | 862 | 867 | 202.4 |
| C | 14 | 238 | 130939 | 642.62 | 862 | 867 | 202.4 |
| D | 2 | 234 | 26245 | 118.64 | 872 | 846 | 214.1 |
| D | 10 | 172 | 10118 | 43.31 | 872 | 846 | 214.1 |
| D | 14 | 226 | 8695 | 36.66 | 872 | 846 | 214.1 |
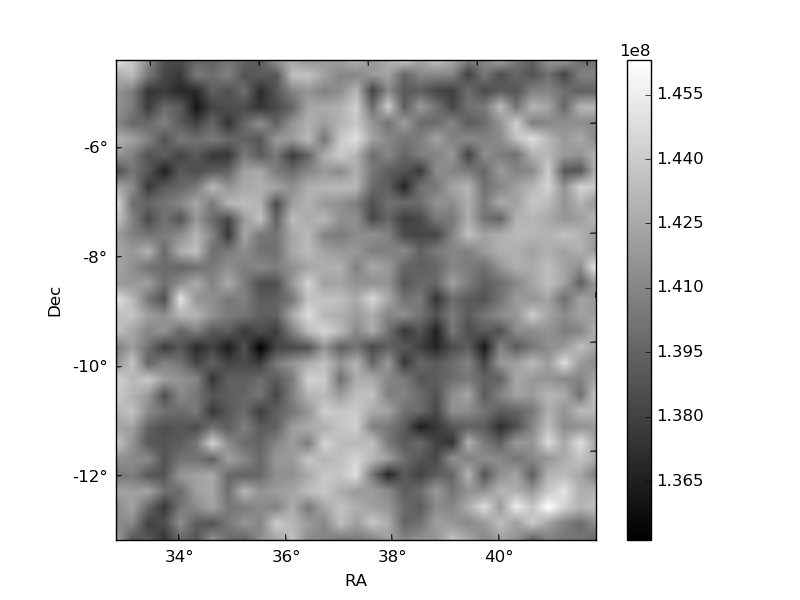
Histogram calculated using DETX and DETY for each event in the final _common_clean file
| Quadrant A | 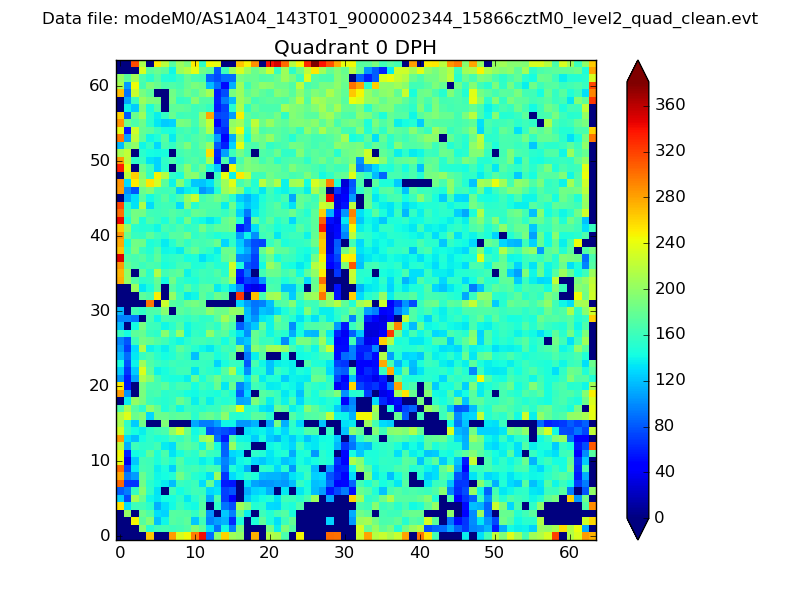 |
 |
Quadrant B |
|---|---|---|---|
| Quadrant D | 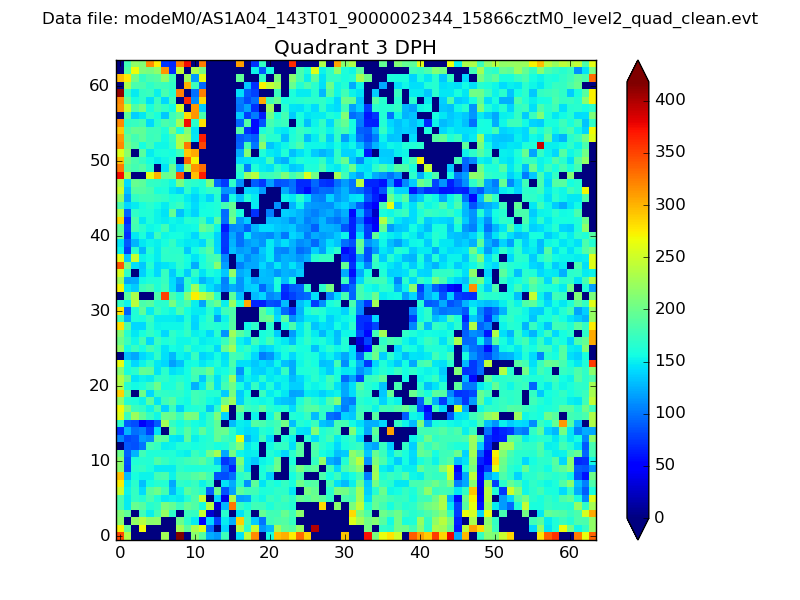 |
 |
Quadrant C |
| Plot type | Count rate plots | Images |
|---|---|---|
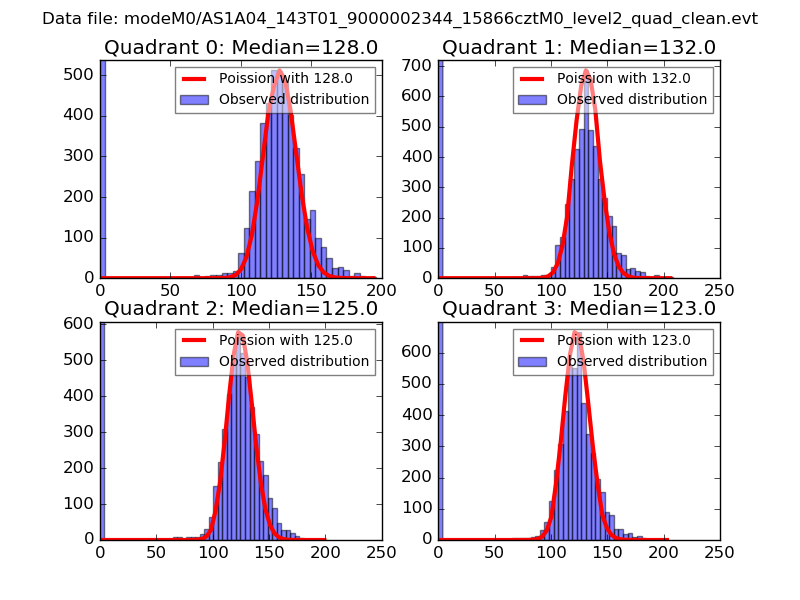
| Comparison with Poisson distribution Blue bars denote a histogram of data divided into 1 sec bins. Red curve is a Poisson curve with rate = median count rate of data. |
 |
 |
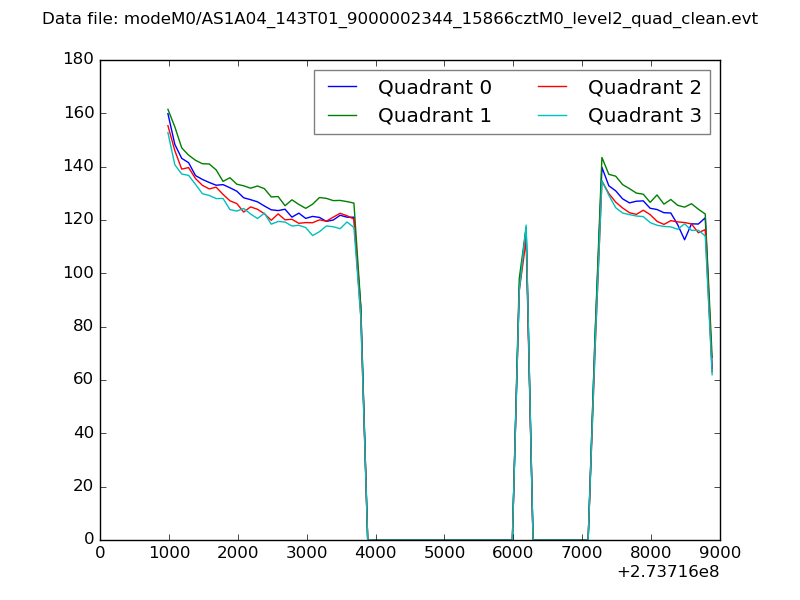
| Quadrant-wise count rates Data is divided into 100 sec bins |
 |
|
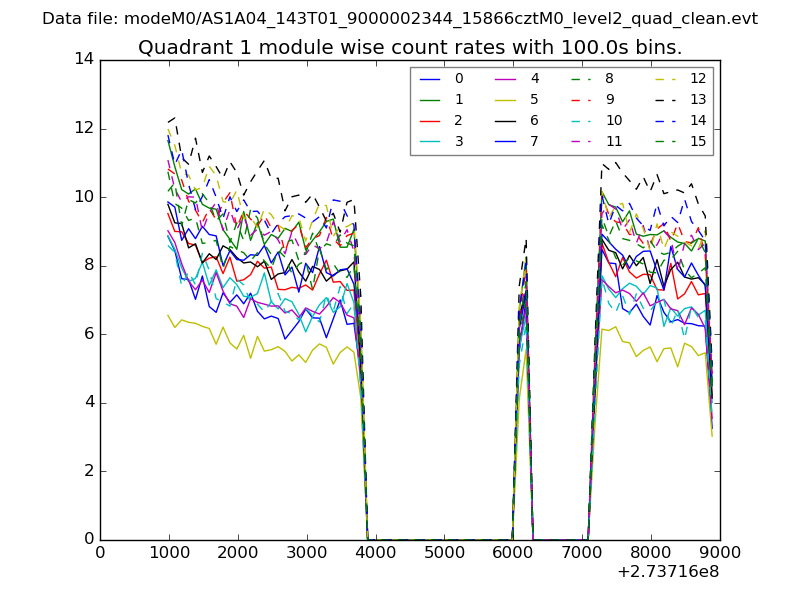
| Module-wise count rates for Quadrant A Data is divided into 100 sec bins |
 |
 |
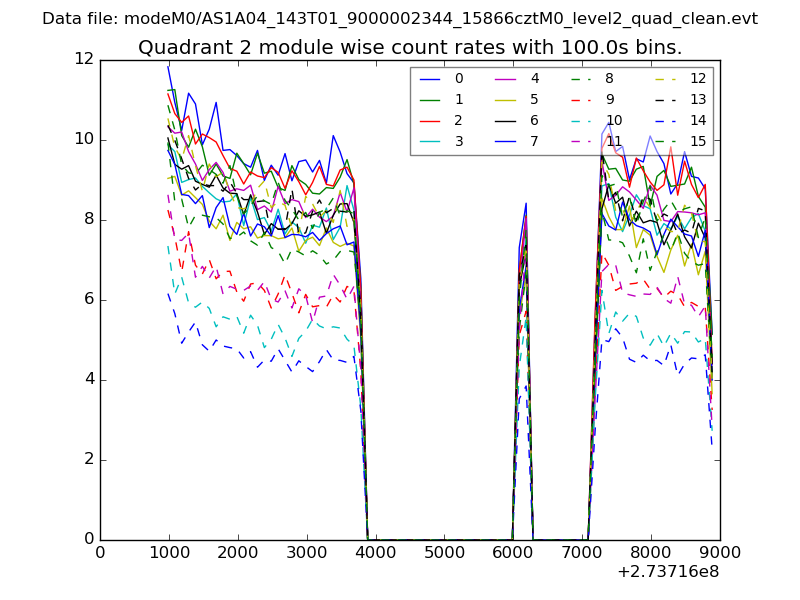
| Module-wise count rates for Quadrant B Data is divided into 100 sec bins |
 |
 |
| Module-wise count rates for Quadrant C Data is divided into 100 sec bins |
 |
 |
| Module-wise count rates for Quadrant D Data is divided into 100 sec bins |
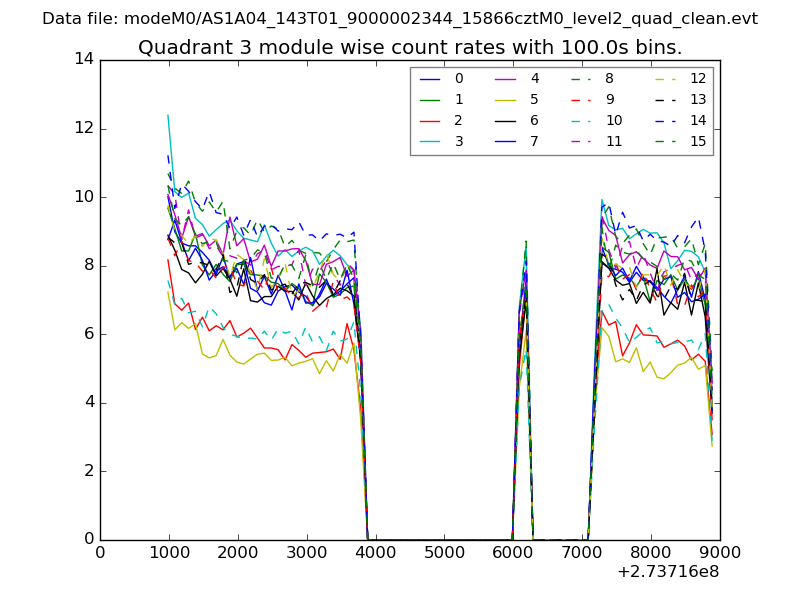 |
 |
| Parameter | Plot |
|---|---|
| CZT HV Monitor | 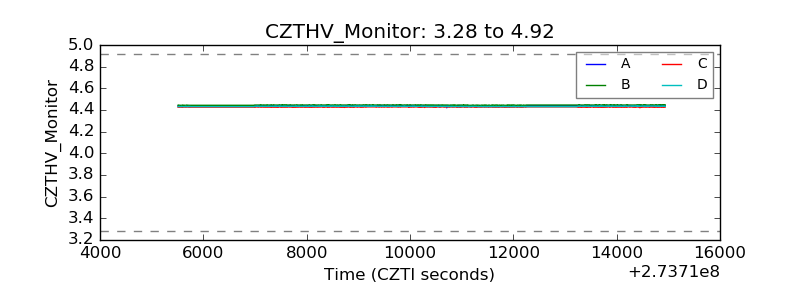 |
| D_VDD | 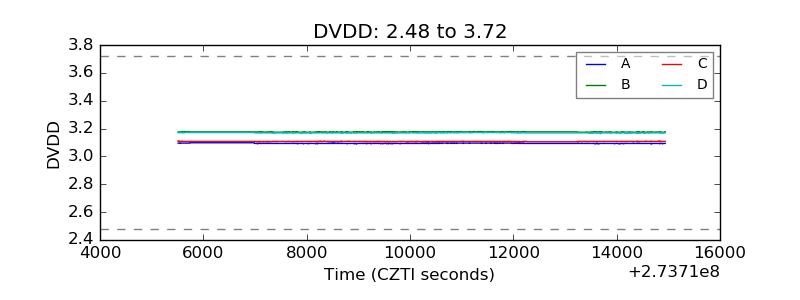 |
| Temperature 1 | 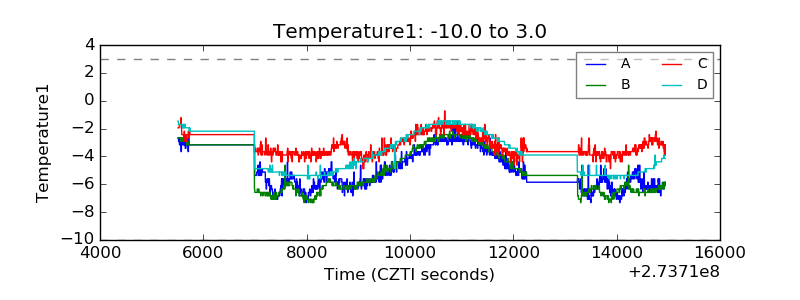 |
| Veto HV Monitor | 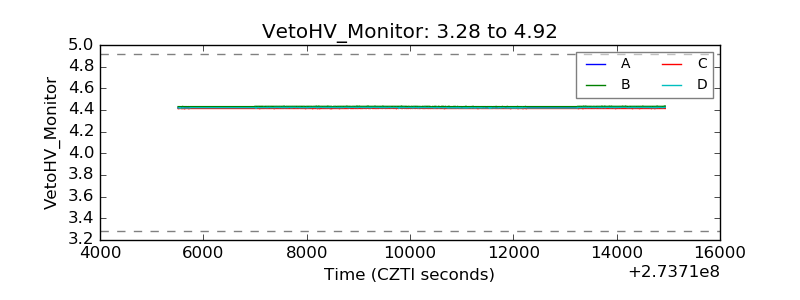 |
| Veto LLD | 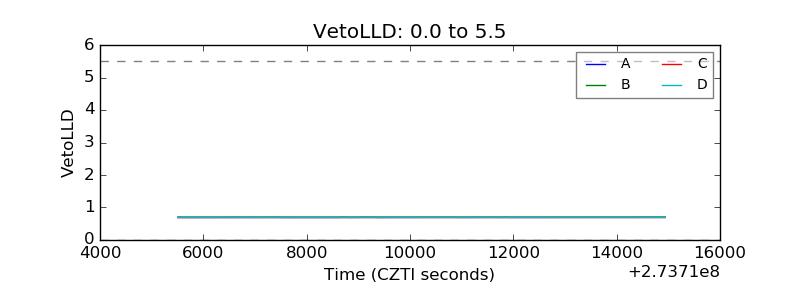 |
| Alpha Counter | 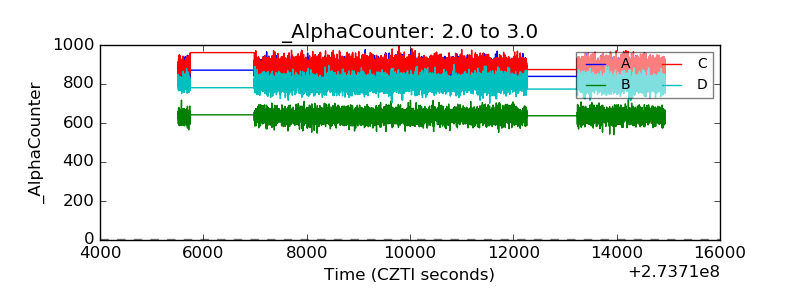 |
| _CPM_Rate | 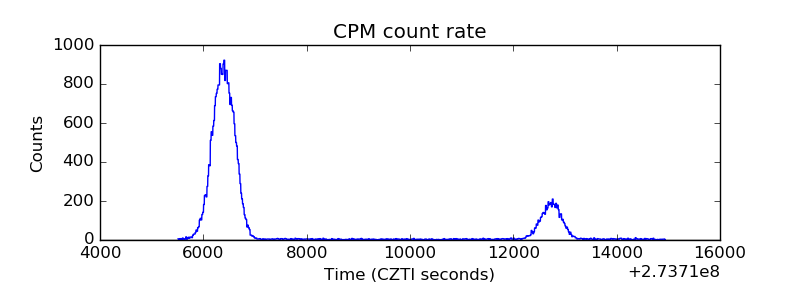 |
| CZT Counter | 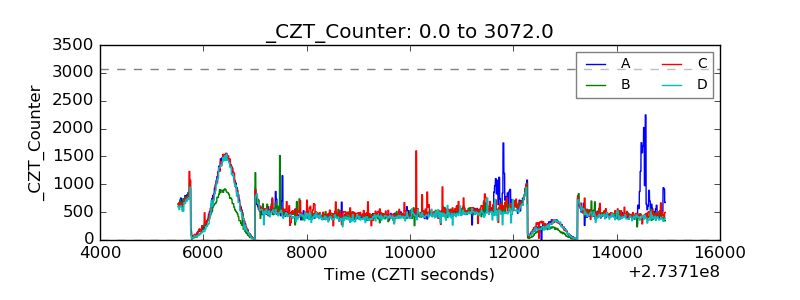 |
| +2.5 Volts monitor |  |
| +5 Volts monitor |  |
| _ROLL_ROT |  |
| _Roll_DEC |  |
| _Roll_RA | 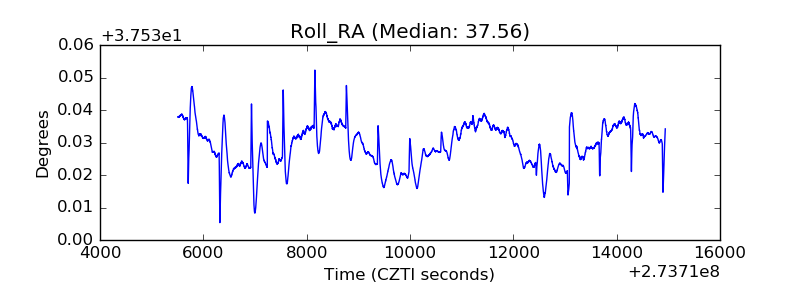 |
| Veto Counter | 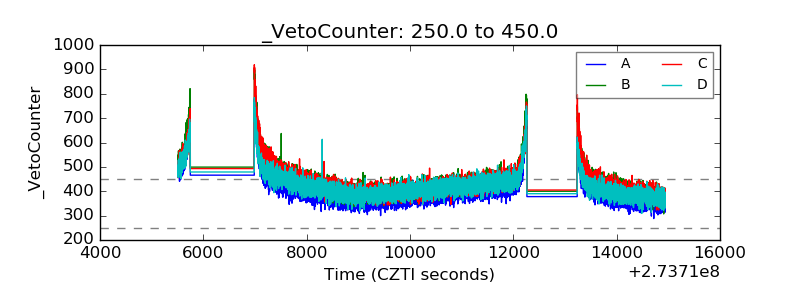 |