| Param | Original file | Final file |
|---|---|---|
| Filename | modeM0/AS1A04_143T01_9000002344_15867cztM0_level2.evt | modeM0/AS1A04_143T01_9000002344_15867cztM0_level2_quad_clean.evt |
| Size (bytes) | 531,529,920 | 106,724,160 |
| Size | 506.9 MB | 101.8 MB |
| Events in quadrant A | 3,919,311 | 676,986 |
| Events in quadrant B | 3,885,177 | 700,266 |
| Events in quadrant C | 4,209,575 | 659,244 |
| Events in quadrant D | 3,555,641 | 655,033 |
| Mode SS | |||
|---|---|---|---|
| Quadrant | BADHDUFLAG | Total packets | Discarded packets |
| A | 0 | 160 | 0 |
| B | 0 | 160 | 0 |
| C | 0 | 160 | 0 |
| D | 0 | 160 | 0 |
| Mode M0 | |||
|---|---|---|---|
| Quadrant | BADHDUFLAG | Total packets | Discarded packets |
| A | 0 | 16797 | 3 |
| B | 0 | 16712 | 2 |
| C | 0 | 17392 | 2 |
| D | 0 | 16184 | 2 |
| Mode M9 | |||
|---|---|---|---|
| Quadrant | BADHDUFLAG | Total packets | Discarded packets |
| A | 0 | 15 | 0 |
| B | 0 | 15 | 0 |
| C | 0 | 15 | 0 |
| D | 0 | 15 | 0 |
| Quadrant | Total seconds | Saturated seconds | Saturation percentage |
|---|---|---|---|
| A | 7772 | 57 | 0.733402% |
| B | 7772 | 98 | 1.260937% |
| C | 7772 | 206 | 2.650540% |
| D | 7772 | 50 | 0.643335% |
Noise dominated data is calculated using 1-second bins in cleaned event files. If a bin has >2000 counts, and if more than 50% of those come from <1% of pixels, then it is considered to be noise-dominated and hence unusable.
| Quadrant | # 1 sec bins | Bins with >0 counts | Bins with >2000 counts | High rate bins dominated by noise | Noise dominated (total time) | Noise dominated (detector-on time) | Marked lightcurve |
|---|---|---|---|---|---|---|---|
| A | 9278 | 7775 | 15 | 15 | 0.16% | 0.19% | 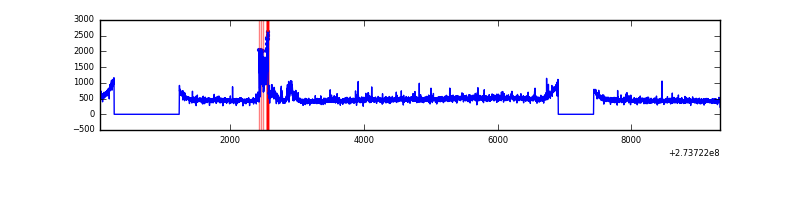 |
| B | 9278 | 7775 | 3 | 3 | 0.03% | 0.04% | 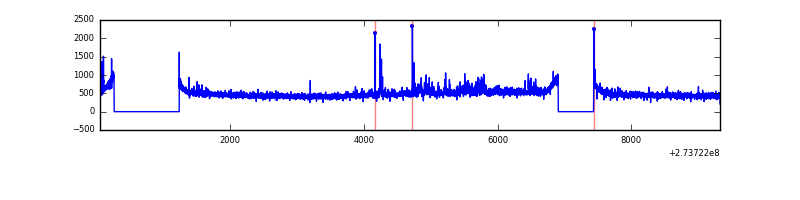 |
| C | 9278 | 7775 | 77 | 77 | 0.83% | 0.99% | 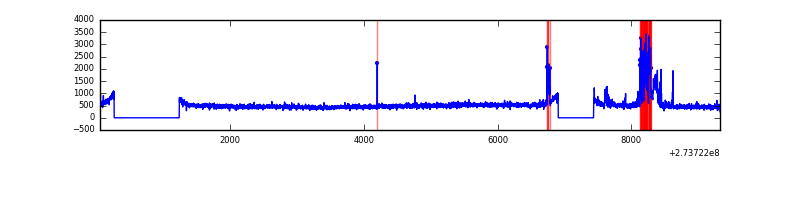 |
| D | 9278 | 7775 | 9 | 9 | 0.10% | 0.12% | 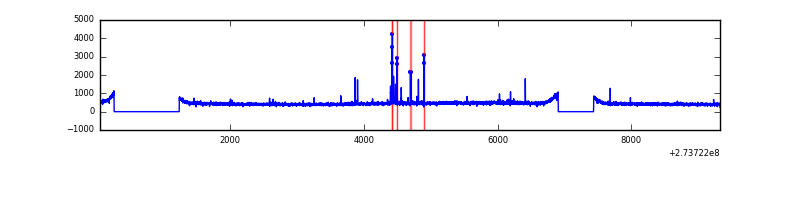 |
Top three noisy pixels from each quadrant. If the there are fewer than three noisy pixels in the level2.evt file, extra rows are filled as -1
| Pixel properties | Quadrant properties | ||||||
|---|---|---|---|---|---|---|---|
| Quadrant | DetID | PixID | Counts | Sigma | Mean | Median | Sigma |
| A | 15 | 239 | 291272 | 1516.49 | 942 | 921 | 191.5 |
| A | 0 | 226 | 8364 | 38.87 | 942 | 921 | 191.5 |
| A | 12 | 194 | 6799 | 30.7 | 942 | 921 | 191.5 |
| B | 5 | 65 | 88411 | 479.4 | 946 | 923 | 182.5 |
| B | 4 | 48 | 27597 | 146.16 | 946 | 923 | 182.5 |
| B | 12 | 111 | 22114 | 116.12 | 946 | 923 | 182.5 |
| C | 10 | 22 | 434932 | 2029.29 | 906 | 913 | 213.9 |
| C | 14 | 238 | 137730 | 639.7 | 906 | 913 | 213.9 |
| C | 3 | 233 | 85304 | 394.58 | 906 | 913 | 213.9 |
| D | 2 | 33 | 56517 | 244.64 | 921 | 893 | 227.4 |
| D | 2 | 234 | 28609 | 121.9 | 921 | 893 | 227.4 |
| D | 2 | 120 | 15016 | 62.11 | 921 | 893 | 227.4 |
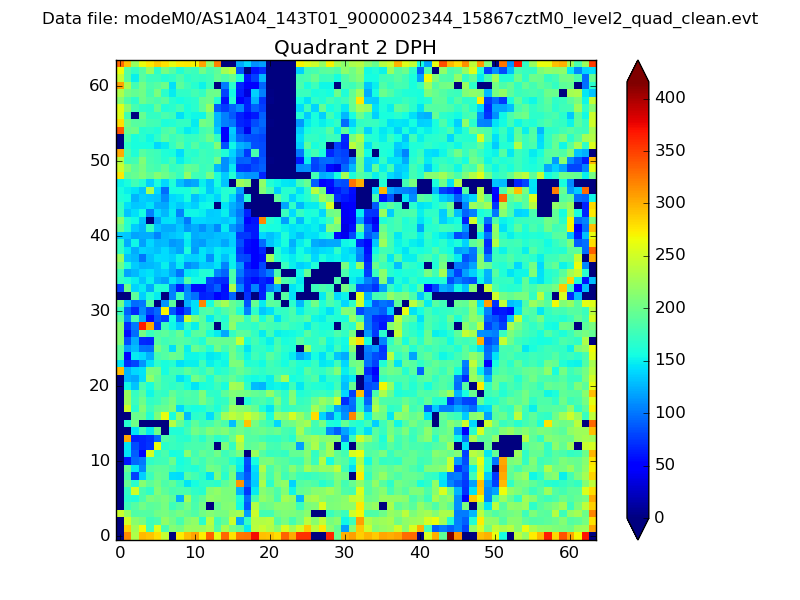
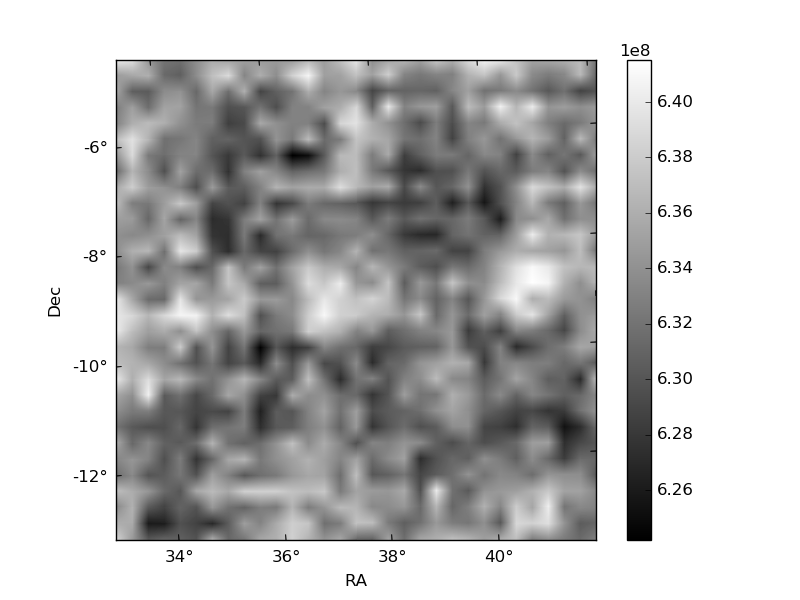
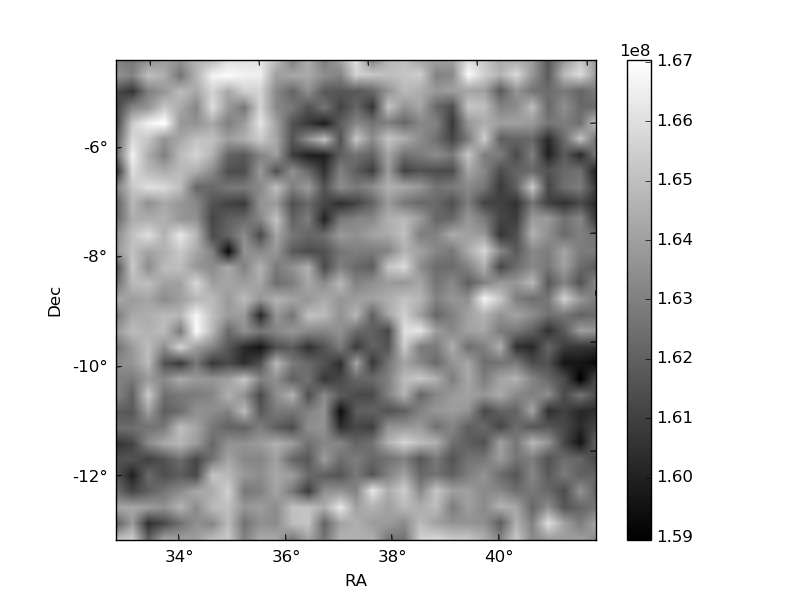
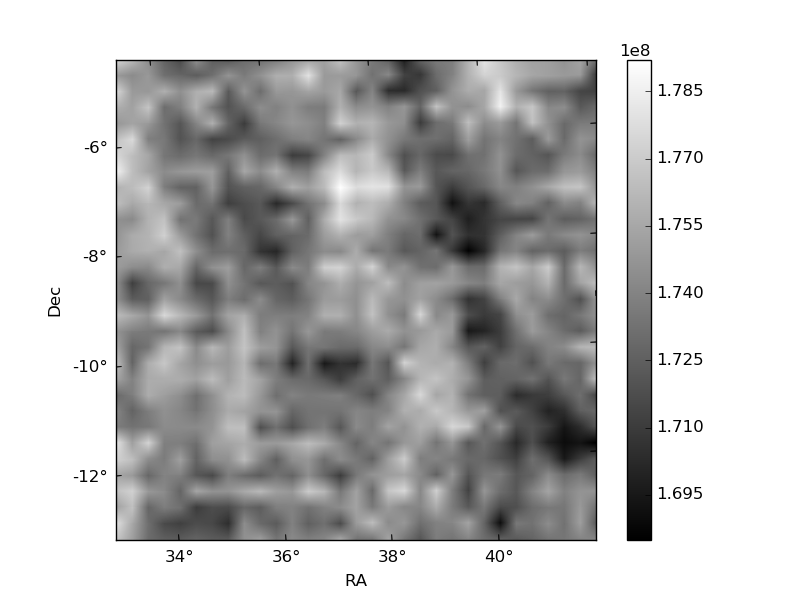
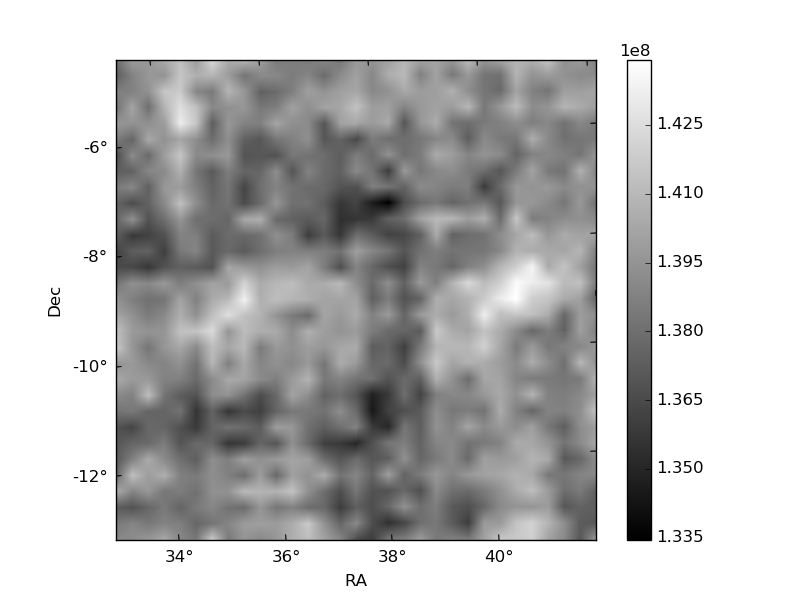
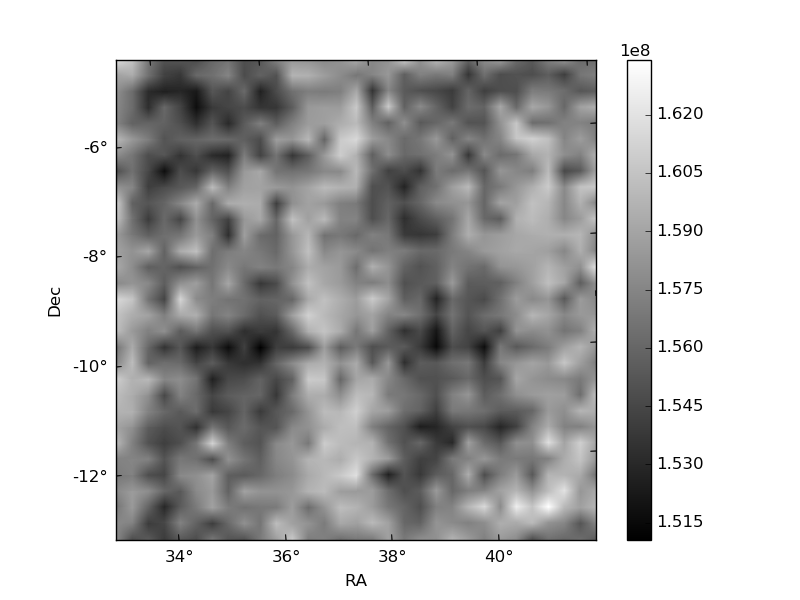
Histogram calculated using DETX and DETY for each event in the final _common_clean file
| Quadrant A | 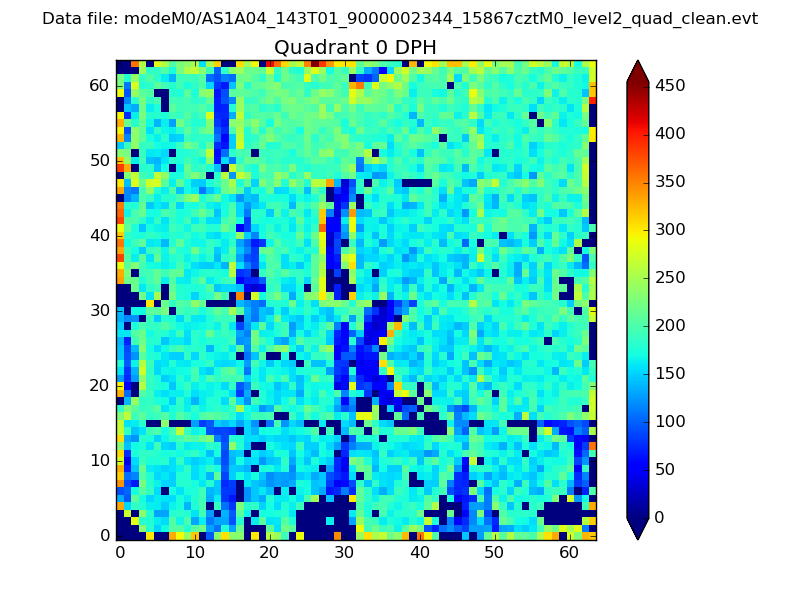 |
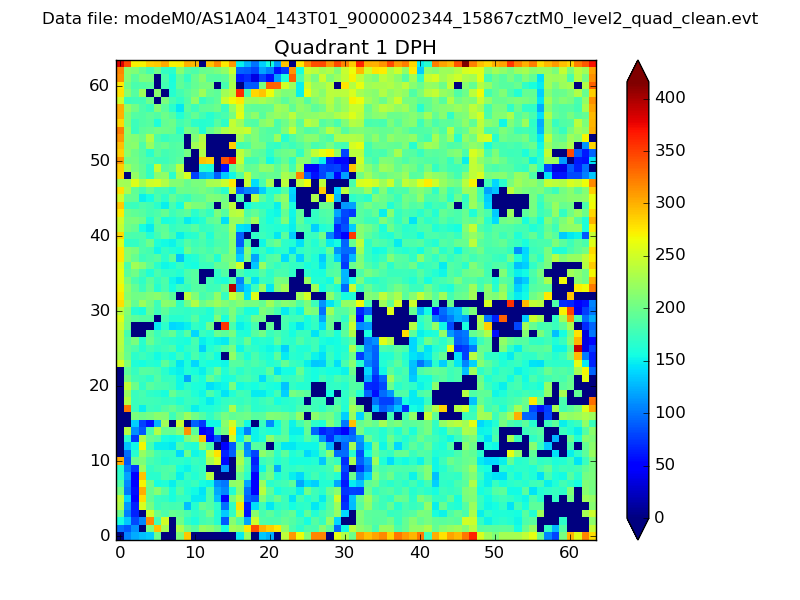 |
Quadrant B |
|---|---|---|---|
| Quadrant D | 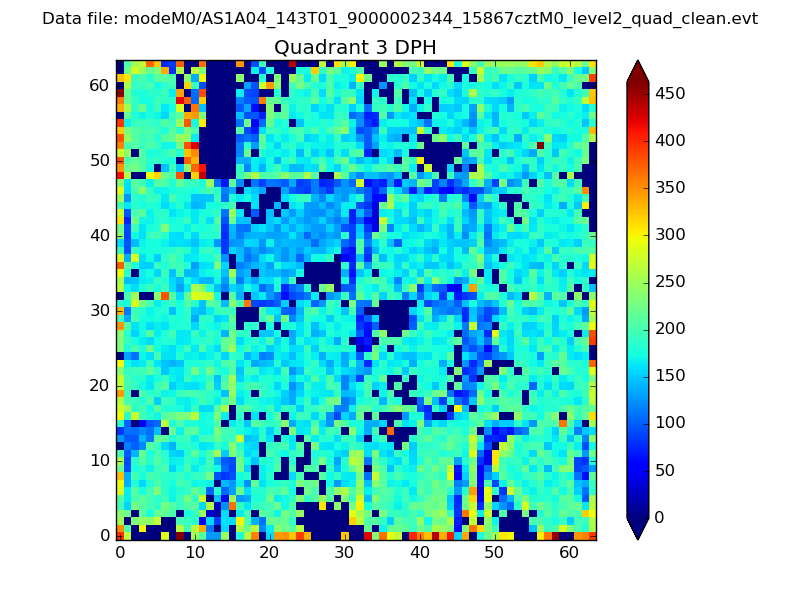 |
 |
Quadrant C |
| Plot type | Count rate plots | Images |
|---|---|---|
| Comparison with Poisson distribution Blue bars denote a histogram of data divided into 1 sec bins. Red curve is a Poisson curve with rate = median count rate of data. |
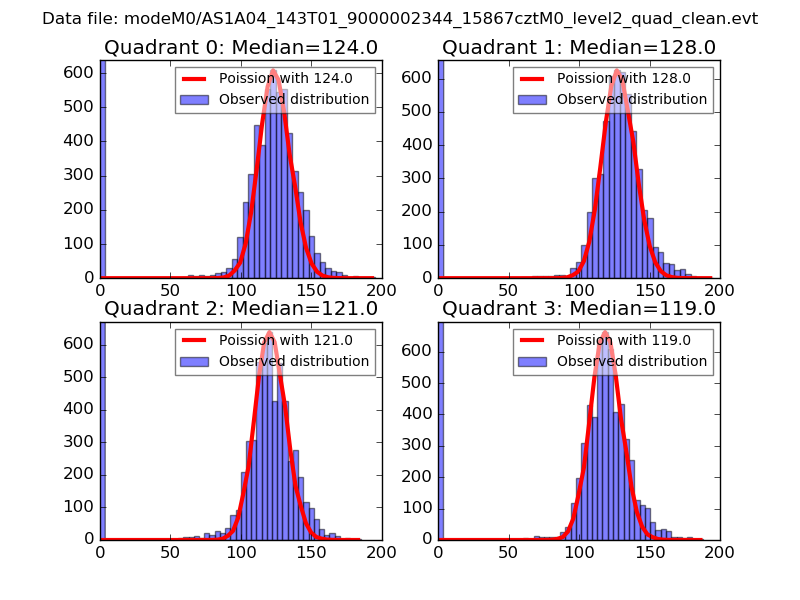 |
 |
| Quadrant-wise count rates Data is divided into 100 sec bins |
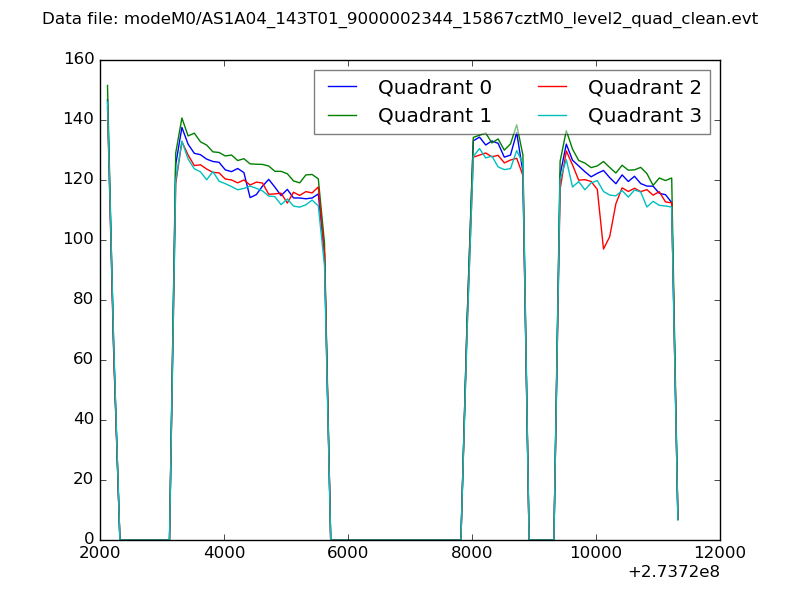 |
|
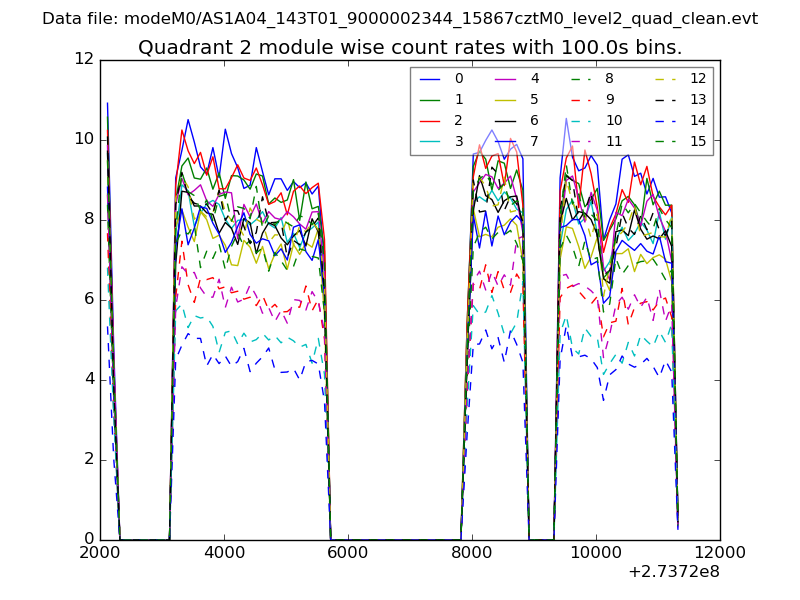
| Module-wise count rates for Quadrant A Data is divided into 100 sec bins |
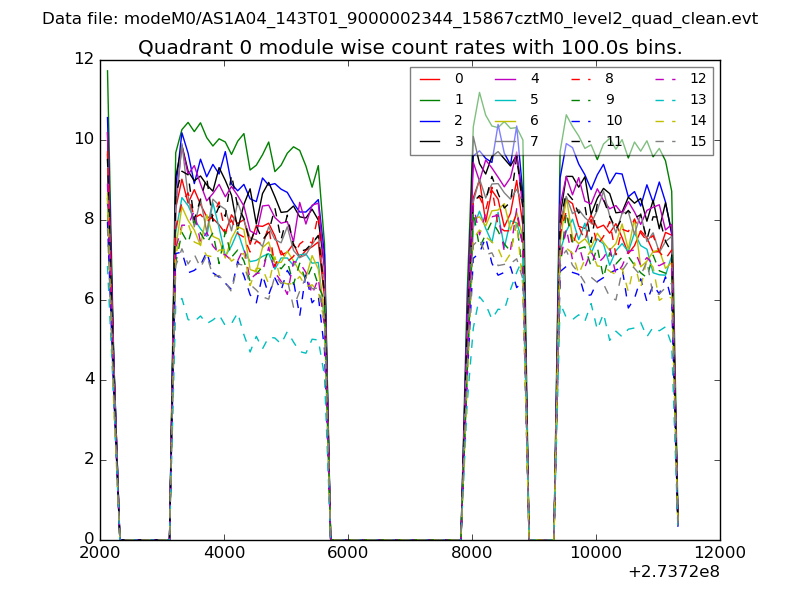 |
 |
| Module-wise count rates for Quadrant B Data is divided into 100 sec bins |
 |
 |
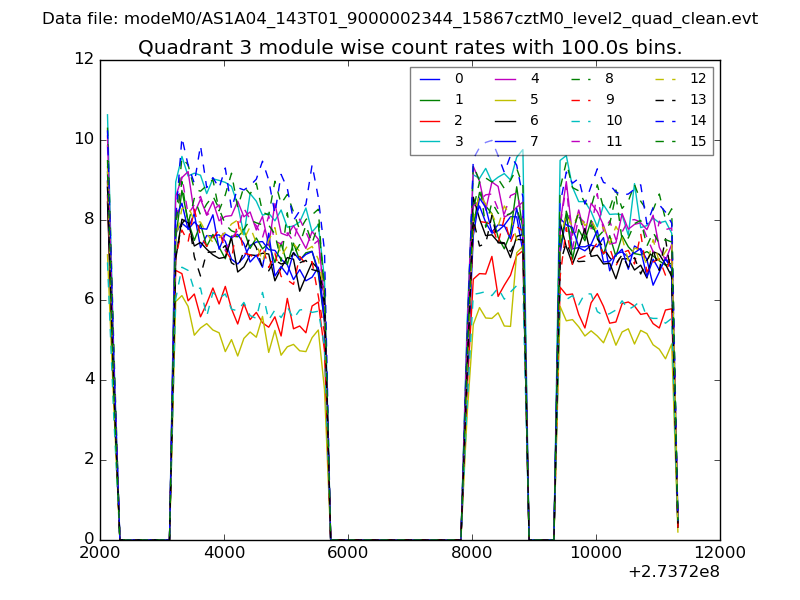
| Module-wise count rates for Quadrant C Data is divided into 100 sec bins |
 |
 |
| Module-wise count rates for Quadrant D Data is divided into 100 sec bins |
 |
 |
| Parameter | Plot |
|---|---|
| CZT HV Monitor | 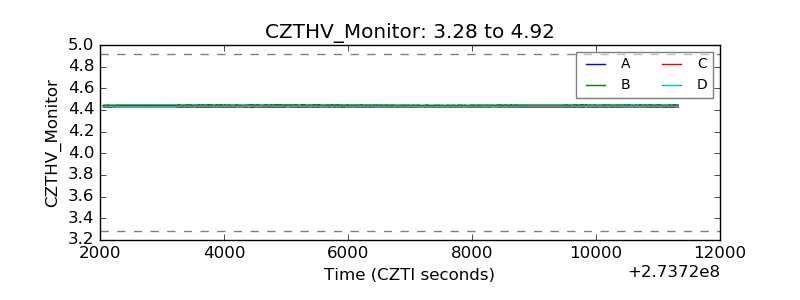 |
| D_VDD | 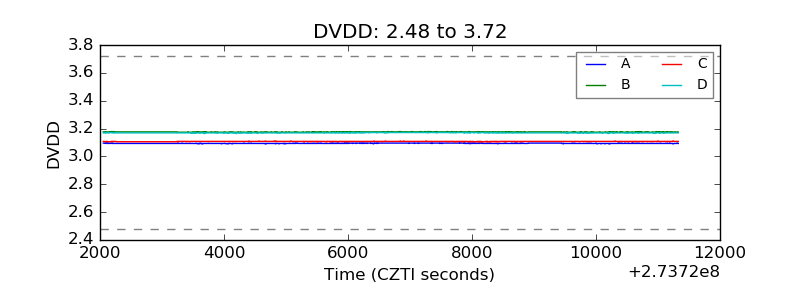 |
| Temperature 1 | 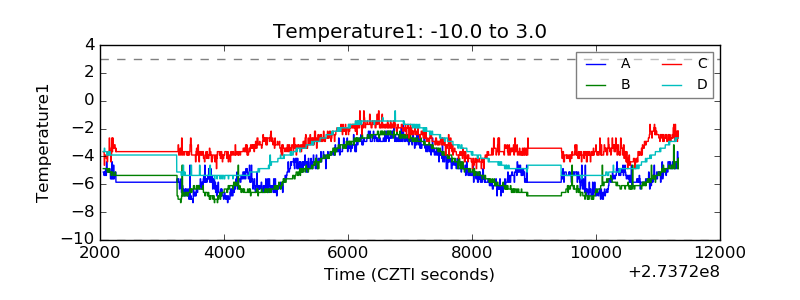 |
| Veto HV Monitor | 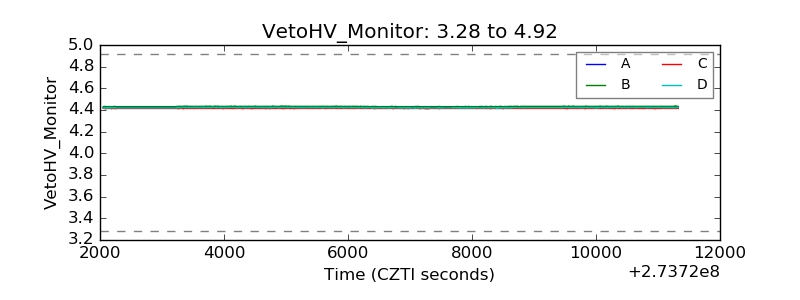 |
| Veto LLD | 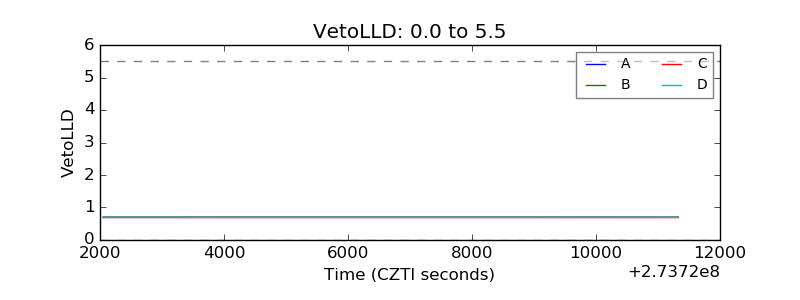 |
| Alpha Counter |  |
| _CPM_Rate | 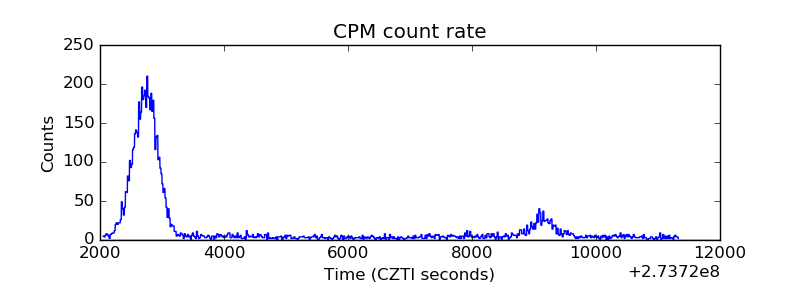 |
| CZT Counter | 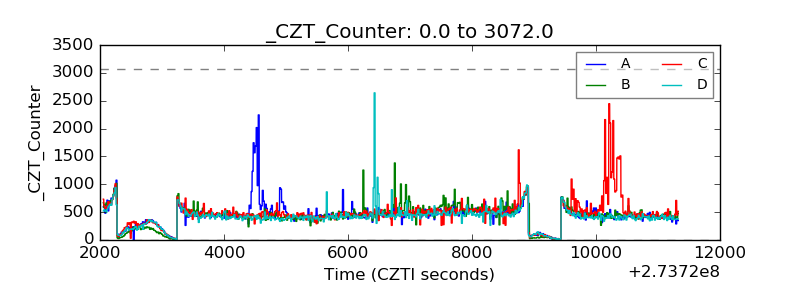 |
| +2.5 Volts monitor | 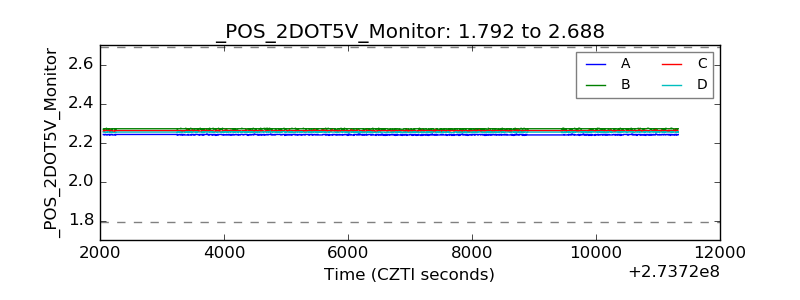 |
| +5 Volts monitor |  |
| _ROLL_ROT | 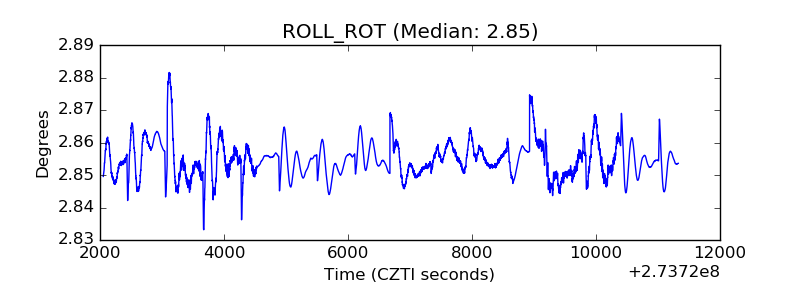 |
| _Roll_DEC | 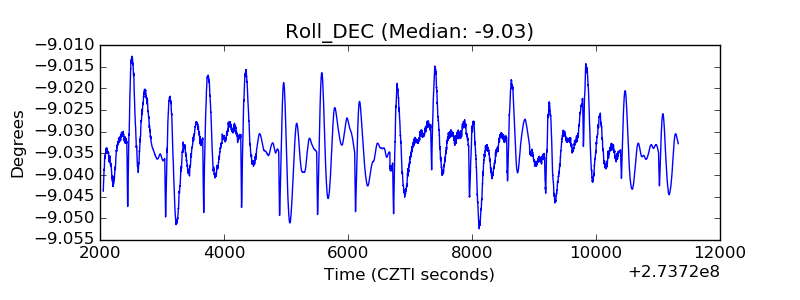 |
| _Roll_RA | 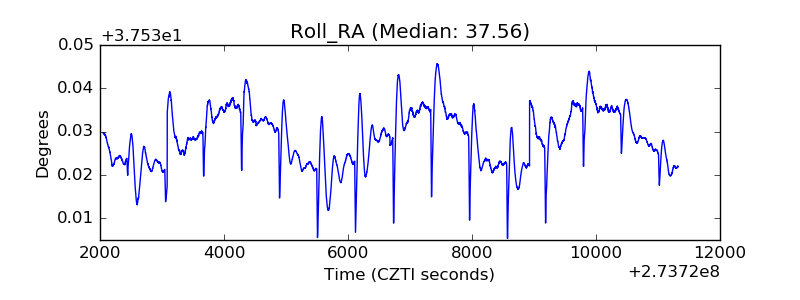 |
| Veto Counter | 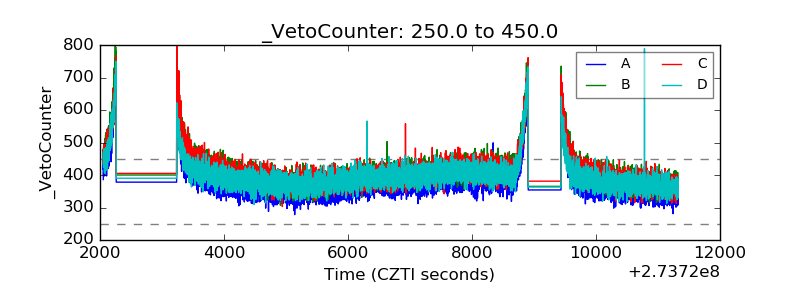 |