| Param | Original file | Final file |
|---|---|---|
| Filename | modeM0/AS1A04_143T01_9000002344_15868cztM0_level2.evt | modeM0/AS1A04_143T01_9000002344_15868cztM0_level2_quad_clean.evt |
| Size (bytes) | 359,470,080 | 62,239,680 |
| Size | 342.8 MB | 59.4 MB |
| Events in quadrant A | 2,535,772 | 382,257 |
| Events in quadrant B | 2,709,427 | 395,835 |
| Events in quadrant C | 2,924,296 | 366,171 |
| Events in quadrant D | 2,352,495 | 365,748 |
| Mode SS | |||
|---|---|---|---|
| Quadrant | BADHDUFLAG | Total packets | Discarded packets |
| A | 0 | 140 | 32 |
| B | 0 | 137 | 29 |
| C | 0 | 138 | 32 |
| D | 0 | 139 | 37 |
| Mode M0 | |||
|---|---|---|---|
| Quadrant | BADHDUFLAG | Total packets | Discarded packets |
| A | 0 | 14566 | 3469 |
| B | 0 | 14963 | 3446 |
| C | 0 | 15513 | 3528 |
| D | 0 | 14228 | 3418 |
| Mode M9 | |||
|---|---|---|---|
| Quadrant | BADHDUFLAG | Total packets | Discarded packets |
| A | 0 | 1 | 1 |
| B | 0 | 3 | 3 |
| C | 0 | 2 | 2 |
| D | 0 | 2 | 1 |
| Quadrant | Total seconds | Saturated seconds | Saturation percentage |
|---|---|---|---|
| A | 5352 | 19 | 0.355007% |
| B | 5377 | 42 | 0.781105% |
| C | 5334 | 134 | 2.512186% |
| D | 5338 | 2 | 0.037467% |
Noise dominated data is calculated using 1-second bins in cleaned event files. If a bin has >2000 counts, and if more than 50% of those come from <1% of pixels, then it is considered to be noise-dominated and hence unusable.
| Quadrant | # 1 sec bins | Bins with >0 counts | Bins with >2000 counts | High rate bins dominated by noise | Noise dominated (total time) | Noise dominated (detector-on time) | Marked lightcurve |
|---|---|---|---|---|---|---|---|
| A | 5823 | 5486 | 4 | 4 | 0.07% | 0.07% | 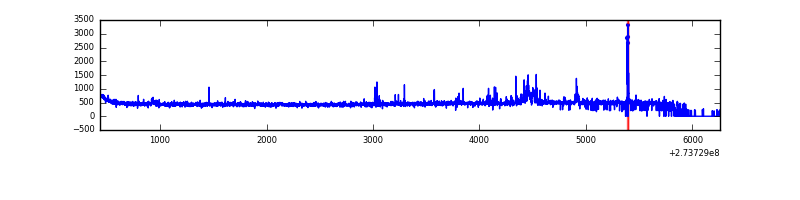 |
| B | 5800 | 5483 | 2 | 2 | 0.03% | 0.04% | 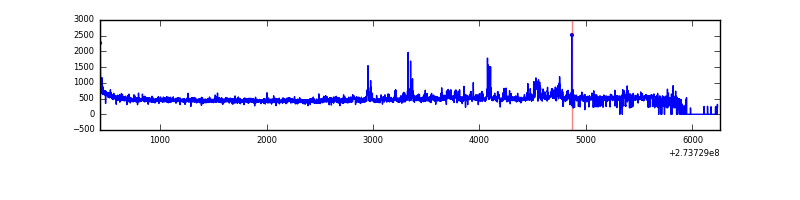 |
| C | 5726 | 5462 | 71 | 71 | 1.24% | 1.30% | 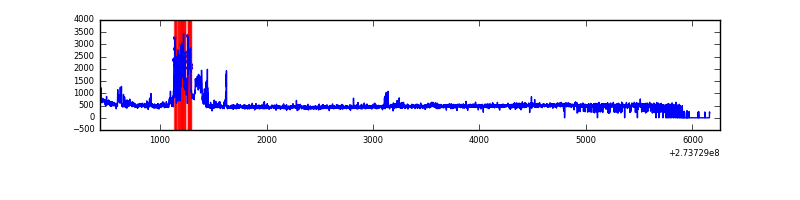 |
| D | 5797 | 5466 | 0 | 0 | 0.00% | 0.00% | 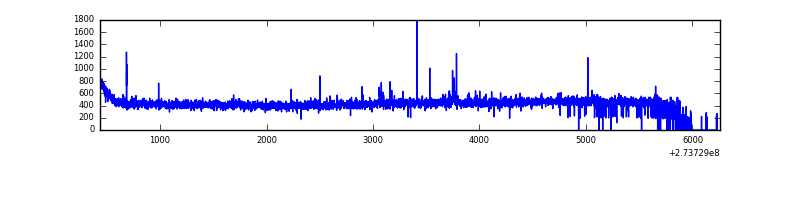 |
Top three noisy pixels from each quadrant. If the there are fewer than three noisy pixels in the level2.evt file, extra rows are filled as -1
| Pixel properties | Quadrant properties | ||||||
|---|---|---|---|---|---|---|---|
| Quadrant | DetID | PixID | Counts | Sigma | Mean | Median | Sigma |
| A | 15 | 239 | 111188 | 860.09 | 630 | 616 | 128.6 |
| A | 0 | 226 | 5680 | 39.39 | 630 | 616 | 128.6 |
| A | 12 | 194 | 4678 | 31.6 | 630 | 616 | 128.6 |
| B | 5 | 65 | 98190 | 803.19 | 633 | 618 | 121.5 |
| B | 4 | 216 | 35149 | 284.25 | 633 | 618 | 121.5 |
| B | 4 | 48 | 26958 | 216.83 | 633 | 618 | 121.5 |
| C | 10 | 22 | 406083 | 2838.57 | 601 | 606 | 142.8 |
| C | 14 | 238 | 91398 | 635.59 | 601 | 606 | 142.8 |
| C | 3 | 233 | 60220 | 417.33 | 601 | 606 | 142.8 |
| D | 2 | 234 | 20962 | 132.2 | 616 | 598 | 154.0 |
| D | 13 | 172 | 8404 | 50.68 | 616 | 598 | 154.0 |
| D | 2 | 120 | 6036 | 35.3 | 616 | 598 | 154.0 |
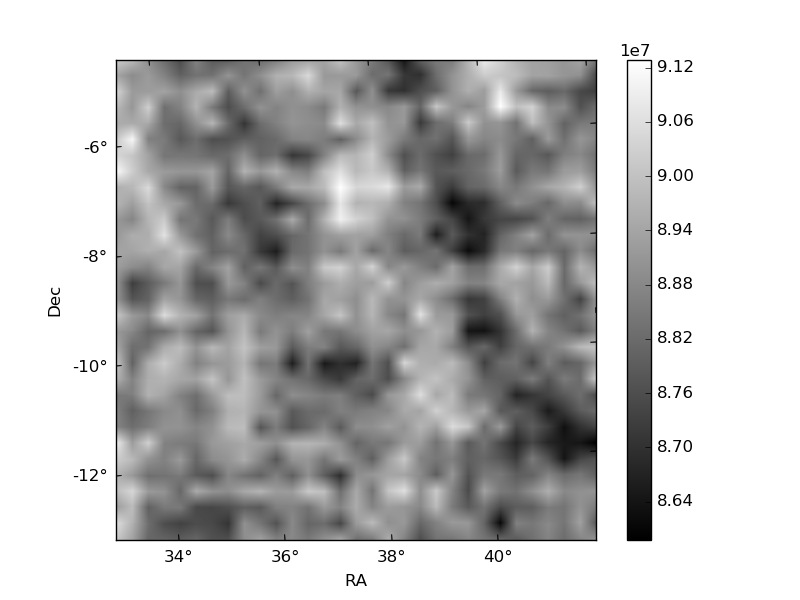
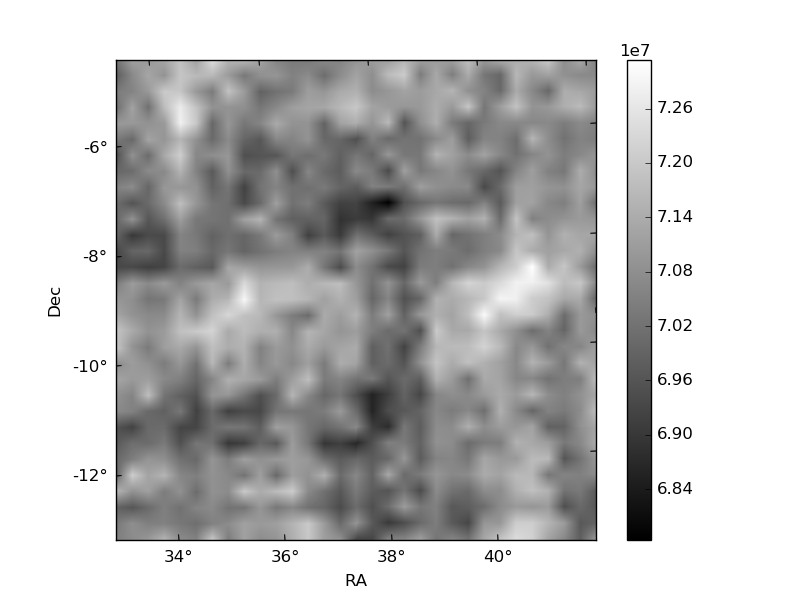
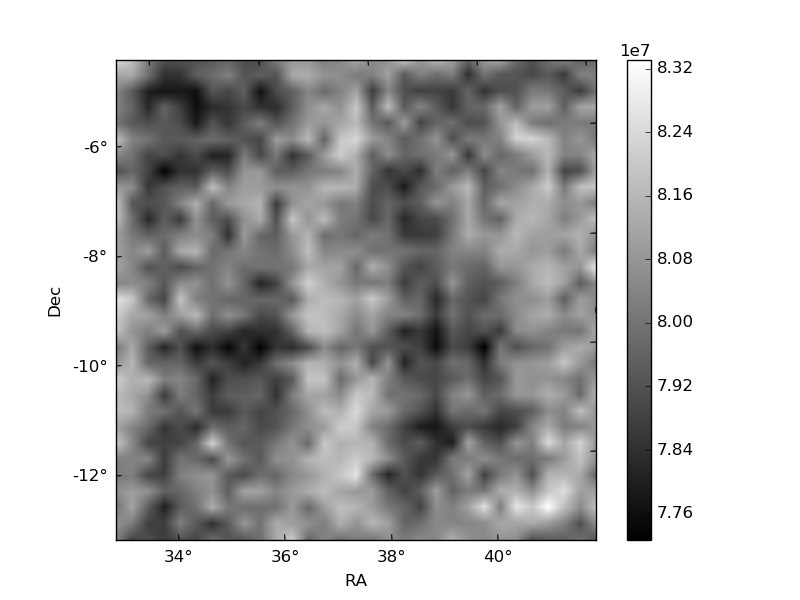
Histogram calculated using DETX and DETY for each event in the final _common_clean file
| Quadrant A | 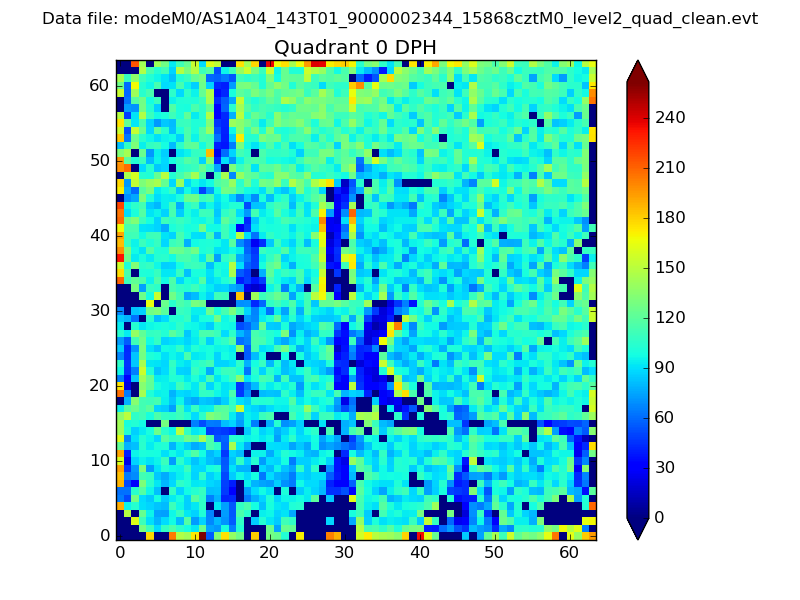 |
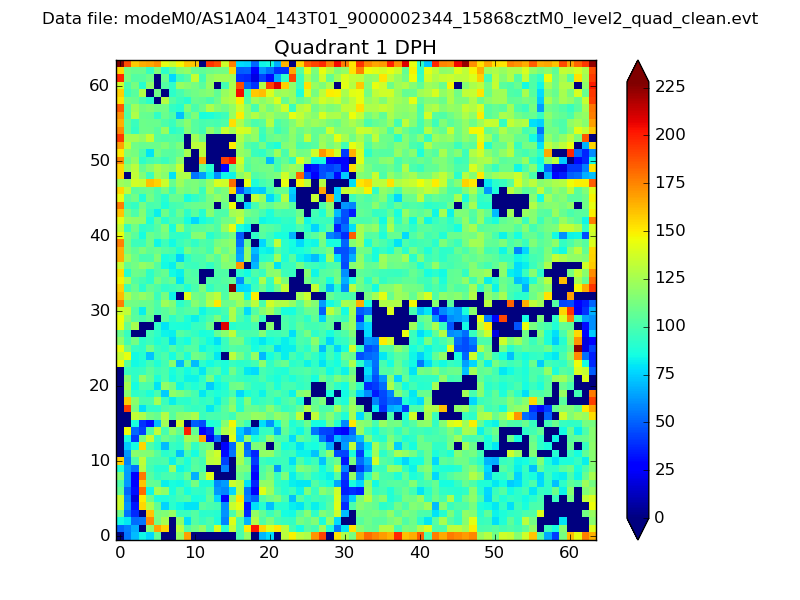 |
Quadrant B |
|---|---|---|---|
| Quadrant D | 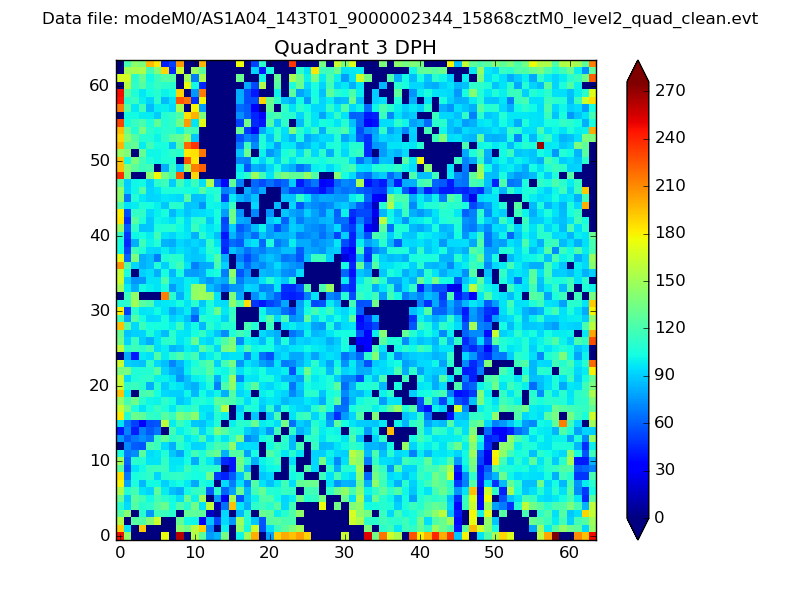 |
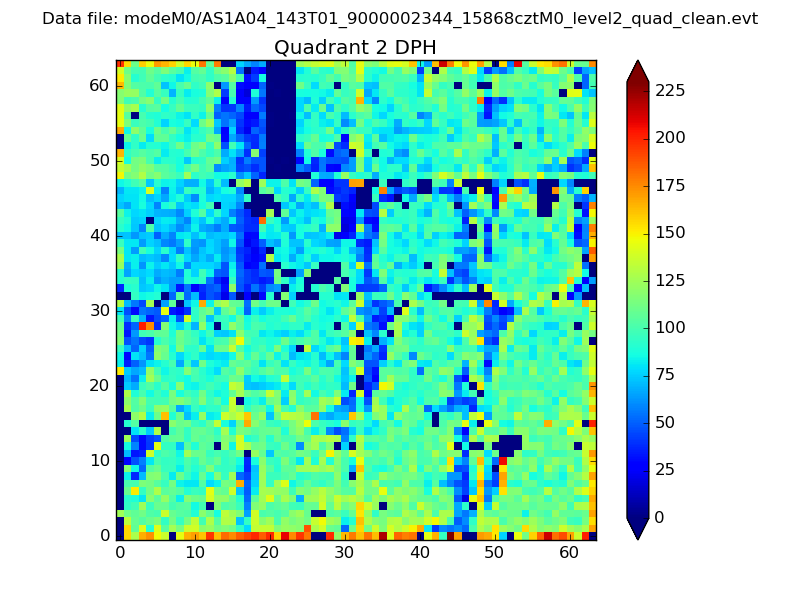 |
Quadrant C |
| Plot type | Count rate plots | Images |
|---|---|---|
| Comparison with Poisson distribution Blue bars denote a histogram of data divided into 1 sec bins. Red curve is a Poisson curve with rate = median count rate of data. |
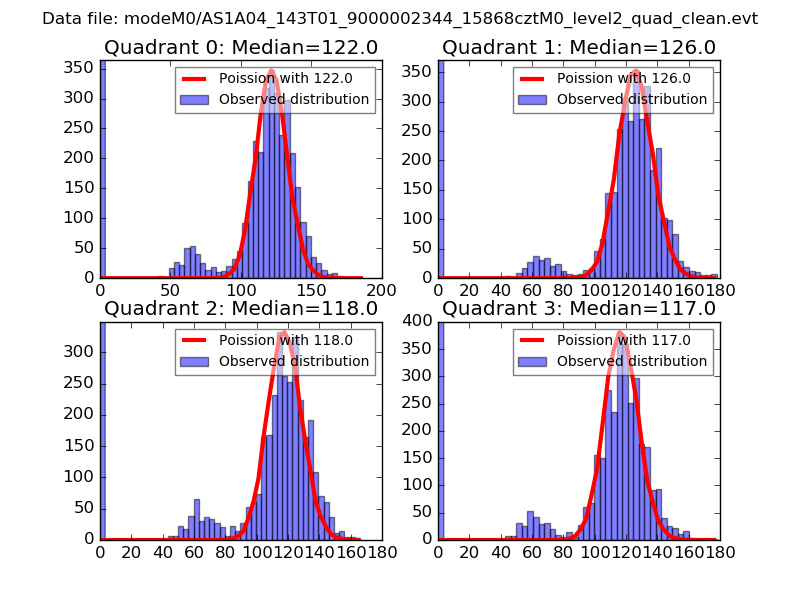 |
 |
| Quadrant-wise count rates Data is divided into 100 sec bins |
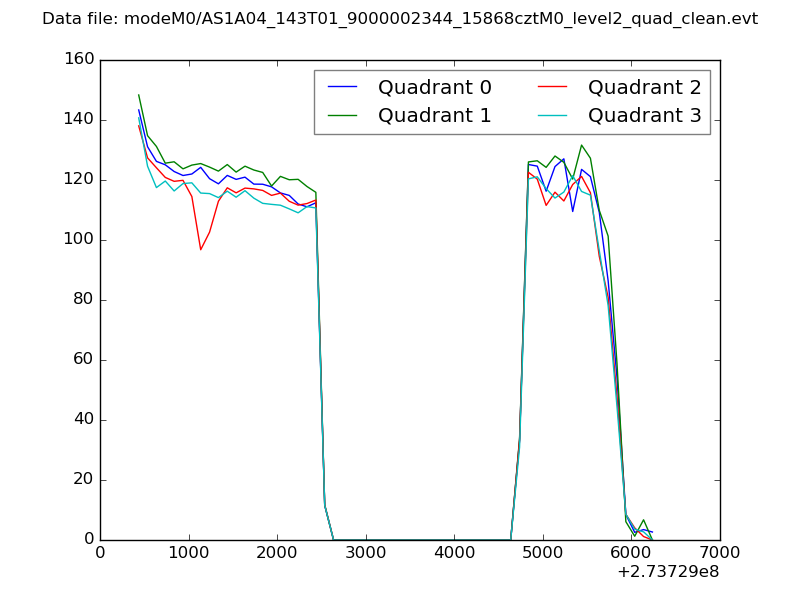 |
|
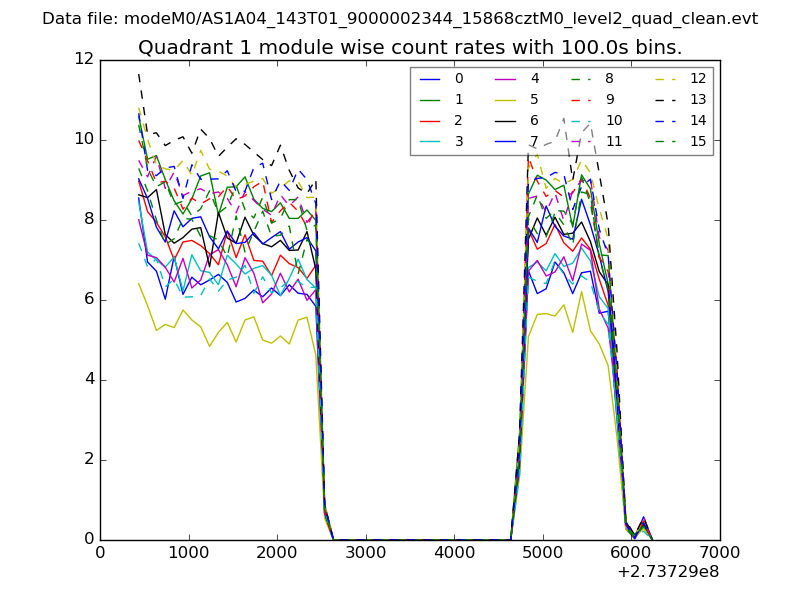
| Module-wise count rates for Quadrant A Data is divided into 100 sec bins |
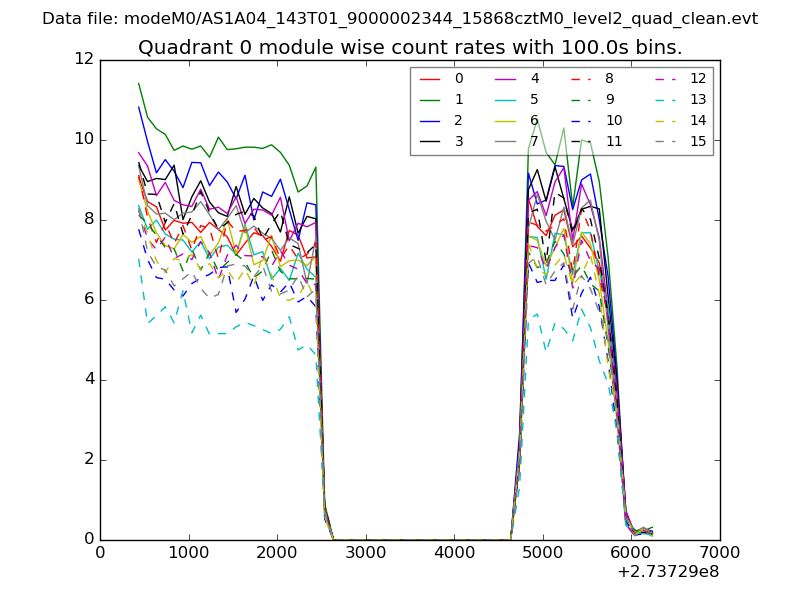 |
 |
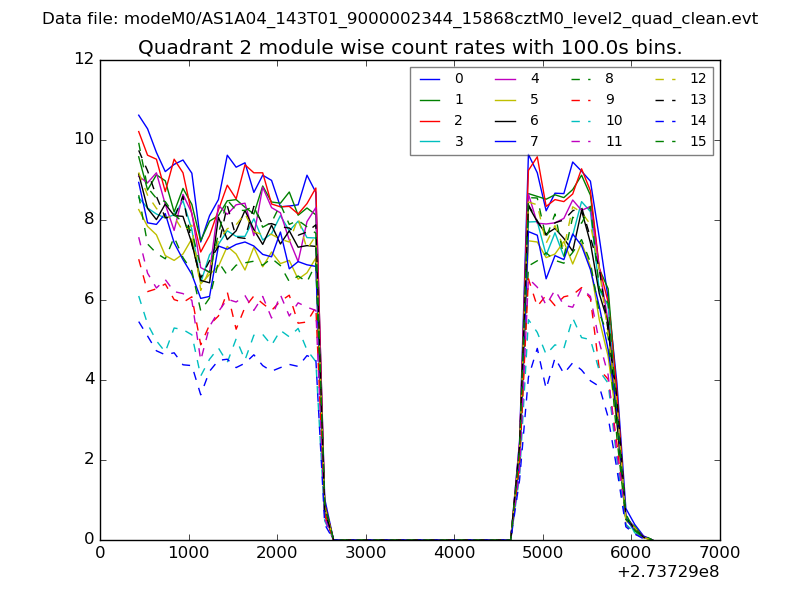
| Module-wise count rates for Quadrant B Data is divided into 100 sec bins |
 |
 |
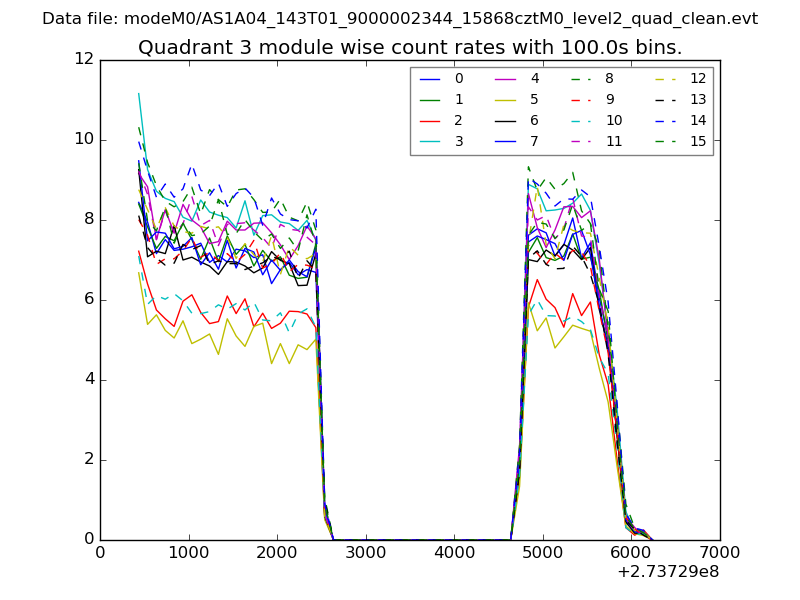
| Module-wise count rates for Quadrant C Data is divided into 100 sec bins |
 |
 |
| Module-wise count rates for Quadrant D Data is divided into 100 sec bins |
 |
 |
| Parameter | Plot |
|---|---|
| CZT HV Monitor | 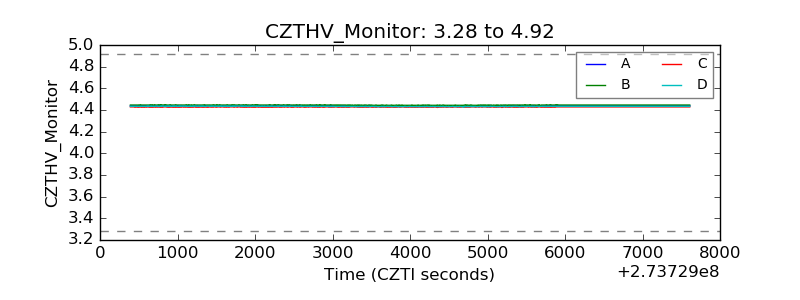 |
| D_VDD | 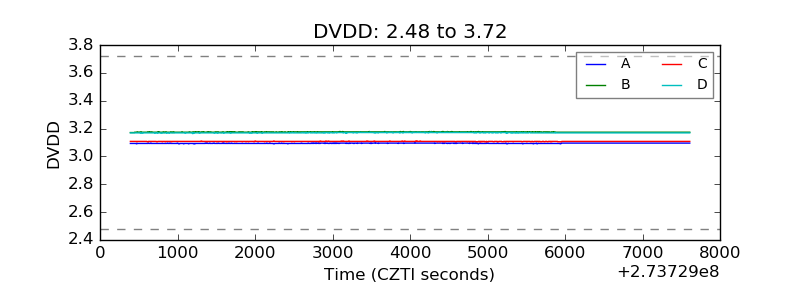 |
| Temperature 1 | 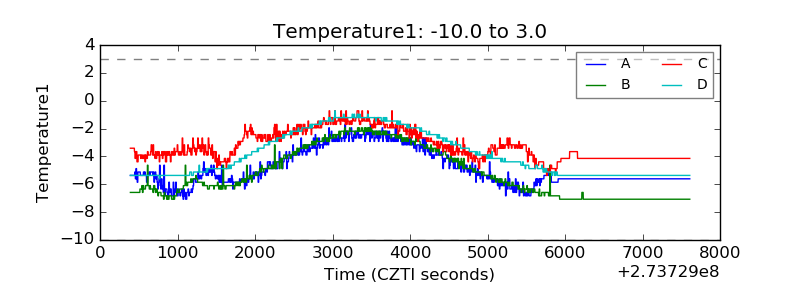 |
| Veto HV Monitor | 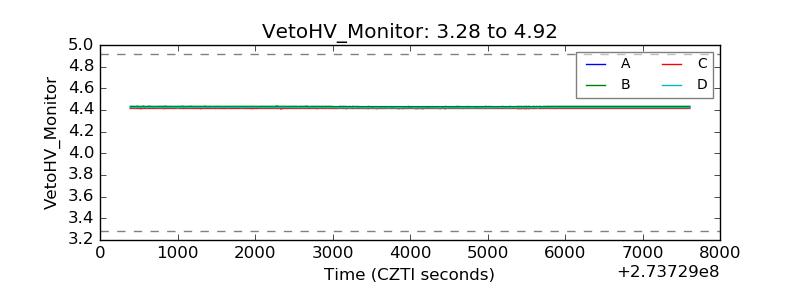 |
| Veto LLD |  |
| Alpha Counter | 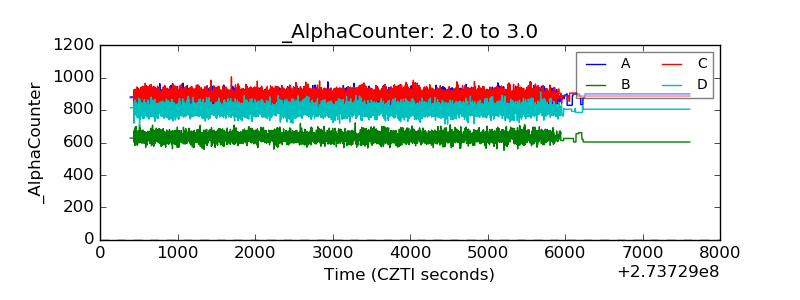 |
| _CPM_Rate | 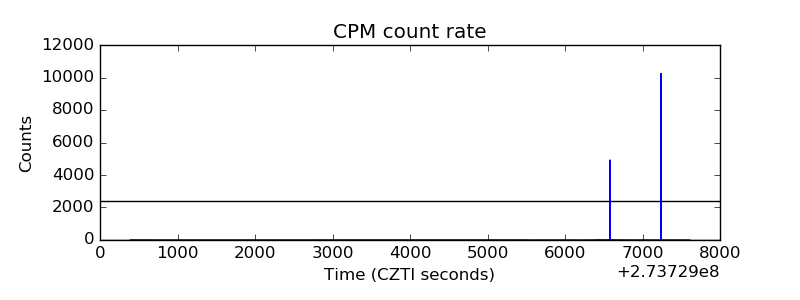 |
| CZT Counter |  |
| +2.5 Volts monitor |  |
| +5 Volts monitor | 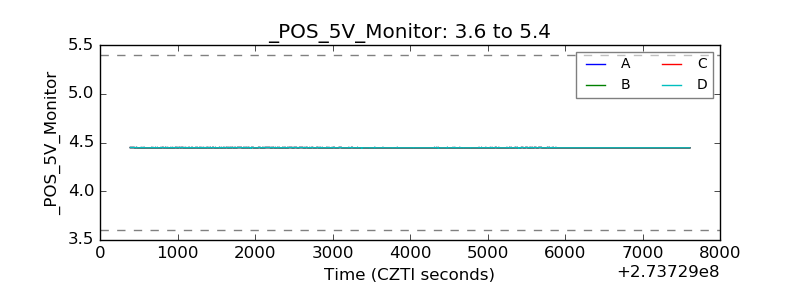 |
| _ROLL_ROT |  |
| _Roll_DEC | 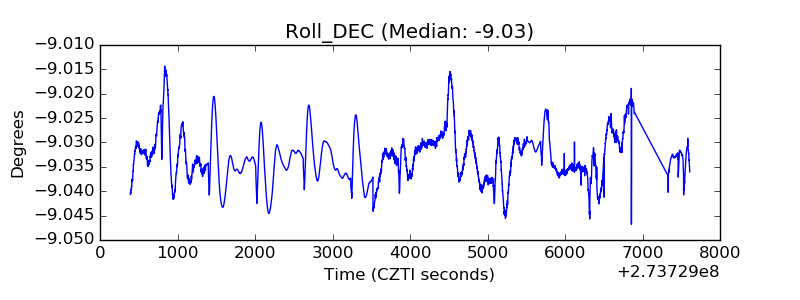 |
| _Roll_RA | 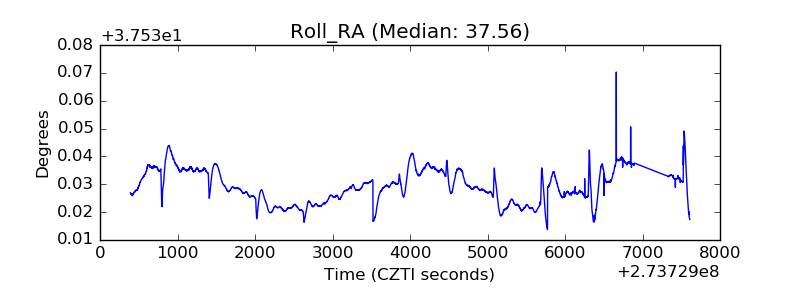 |
| Veto Counter | 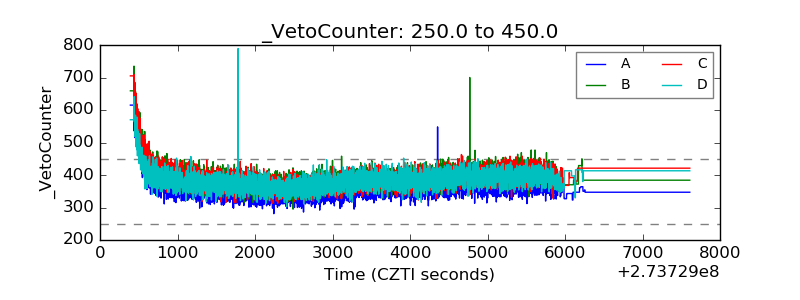 |