| Param | Original file | Final file |
|---|---|---|
| Filename | modeM0/AS1A04_143T01_9000002344_15869cztM0_level2.evt | modeM0/AS1A04_143T01_9000002344_15869cztM0_level2_quad_clean.evt |
| Size (bytes) | 31,512,960 | 9,403,200 |
| Size | 30.1 MB | 9.0 MB |
| Events in quadrant A | 237,926 | 62,024 |
| Events in quadrant B | 224,739 | 62,013 |
| Events in quadrant C | 240,507 | 58,290 |
| Events in quadrant D | 212,383 | 57,921 |
| Mode SS | |||
|---|---|---|---|
| Quadrant | BADHDUFLAG | Total packets | Discarded packets |
| A | 0 | 61 | 49 |
| B | 0 | 62 | 52 |
| C | 0 | 61 | 49 |
| D | 0 | 63 | 57 |
| Mode M0 | |||
|---|---|---|---|
| Quadrant | BADHDUFLAG | Total packets | Discarded packets |
| A | 0 | 6686 | 5620 |
| B | 0 | 6455 | 5431 |
| C | 0 | 6475 | 5435 |
| D | 0 | 6228 | 5214 |
| Mode M9 | |||
|---|---|---|---|
| Quadrant | BADHDUFLAG | Total packets | Discarded packets |
| A | 0 | 1 | 1 |
| B | 1 | 1 | 1 |
| C | 1 | -1 | -1 |
| D | 1 | -1 | -1 |
| Quadrant | Total seconds | Saturated seconds | Saturation percentage |
|---|---|---|---|
| A | 525 | 0 | 0.000000% |
| B | 512 | 0 | 0.000000% |
| C | 506 | 2 | 0.395257% |
| D | 506 | 0 | 0.000000% |
Noise dominated data is calculated using 1-second bins in cleaned event files. If a bin has >2000 counts, and if more than 50% of those come from <1% of pixels, then it is considered to be noise-dominated and hence unusable.
| Quadrant | # 1 sec bins | Bins with >0 counts | Bins with >2000 counts | High rate bins dominated by noise | Noise dominated (total time) | Noise dominated (detector-on time) | Marked lightcurve |
|---|---|---|---|---|---|---|---|
| A | 1186 | 711 | 0 | 0 | 0.00% | 0.00% | 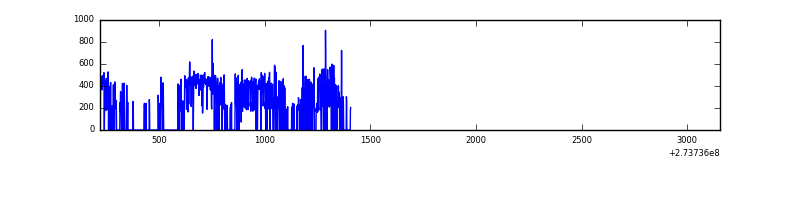 |
| B | 1144 | 705 | 0 | 0 | 0.00% | 0.00% | 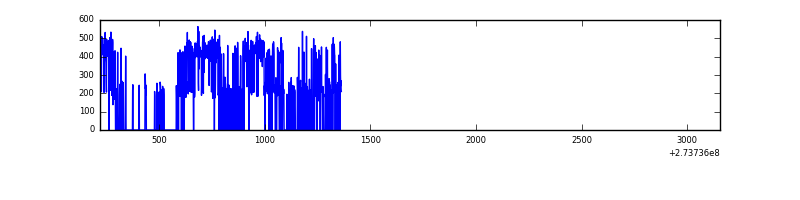 |
| C | 1934 | 687 | 0 | 0 | 0.00% | 0.00% | 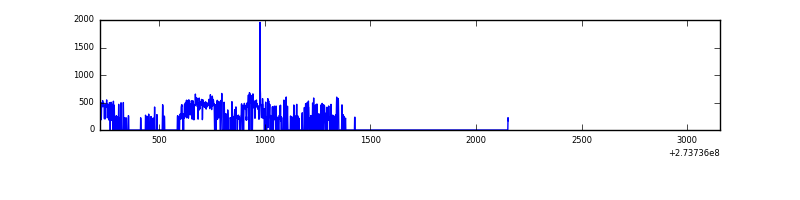 |
| D | 2936 | 704 | 0 | 0 | 0.00% | 0.00% | 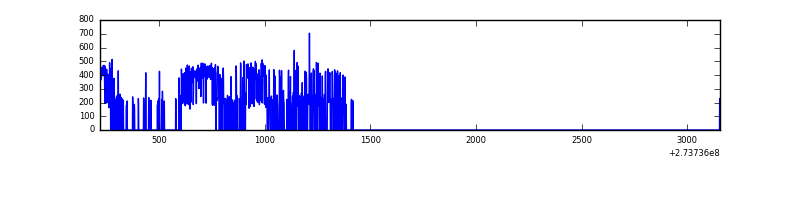 |
Top three noisy pixels from each quadrant. If the there are fewer than three noisy pixels in the level2.evt file, extra rows are filled as -1
| Pixel properties | Quadrant properties | ||||||
|---|---|---|---|---|---|---|---|
| Quadrant | DetID | PixID | Counts | Sigma | Mean | Median | Sigma |
| A | 15 | 239 | 10702 | 755.63 | 58 | 57 | 14.1 |
| A | 9 | 143 | 1354 | 92.07 | 58 | 57 | 14.1 |
| A | 0 | 226 | 497 | 31.23 | 58 | 57 | 14.1 |
| B | 12 | 111 | 1334 | 94.63 | 57 | 56 | 13.5 |
| B | 11 | 111 | 1121 | 78.86 | 57 | 56 | 13.5 |
| B | 14 | 111 | 1018 | 71.23 | 57 | 56 | 13.5 |
| C | 14 | 238 | 8322 | 560.48 | 54 | 55 | 14.7 |
| C | 10 | 22 | 5835 | 391.87 | 54 | 55 | 14.7 |
| C | 0 | 207 | 4763 | 319.19 | 54 | 55 | 14.7 |
| D | 2 | 234 | 2032 | 126.79 | 55 | 53 | 15.6 |
| D | 1 | 52 | 1531 | 94.69 | 55 | 53 | 15.6 |
| D | 12 | 110 | 827 | 49.59 | 55 | 53 | 15.6 |
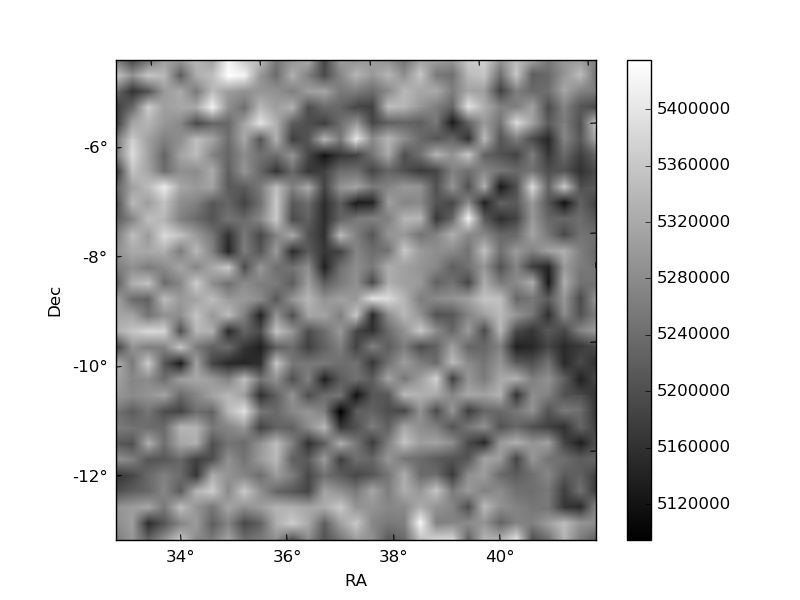
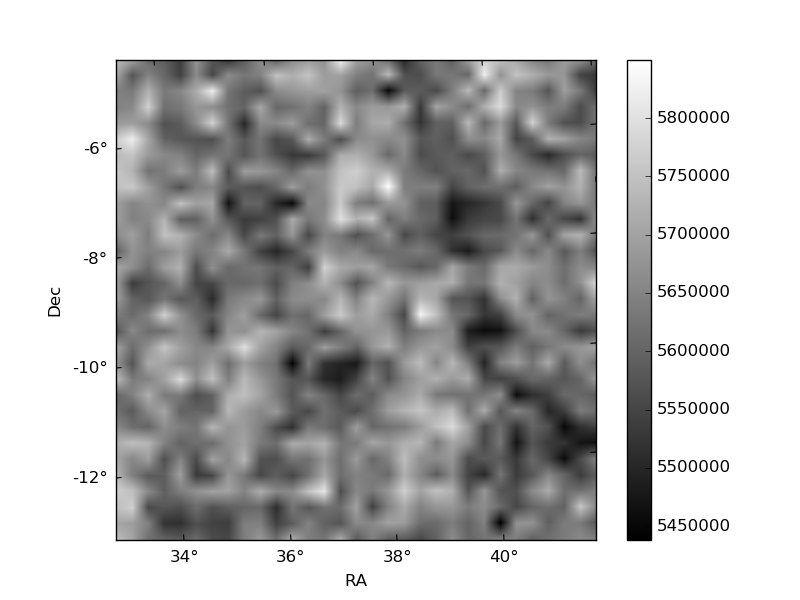
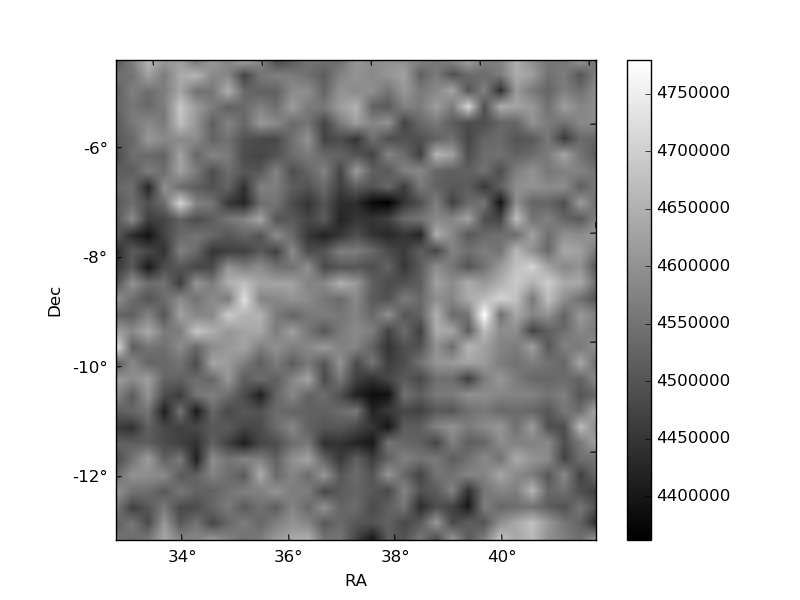
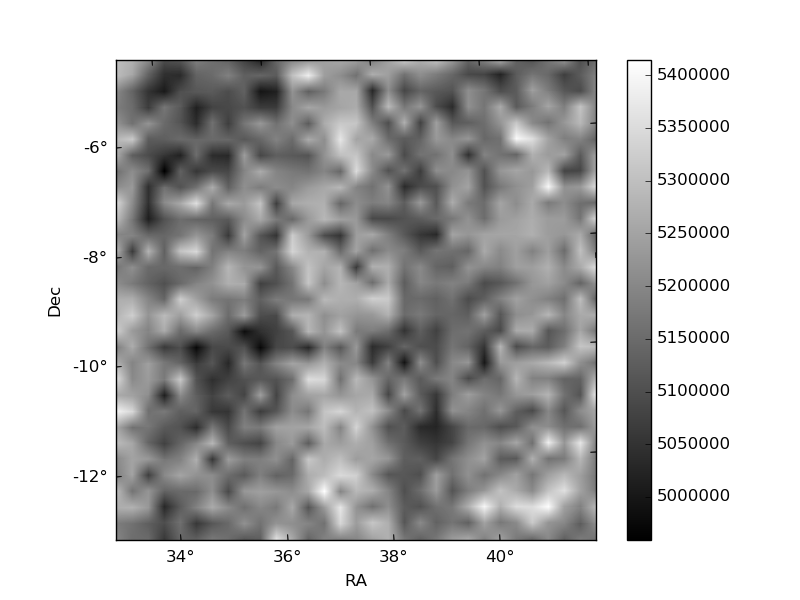
Histogram calculated using DETX and DETY for each event in the final _common_clean file
| Quadrant A |  |
 |
Quadrant B |
|---|---|---|---|
| Quadrant D |  |
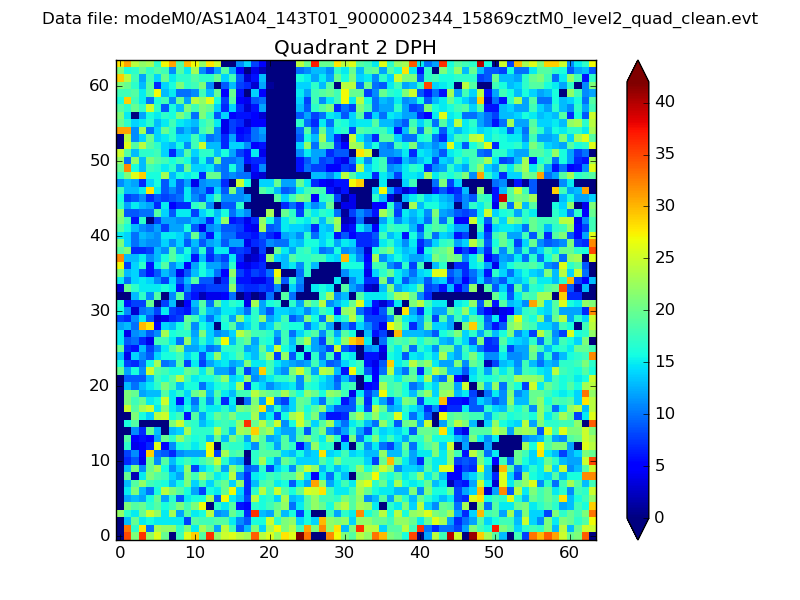 |
Quadrant C |
| Plot type | Count rate plots | Images |
|---|---|---|
| Comparison with Poisson distribution Blue bars denote a histogram of data divided into 1 sec bins. Red curve is a Poisson curve with rate = median count rate of data. |
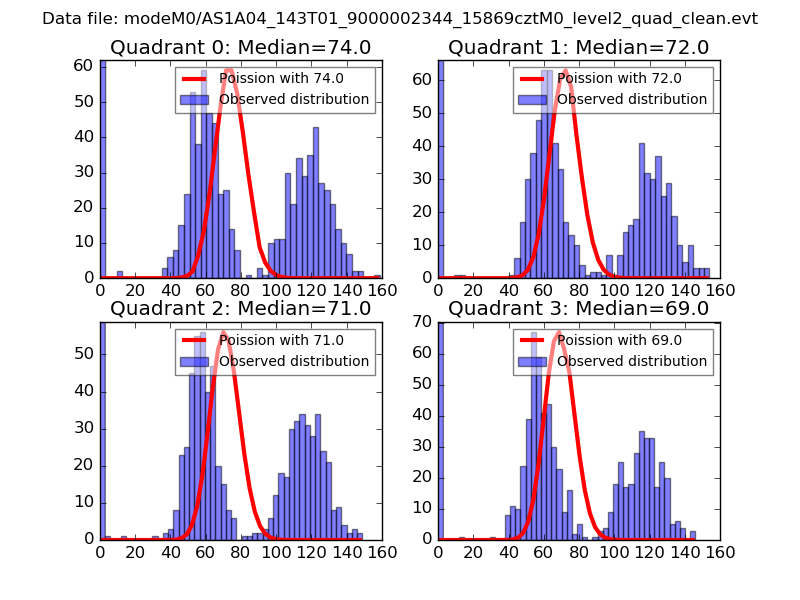 |
 |
| Quadrant-wise count rates Data is divided into 100 sec bins |
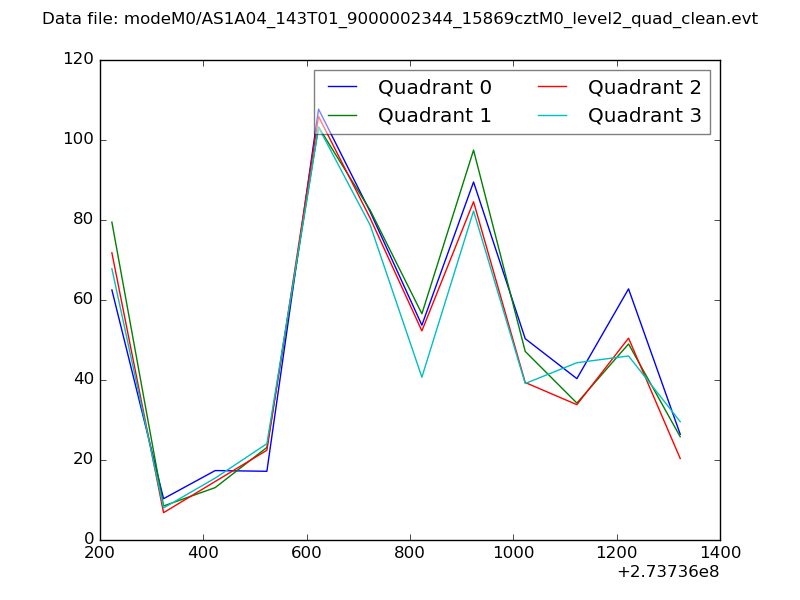 |
|
| Module-wise count rates for Quadrant A Data is divided into 100 sec bins |
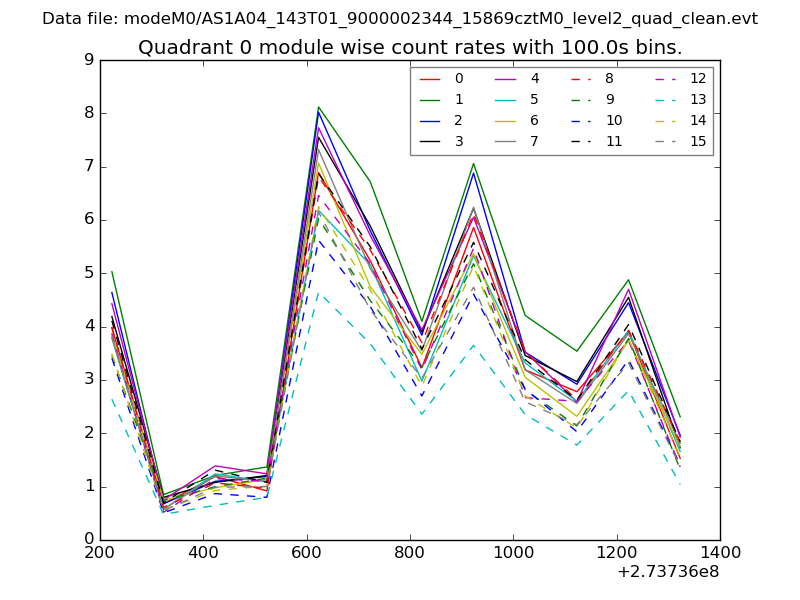 |
 |
| Module-wise count rates for Quadrant B Data is divided into 100 sec bins |
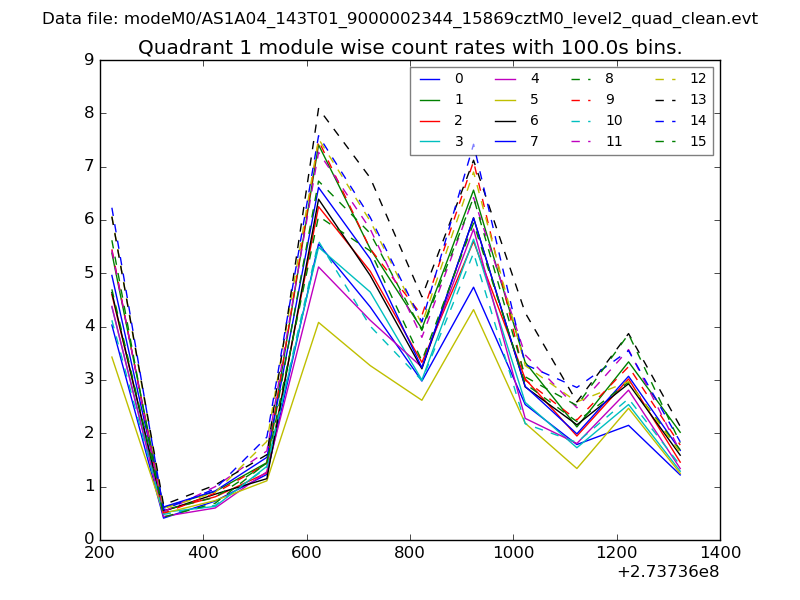 |
 |
| Module-wise count rates for Quadrant C Data is divided into 100 sec bins |
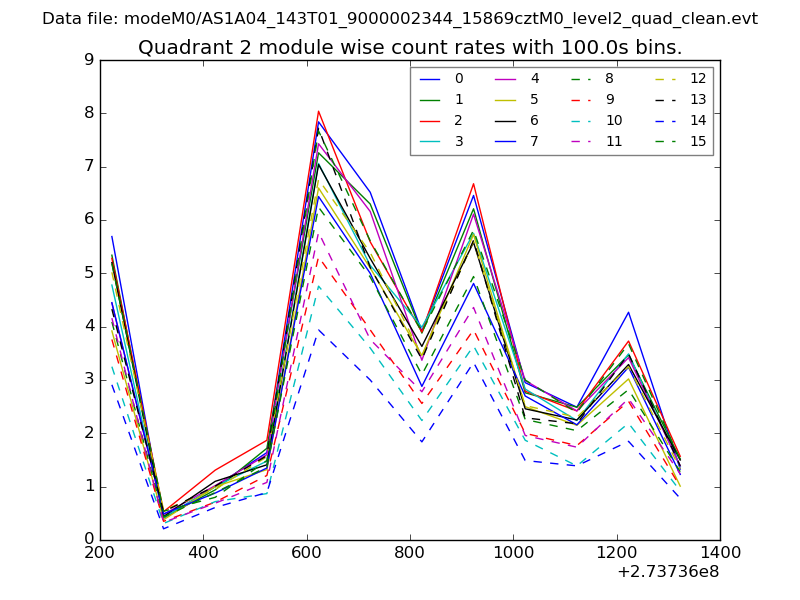 |
 |
| Module-wise count rates for Quadrant D Data is divided into 100 sec bins |
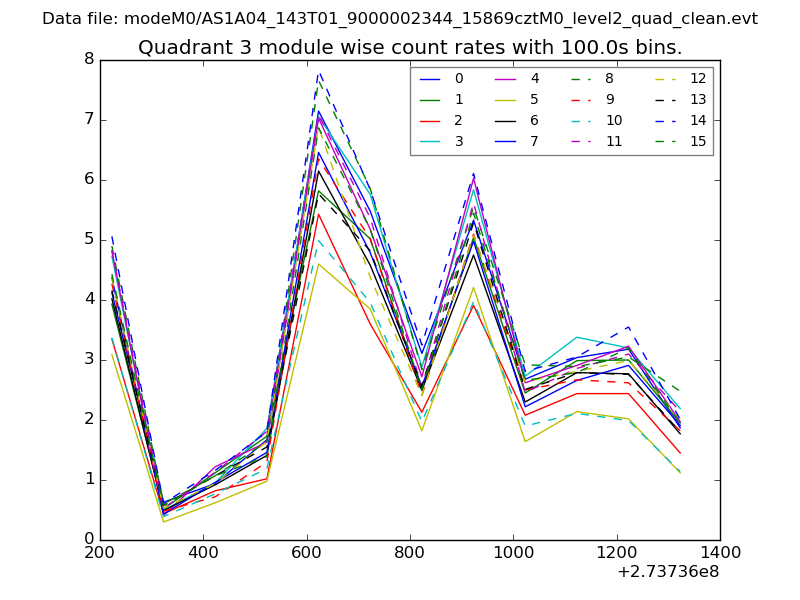 |
 |
| Parameter | Plot |
|---|---|
| CZT HV Monitor | 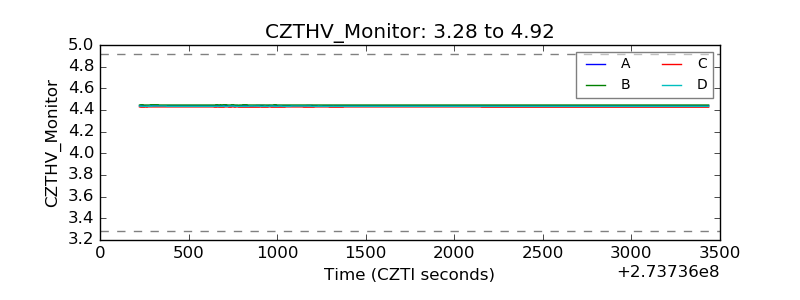 |
| D_VDD |  |
| Temperature 1 | 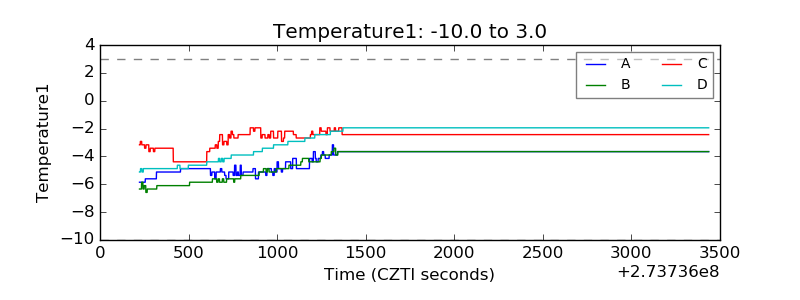 |
| Veto HV Monitor | 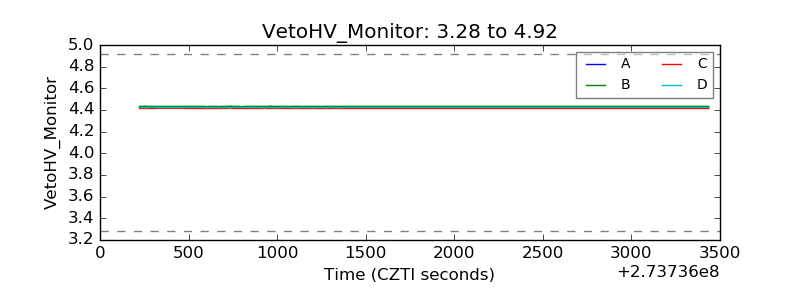 |
| Veto LLD | 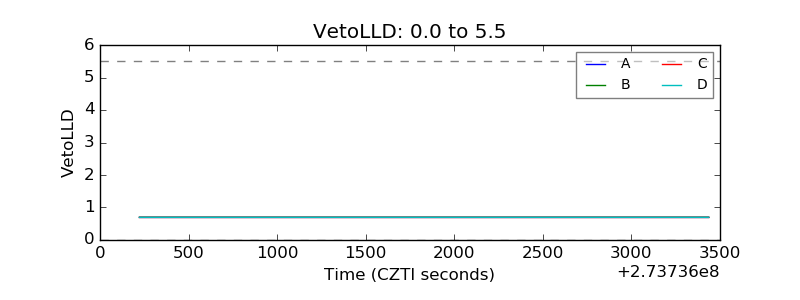 |
| Alpha Counter | 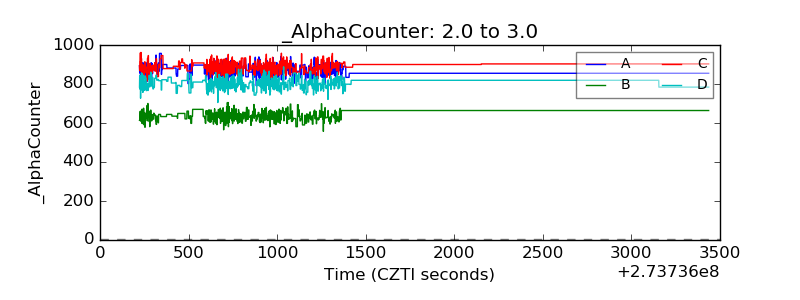 |
| _CPM_Rate | 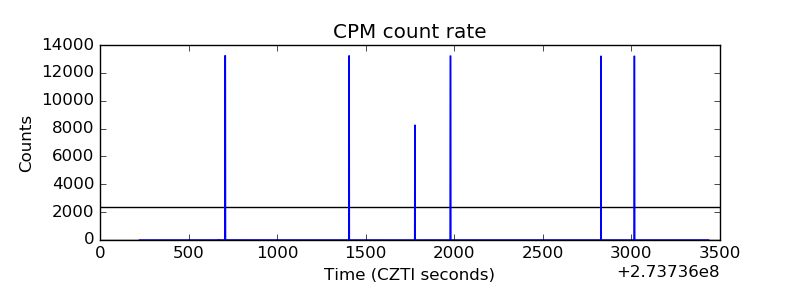 |
| CZT Counter | 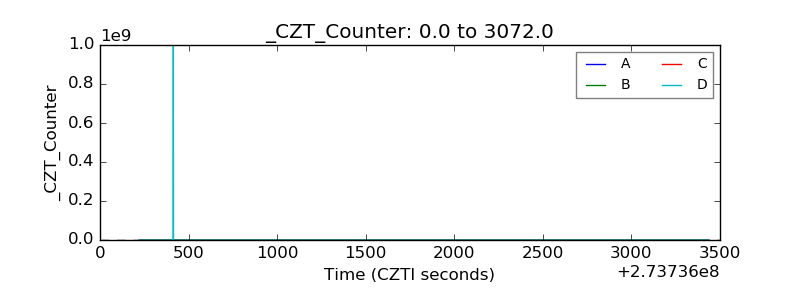 |
| +2.5 Volts monitor |  |
| +5 Volts monitor | 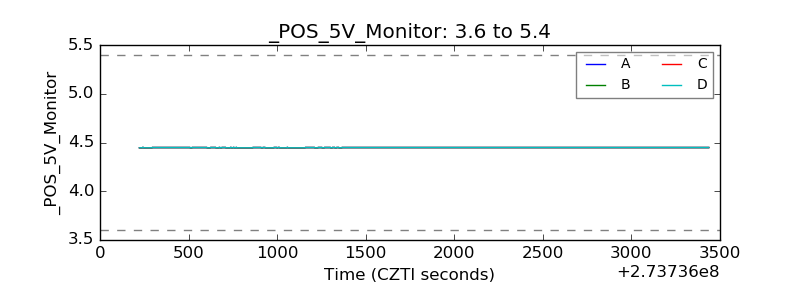 |
| _ROLL_ROT | 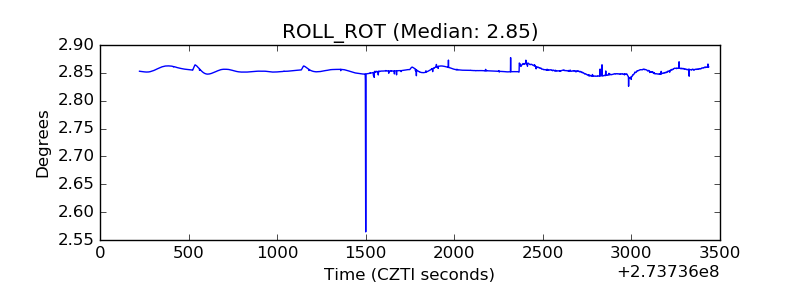 |
| _Roll_DEC | 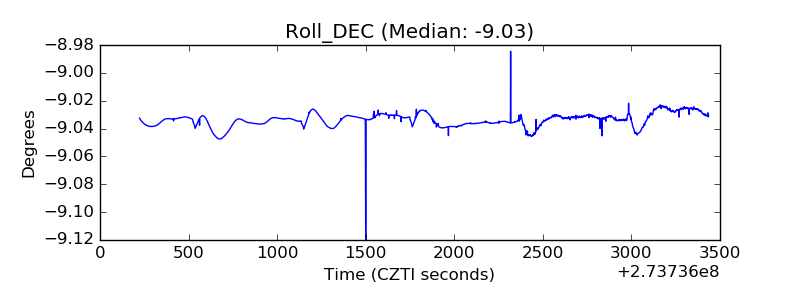 |
| _Roll_RA | 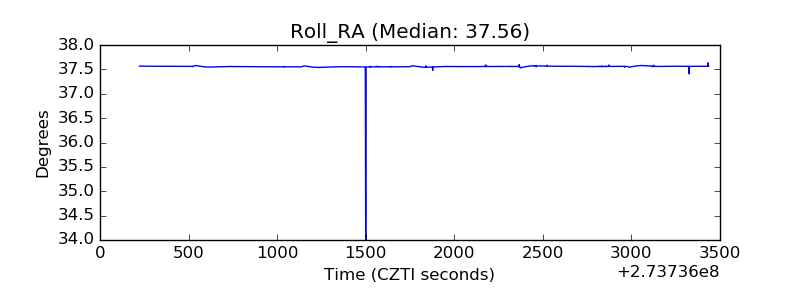 |
| Veto Counter | 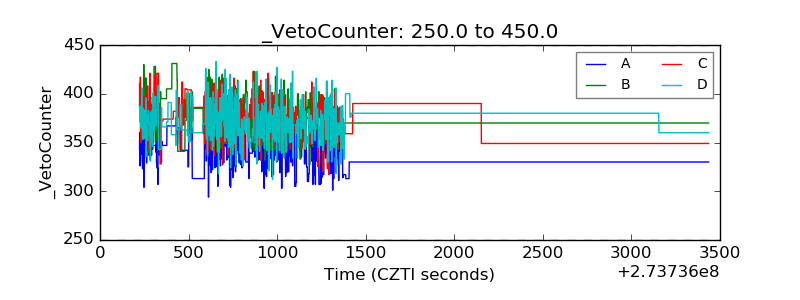 |