| Param | Original file | Final file |
|---|---|---|
| Filename | modeM0/AS1A04_143T01_9000002344_15872cztM0_level2.evt | modeM0/AS1A04_143T01_9000002344_15872cztM0_level2_quad_clean.evt |
| Size (bytes) | 1,249,992,000 | 197,282,880 |
| Size | 1.2 GB | 188.1 MB |
| Events in quadrant A | 9,648,898 | 1,194,882 |
| Events in quadrant B | 9,272,369 | 1,219,901 |
| Events in quadrant C | 8,837,649 | 1,162,795 |
| Events in quadrant D | 8,877,620 | 1,153,874 |
| Mode SS | |||
|---|---|---|---|
| Quadrant | BADHDUFLAG | Total packets | Discarded packets |
| A | 0 | 368 | 0 |
| B | 0 | 368 | 0 |
| C | 0 | 368 | 0 |
| D | 0 | 368 | 0 |
| Mode M0 | |||
|---|---|---|---|
| Quadrant | BADHDUFLAG | Total packets | Discarded packets |
| A | 0 | 40168 | 4 |
| B | 0 | 38780 | 3 |
| C | 0 | 37361 | 3 |
| D | 0 | 38200 | 3 |
| Mode M9 | |||
|---|---|---|---|
| Quadrant | BADHDUFLAG | Total packets | Discarded packets |
| A | 0 | 18 | 0 |
| B | 0 | 18 | 0 |
| C | 0 | 18 | 0 |
| D | 0 | 18 | 0 |
| Quadrant | Total seconds | Saturated seconds | Saturation percentage |
|---|---|---|---|
| A | 18034 | 374 | 2.073860% |
| B | 18034 | 265 | 1.469447% |
| C | 18034 | 271 | 1.502717% |
| D | 18034 | 180 | 0.998115% |
Noise dominated data is calculated using 1-second bins in cleaned event files. If a bin has >2000 counts, and if more than 50% of those come from <1% of pixels, then it is considered to be noise-dominated and hence unusable.
| Quadrant | # 1 sec bins | Bins with >0 counts | Bins with >2000 counts | High rate bins dominated by noise | Noise dominated (total time) | Noise dominated (detector-on time) | Marked lightcurve |
|---|---|---|---|---|---|---|---|
| A | 19905 | 18035 | 110 | 110 | 0.55% | 0.61% | 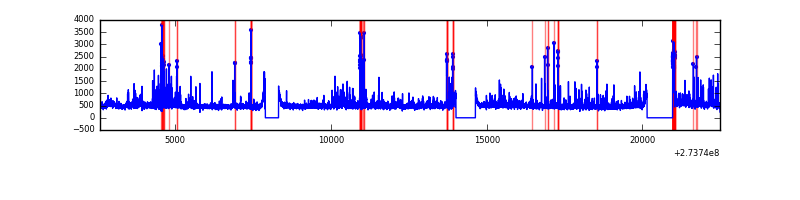 |
| B | 19905 | 18036 | 20 | 20 | 0.10% | 0.11% | 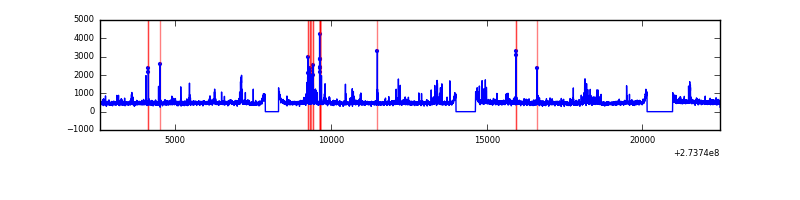 |
| C | 19905 | 18037 | 2 | 2 | 0.01% | 0.01% | 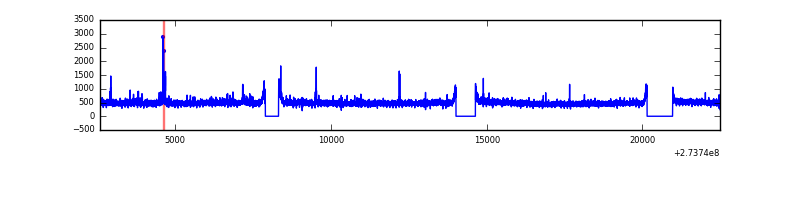 |
| D | 19905 | 18036 | 9 | 9 | 0.05% | 0.05% |  |
Top three noisy pixels from each quadrant. If the there are fewer than three noisy pixels in the level2.evt file, extra rows are filled as -1
| Pixel properties | Quadrant properties | ||||||
|---|---|---|---|---|---|---|---|
| Quadrant | DetID | PixID | Counts | Sigma | Mean | Median | Sigma |
| A | 15 | 239 | 1339879 | 3078.69 | 2154 | 2103 | 434.5 |
| A | 0 | 226 | 19304 | 39.58 | 2154 | 2103 | 434.5 |
| A | 9 | 143 | 18572 | 37.9 | 2154 | 2103 | 434.5 |
| B | 3 | 64 | 308080 | 737.54 | 2165 | 2109 | 414.9 |
| B | 4 | 173 | 161857 | 385.07 | 2165 | 2109 | 414.9 |
| B | 5 | 65 | 73733 | 172.65 | 2165 | 2109 | 414.9 |
| C | 14 | 238 | 317254 | 644.62 | 2085 | 2098 | 488.9 |
| C | 3 | 233 | 133391 | 268.55 | 2085 | 2098 | 488.9 |
| C | 0 | 207 | 115183 | 231.3 | 2085 | 2098 | 488.9 |
| D | 1 | 52 | 511431 | 914.89 | 2107 | 2056 | 556.8 |
| D | 12 | 110 | 124466 | 219.86 | 2107 | 2056 | 556.8 |
| D | 2 | 234 | 79726 | 139.5 | 2107 | 2056 | 556.8 |
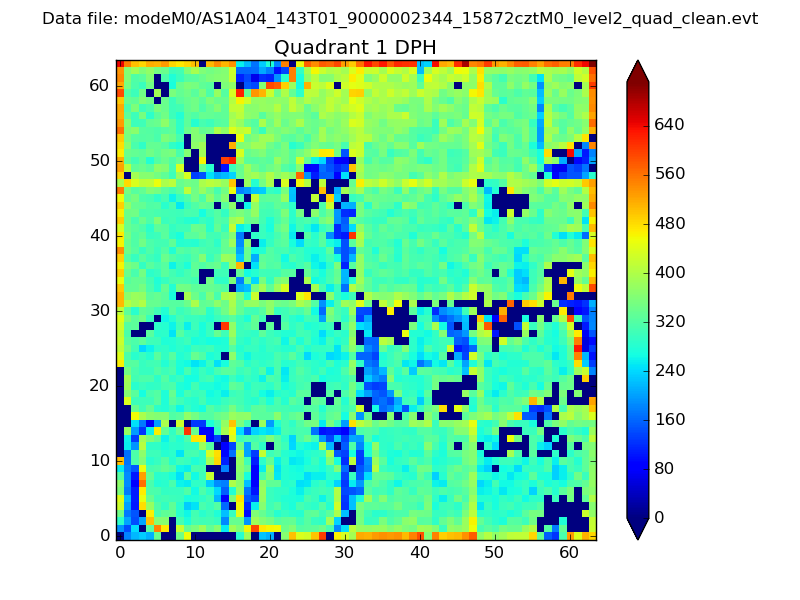
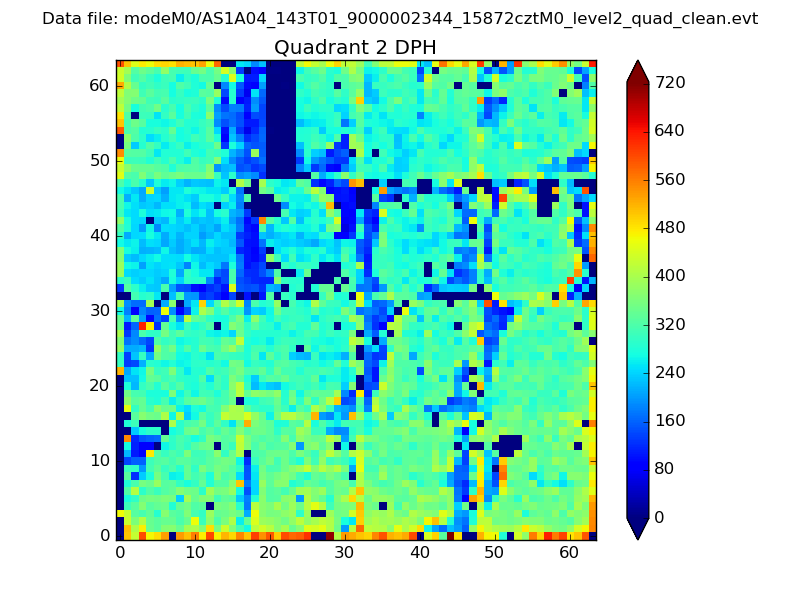
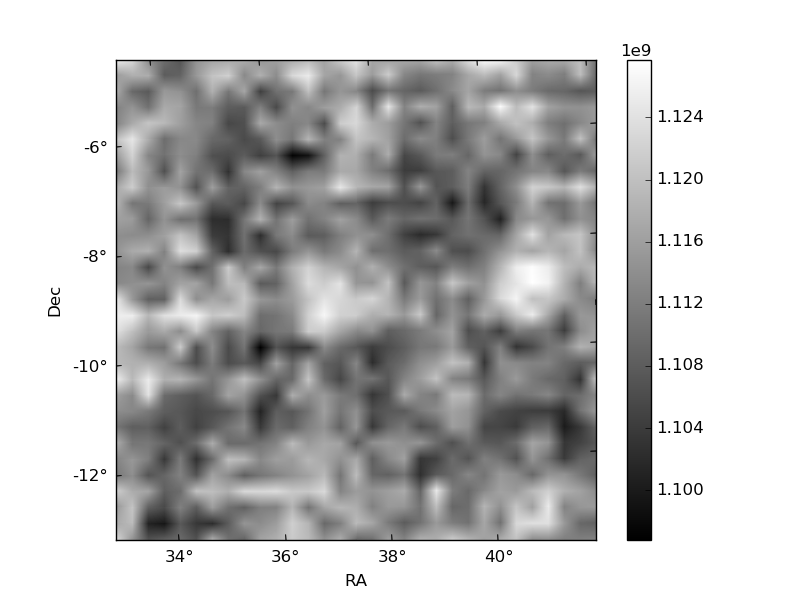
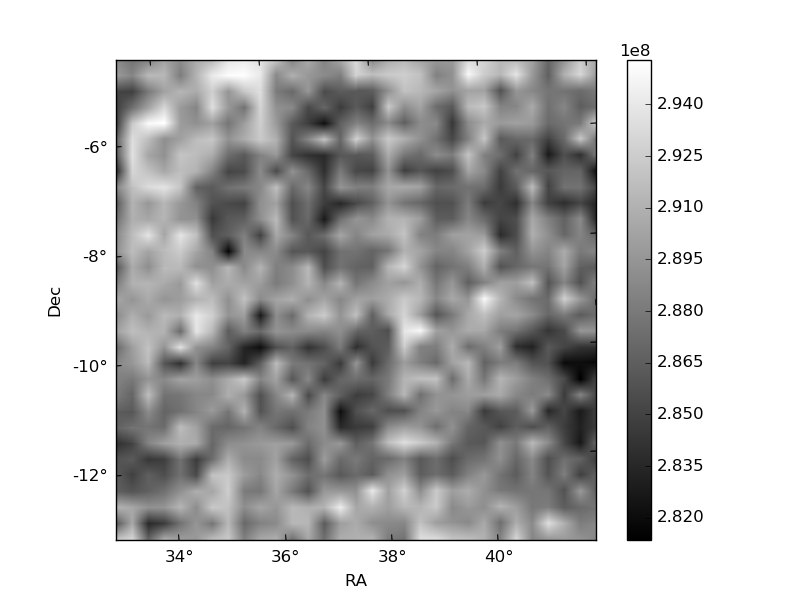
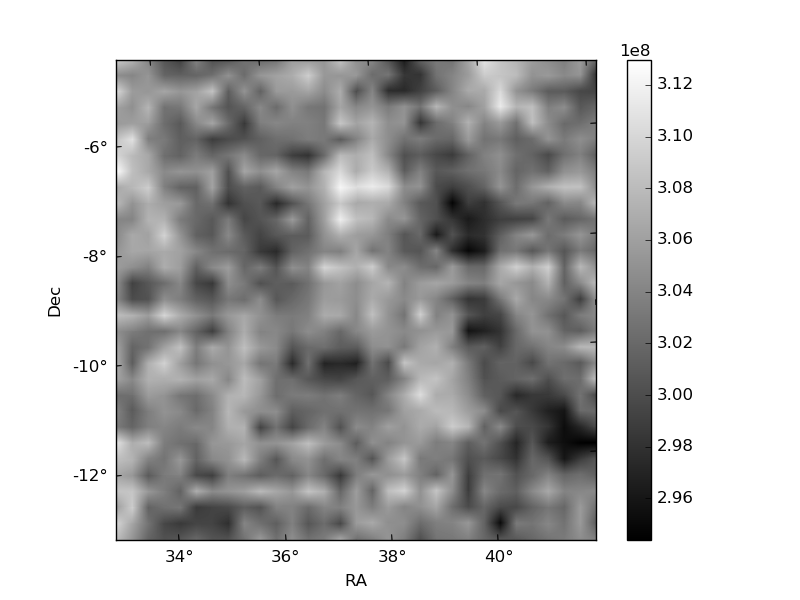
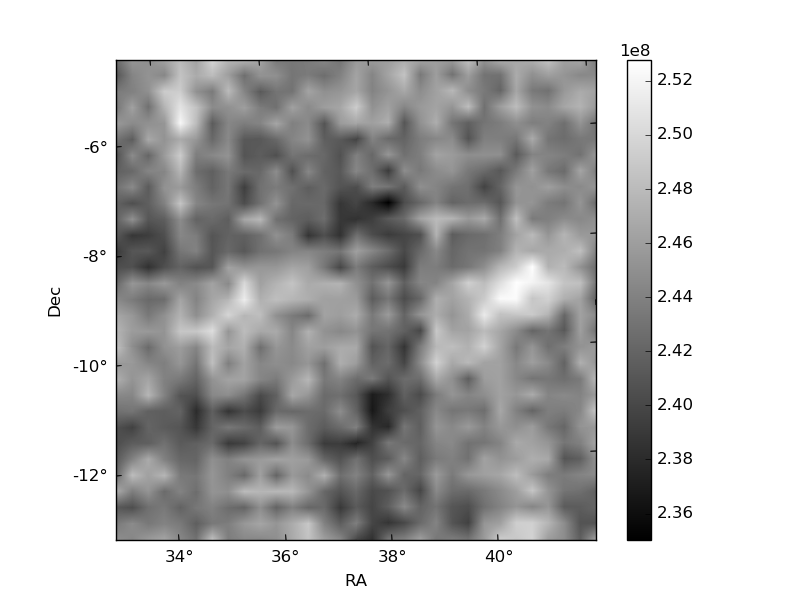
Histogram calculated using DETX and DETY for each event in the final _common_clean file
| Quadrant A | 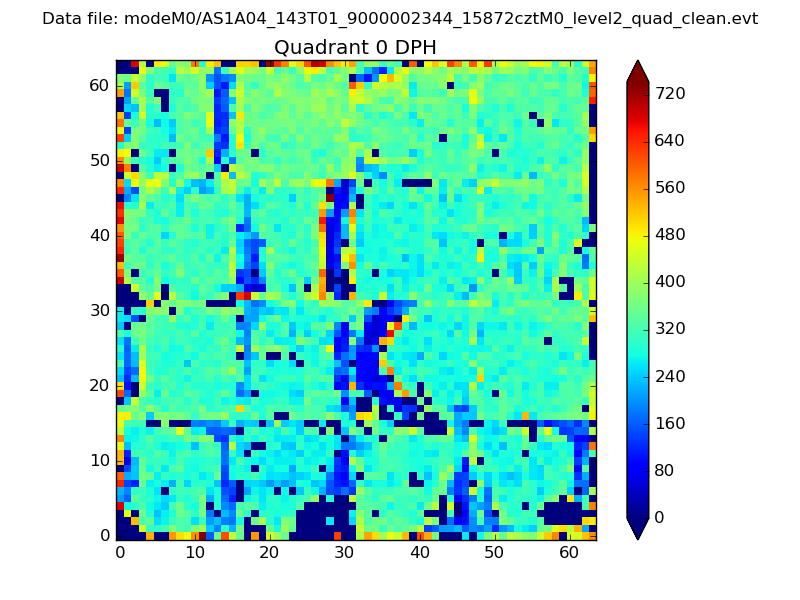 |
 |
Quadrant B |
|---|---|---|---|
| Quadrant D | 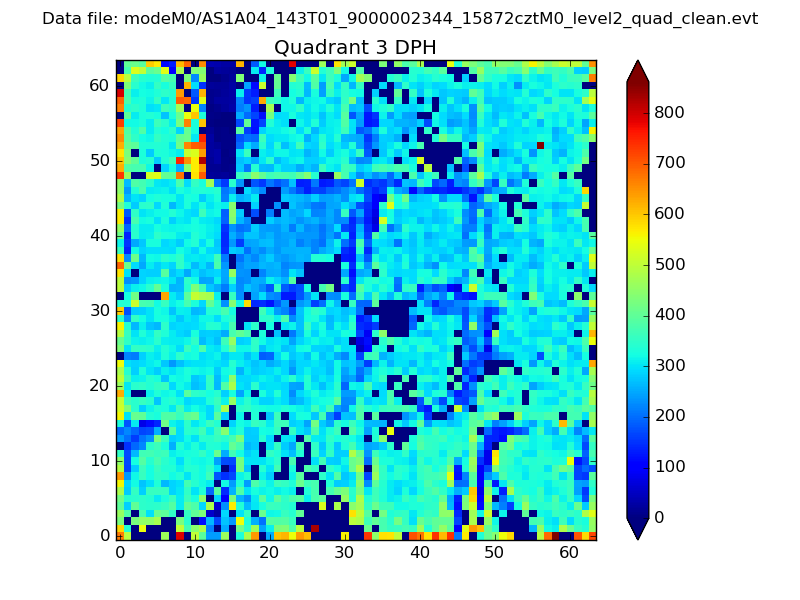 |
 |
Quadrant C |
| Plot type | Count rate plots | Images |
|---|---|---|
| Comparison with Poisson distribution Blue bars denote a histogram of data divided into 1 sec bins. Red curve is a Poisson curve with rate = median count rate of data. |
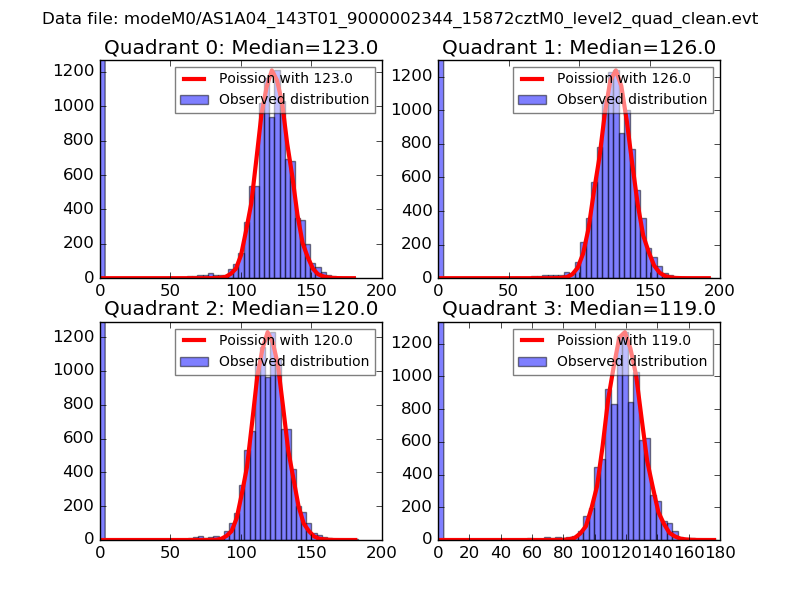 |
 |
| Quadrant-wise count rates Data is divided into 100 sec bins |
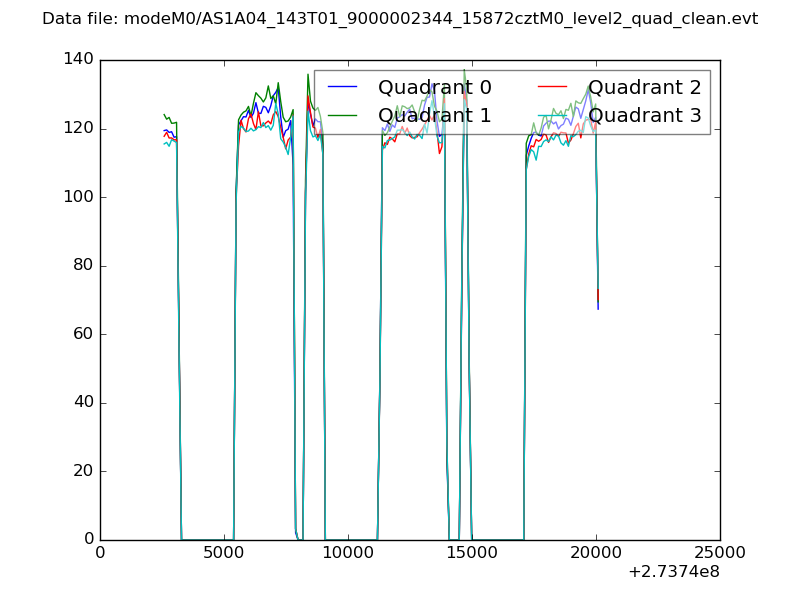 |
|
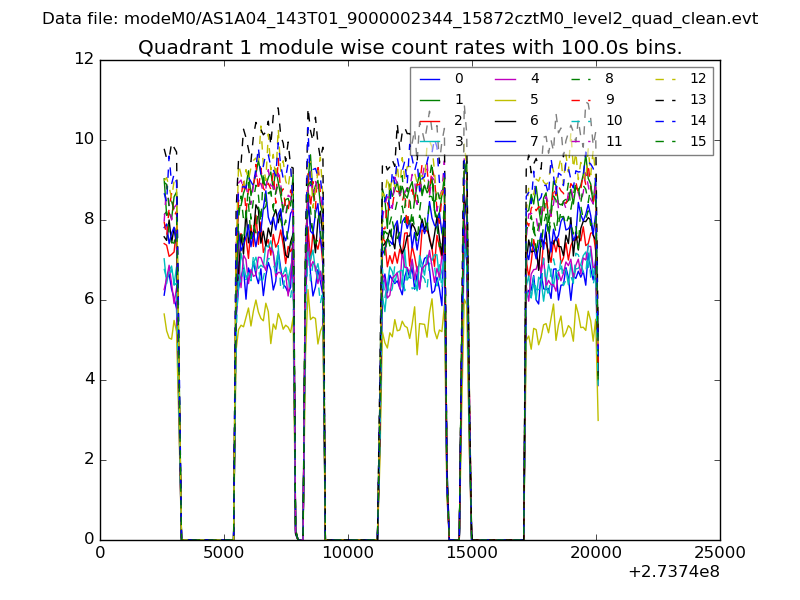
| Module-wise count rates for Quadrant A Data is divided into 100 sec bins |
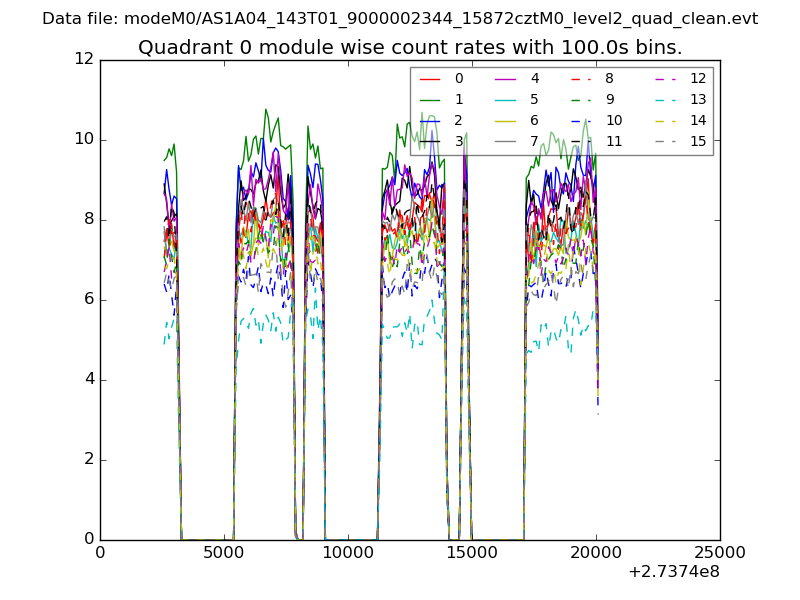 |
 |
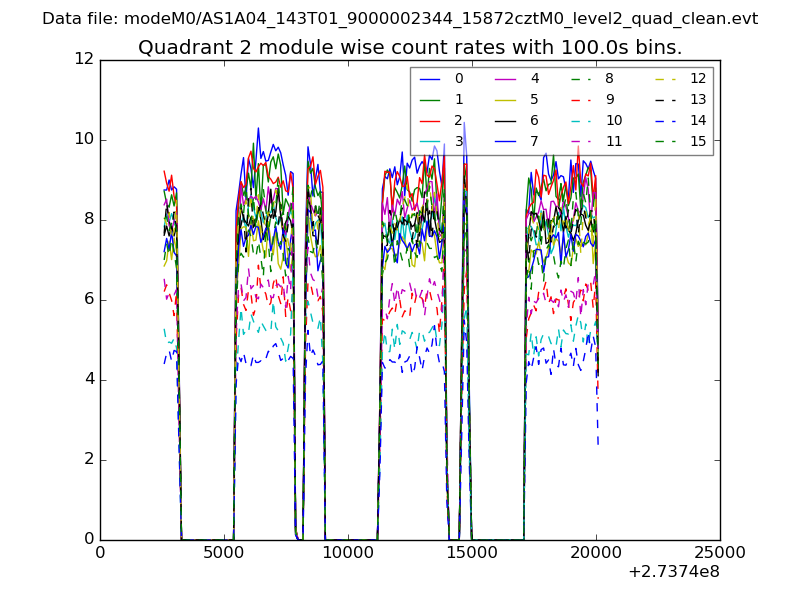
| Module-wise count rates for Quadrant B Data is divided into 100 sec bins |
 |
 |
| Module-wise count rates for Quadrant C Data is divided into 100 sec bins |
 |
 |
| Module-wise count rates for Quadrant D Data is divided into 100 sec bins |
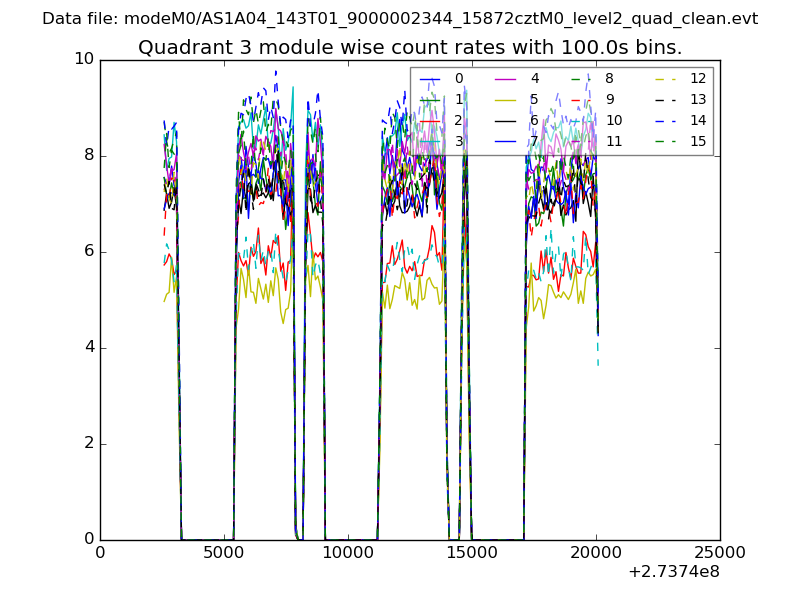 |
 |
| Parameter | Plot |
|---|---|
| CZT HV Monitor | 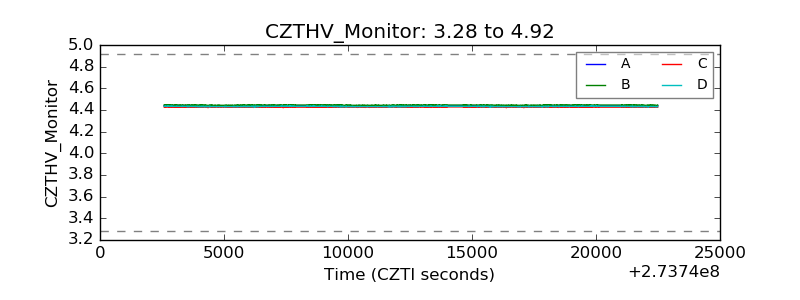 |
| D_VDD |  |
| Temperature 1 | 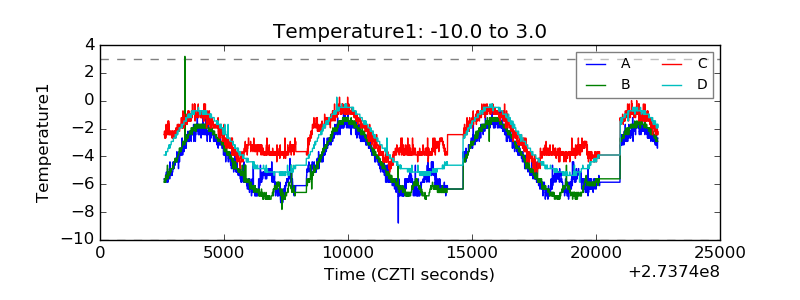 |
| Veto HV Monitor |  |
| Veto LLD | 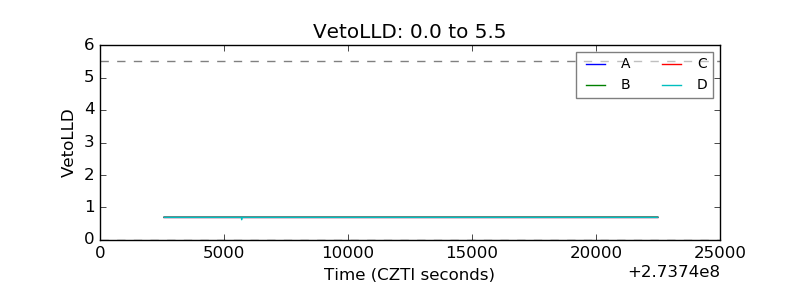 |
| Alpha Counter | 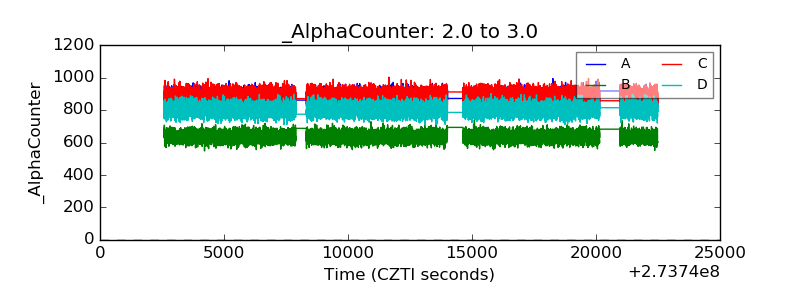 |
| _CPM_Rate | 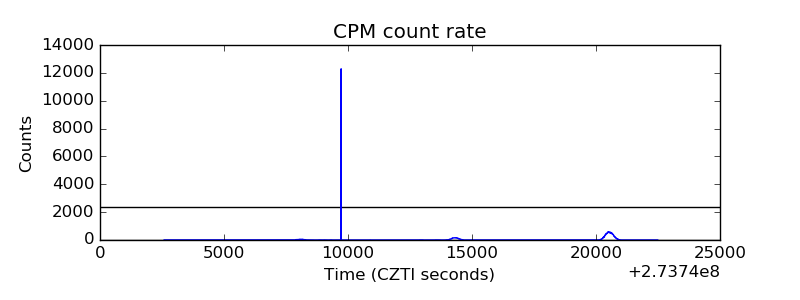 |
| CZT Counter | 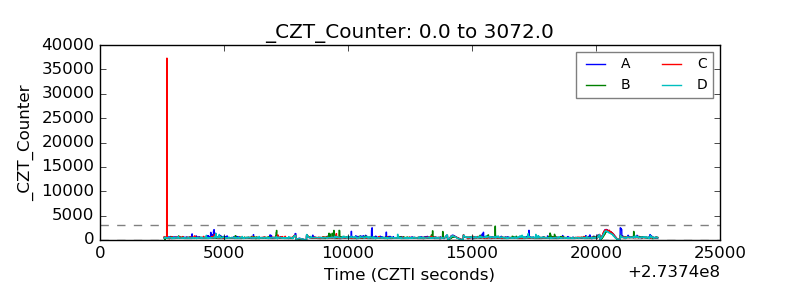 |
| +2.5 Volts monitor |  |
| +5 Volts monitor |  |
| _ROLL_ROT | 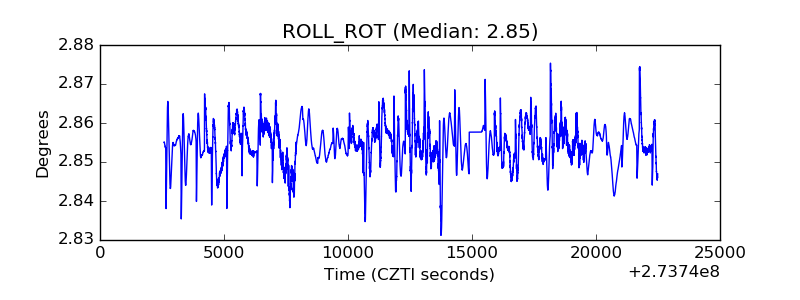 |
| _Roll_DEC | 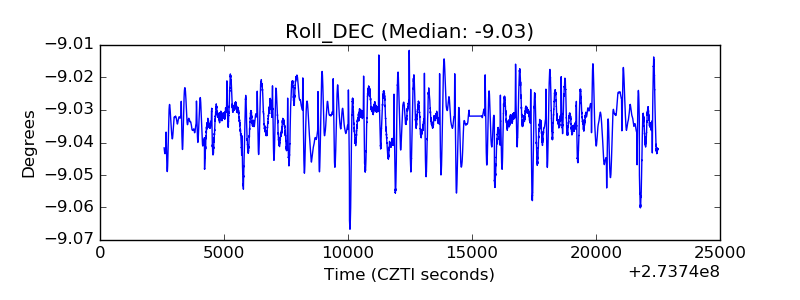 |
| _Roll_RA |  |
| Veto Counter | 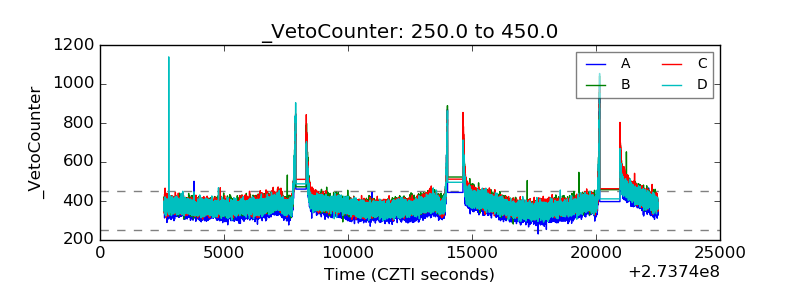 |