| Param | Original file | Final file |
|---|---|---|
| Filename | modeM0/AS1A04_143T01_9000002344_15873cztM0_level2.evt | modeM0/AS1A04_143T01_9000002344_15873cztM0_level2_quad_clean.evt |
| Size (bytes) | 1,864,589,760 | 292,135,680 |
| Size | 1.7 GB | 278.6 MB |
| Events in quadrant A | 14,474,445 | 1,768,148 |
| Events in quadrant B | 13,814,251 | 1,813,836 |
| Events in quadrant C | 13,709,393 | 1,714,030 |
| Events in quadrant D | 12,665,425 | 1,713,050 |
| Mode SS | |||
|---|---|---|---|
| Quadrant | BADHDUFLAG | Total packets | Discarded packets |
| A | 0 | 544 | 0 |
| B | 0 | 544 | 0 |
| C | 0 | 544 | 0 |
| D | 0 | 544 | 0 |
| Mode M0 | |||
|---|---|---|---|
| Quadrant | BADHDUFLAG | Total packets | Discarded packets |
| A | 0 | 60323 | 6 |
| B | 0 | 58069 | 5 |
| C | 0 | 57287 | 5 |
| D | 0 | 55950 | 5 |
| Mode M9 | |||
|---|---|---|---|
| Quadrant | BADHDUFLAG | Total packets | Discarded packets |
| A | 0 | 25 | 0 |
| B | 0 | 25 | 0 |
| C | 0 | 25 | 0 |
| D | 0 | 25 | 0 |
| Quadrant | Total seconds | Saturated seconds | Saturation percentage |
|---|---|---|---|
| A | 26729 | 727 | 2.719892% |
| B | 26729 | 624 | 2.334543% |
| C | 26729 | 766 | 2.865801% |
| D | 26729 | 433 | 1.619963% |
Noise dominated data is calculated using 1-second bins in cleaned event files. If a bin has >2000 counts, and if more than 50% of those come from <1% of pixels, then it is considered to be noise-dominated and hence unusable.
| Quadrant | # 1 sec bins | Bins with >0 counts | Bins with >2000 counts | High rate bins dominated by noise | Noise dominated (total time) | Noise dominated (detector-on time) | Marked lightcurve |
|---|---|---|---|---|---|---|---|
| A | 37782 | 26736 | 120 | 120 | 0.32% | 0.45% | 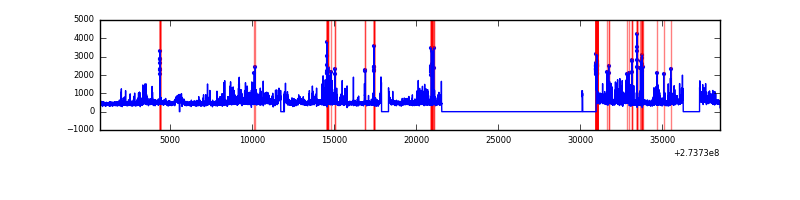 |
| B | 37782 | 26735 | 41 | 41 | 0.11% | 0.15% | 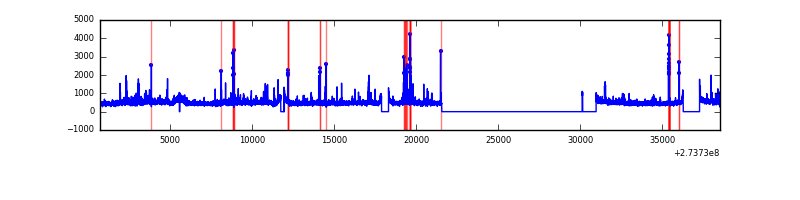 |
| C | 37782 | 26736 | 134 | 134 | 0.35% | 0.50% | 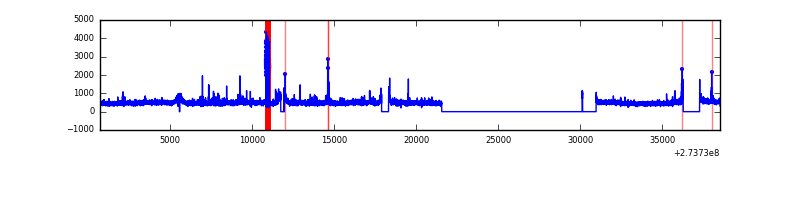 |
| D | 37782 | 26737 | 24 | 24 | 0.06% | 0.09% | 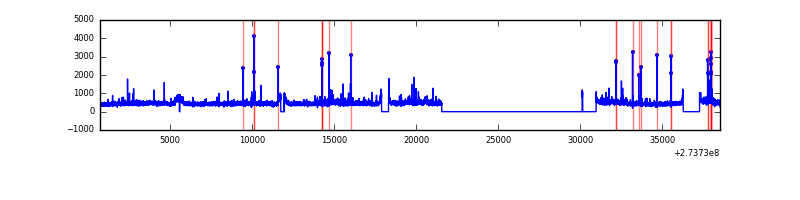 |
Top three noisy pixels from each quadrant. If the there are fewer than three noisy pixels in the level2.evt file, extra rows are filled as -1
| Pixel properties | Quadrant properties | ||||||
|---|---|---|---|---|---|---|---|
| Quadrant | DetID | PixID | Counts | Sigma | Mean | Median | Sigma |
| A | 15 | 239 | 2032546 | 3115.8 | 3228 | 3152 | 651.3 |
| A | 0 | 226 | 28740 | 39.29 | 3228 | 3152 | 651.3 |
| A | 9 | 143 | 27597 | 37.53 | 3228 | 3152 | 651.3 |
| B | 5 | 65 | 295471 | 472.7 | 3238 | 3152 | 618.4 |
| B | 3 | 64 | 242794 | 387.52 | 3238 | 3152 | 618.4 |
| B | 4 | 173 | 127532 | 201.13 | 3238 | 3152 | 618.4 |
| C | 14 | 238 | 471924 | 649.55 | 3100 | 3124 | 721.7 |
| C | 10 | 22 | 398834 | 548.28 | 3100 | 3124 | 721.7 |
| C | 0 | 207 | 289341 | 396.57 | 3100 | 3124 | 721.7 |
| D | 1 | 52 | 260481 | 330.64 | 3181 | 3080 | 778.5 |
| D | 2 | 234 | 117334 | 146.76 | 3181 | 3080 | 778.5 |
| D | 12 | 110 | 106740 | 133.15 | 3181 | 3080 | 778.5 |
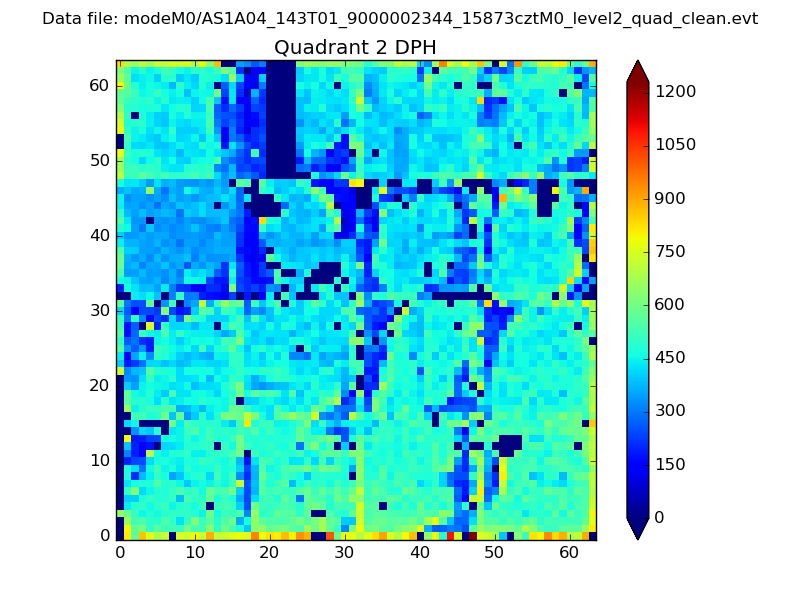
Histogram calculated using DETX and DETY for each event in the final _common_clean file
| Quadrant A | 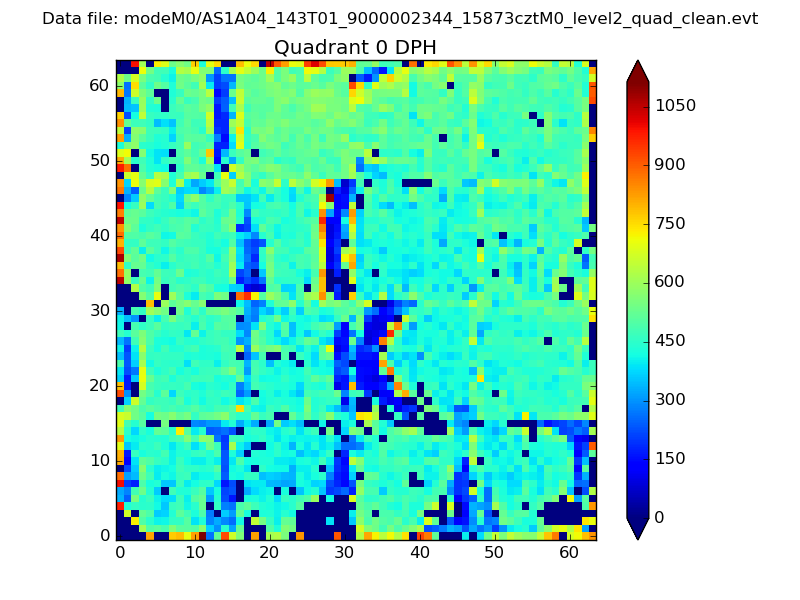 |
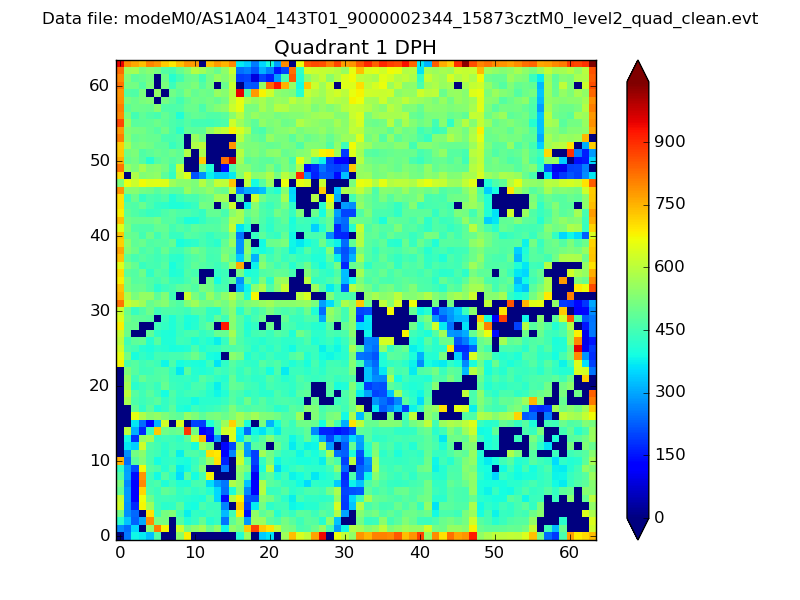 |
Quadrant B |
|---|---|---|---|
| Quadrant D | 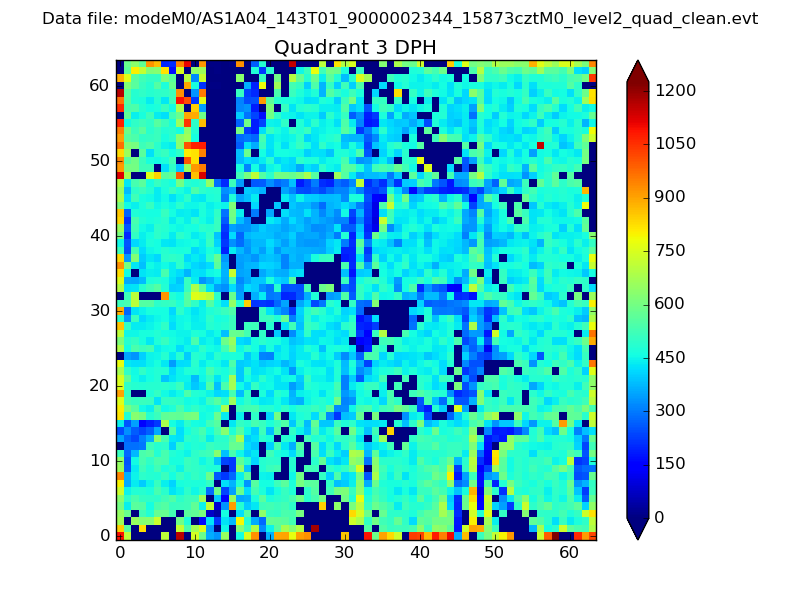 |
 |
Quadrant C |
| Plot type | Count rate plots | Images |
|---|---|---|
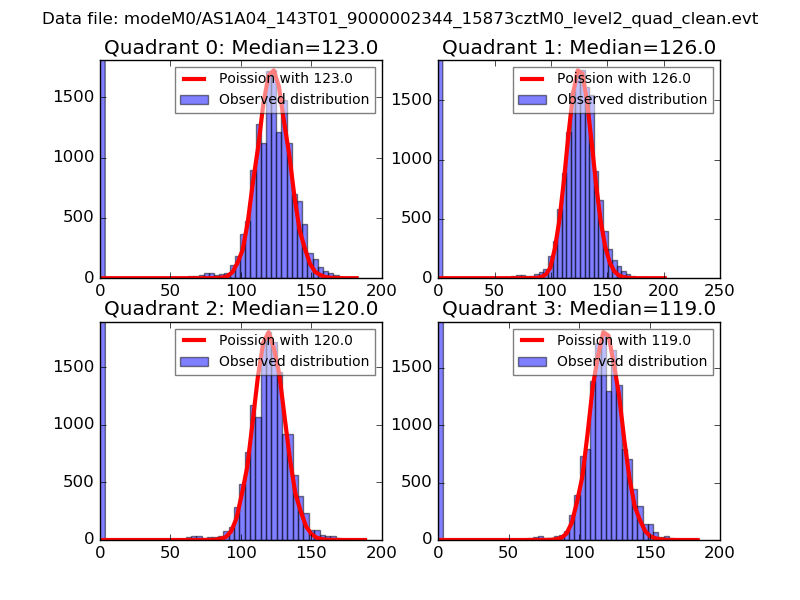
| Comparison with Poisson distribution Blue bars denote a histogram of data divided into 1 sec bins. Red curve is a Poisson curve with rate = median count rate of data. |
 |
 |
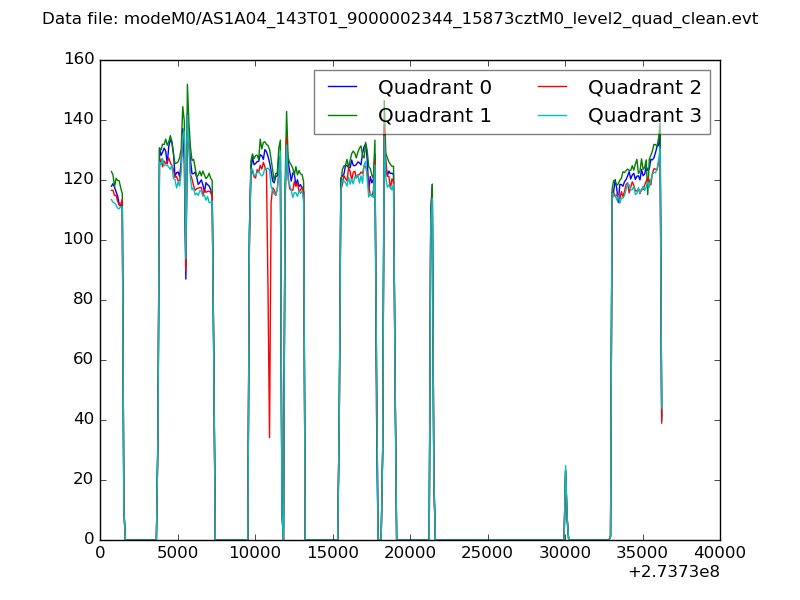
| Quadrant-wise count rates Data is divided into 100 sec bins |
 |
|
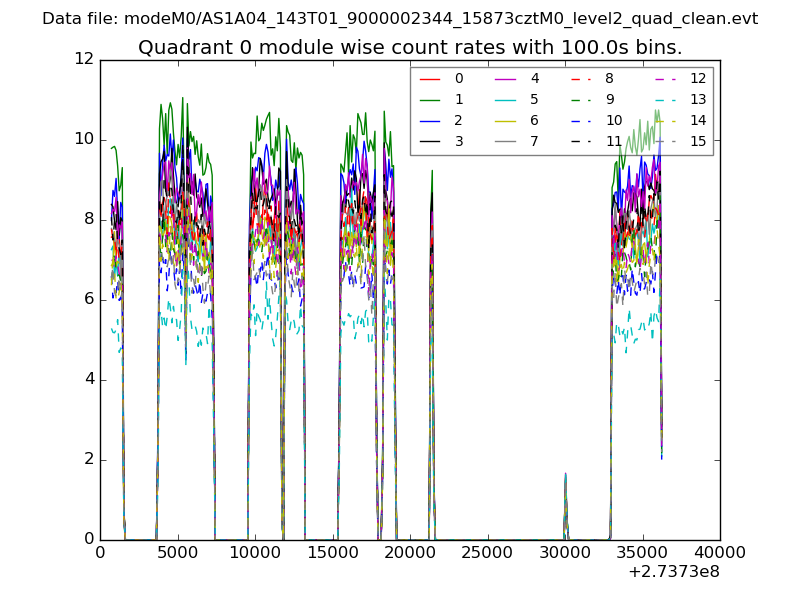
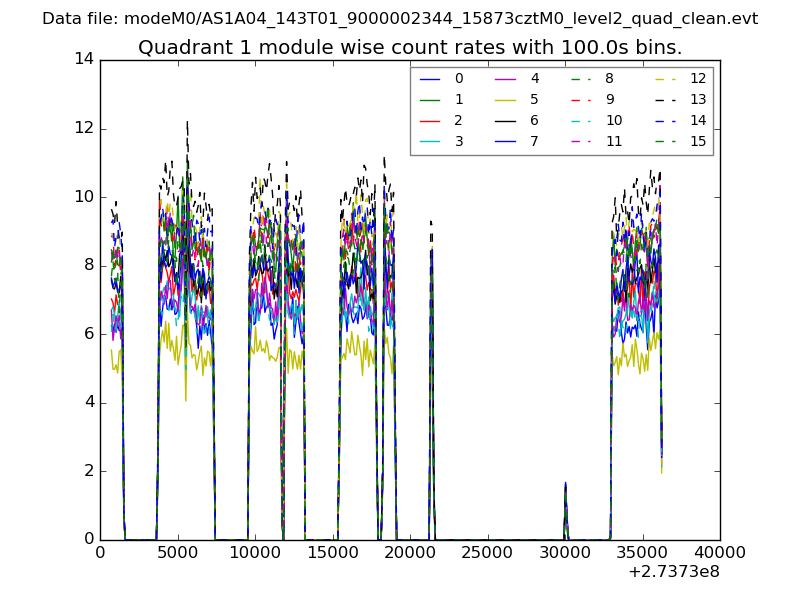
| Module-wise count rates for Quadrant A Data is divided into 100 sec bins |
 |
 |
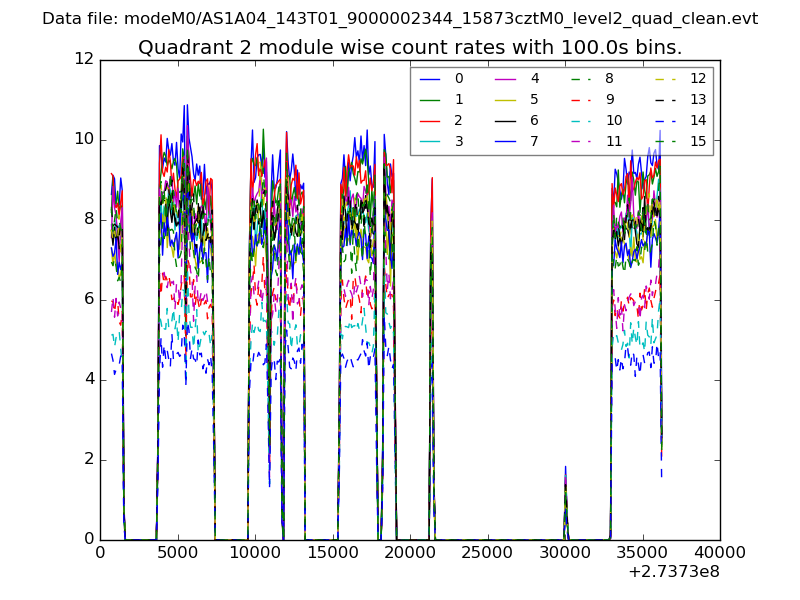
| Module-wise count rates for Quadrant B Data is divided into 100 sec bins |
 |
 |
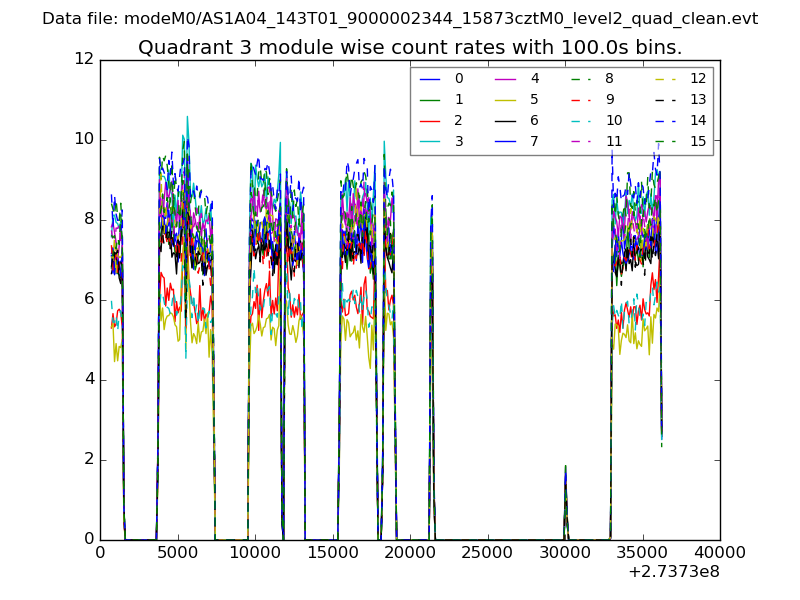
| Module-wise count rates for Quadrant C Data is divided into 100 sec bins |
 |
 |
| Module-wise count rates for Quadrant D Data is divided into 100 sec bins |
 |
 |
| Parameter | Plot |
|---|---|
| CZT HV Monitor | 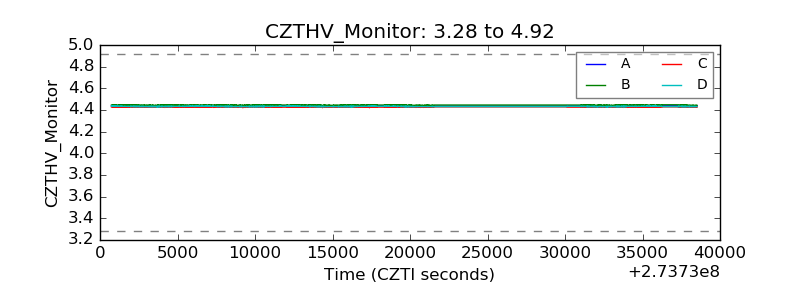 |
| D_VDD | 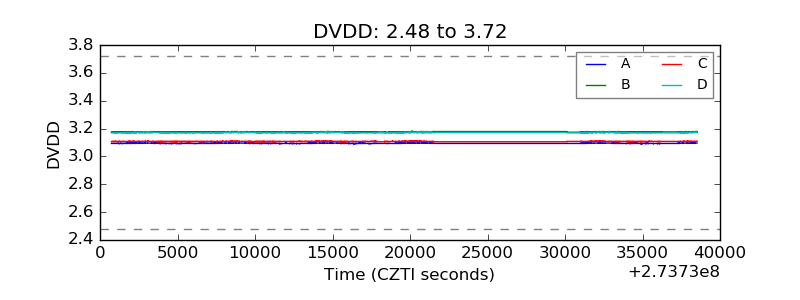 |
| Temperature 1 | 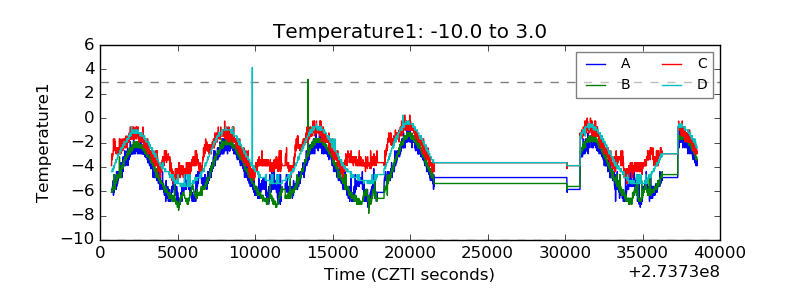 |
| Veto HV Monitor | 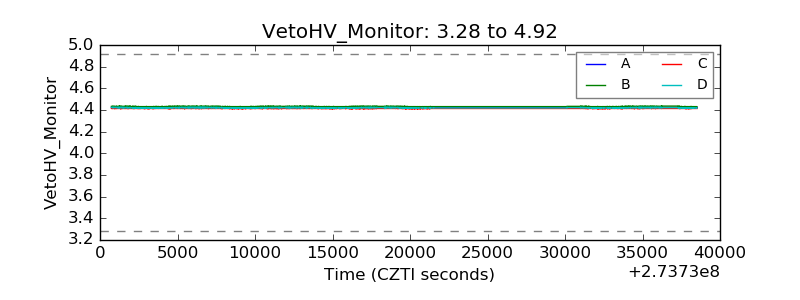 |
| Veto LLD | 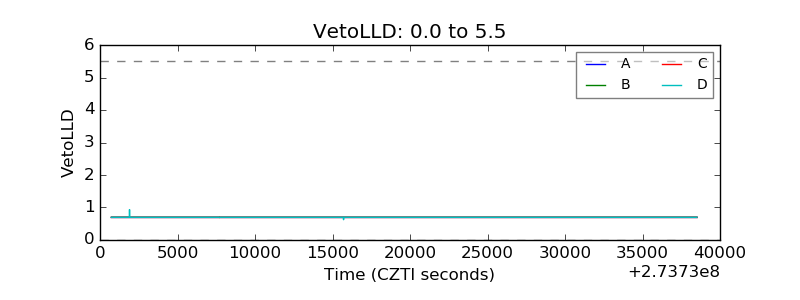 |
| Alpha Counter | 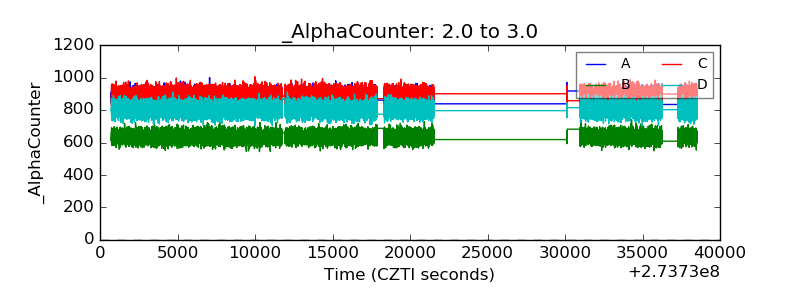 |
| _CPM_Rate | 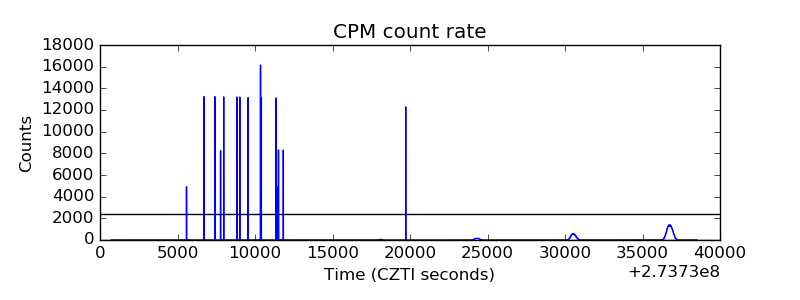 |
| CZT Counter | 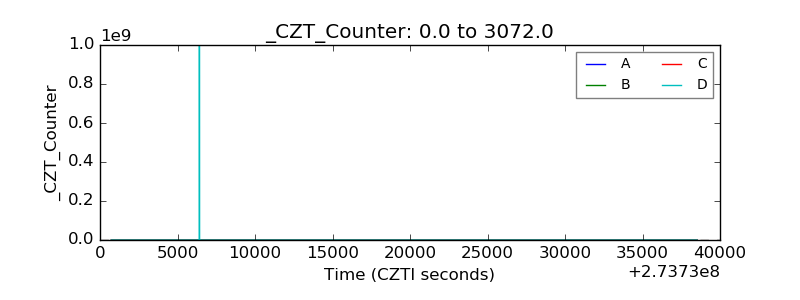 |
| +2.5 Volts monitor |  |
| +5 Volts monitor |  |
| _ROLL_ROT |  |
| _Roll_DEC | 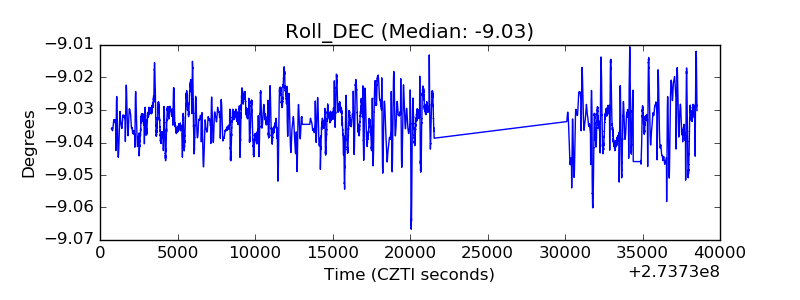 |
| _Roll_RA | 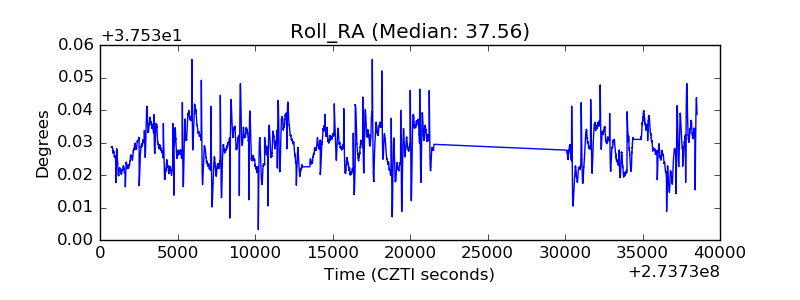 |
| Veto Counter | 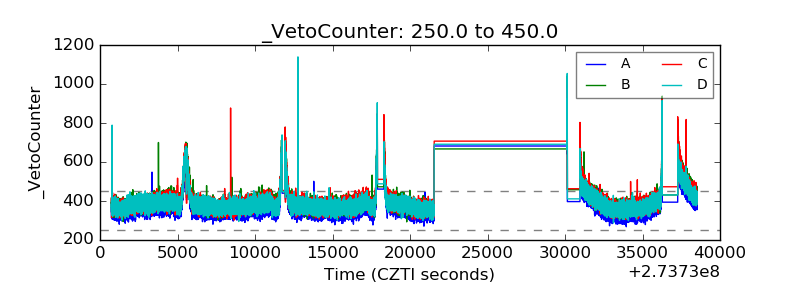 |