| Param | Original file | Final file |
|---|---|---|
| Filename | modeM0/AS1A04_143T01_9000002344_15876cztM0_level2.evt | modeM0/AS1A04_143T01_9000002344_15876cztM0_level2_quad_clean.evt |
| Size (bytes) | 495,486,720 | 86,328,000 |
| Size | 472.5 MB | 82.3 MB |
| Events in quadrant A | 4,529,877 | 539,314 |
| Events in quadrant B | 3,496,226 | 565,441 |
| Events in quadrant C | 3,389,670 | 536,445 |
| Events in quadrant D | 3,161,785 | 532,594 |
| Mode SS | |||
|---|---|---|---|
| Quadrant | BADHDUFLAG | Total packets | Discarded packets |
| A | 0 | 130 | 0 |
| B | 0 | 130 | 0 |
| C | 0 | 130 | 0 |
| D | 0 | 130 | 0 |
| Mode M0 | |||
|---|---|---|---|
| Quadrant | BADHDUFLAG | Total packets | Discarded packets |
| A | 0 | 17778 | 3 |
| B | 0 | 14515 | 2 |
| C | 0 | 14172 | 2 |
| D | 0 | 13657 | 2 |
| Mode M9 | |||
|---|---|---|---|
| Quadrant | BADHDUFLAG | Total packets | Discarded packets |
| A | 0 | 24 | 0 |
| B | 0 | 24 | 0 |
| C | 0 | 24 | 0 |
| D | 0 | 24 | 0 |
| Quadrant | Total seconds | Saturated seconds | Saturation percentage |
|---|---|---|---|
| A | 6311 | 383 | 6.068769% |
| B | 6311 | 140 | 2.218349% |
| C | 6311 | 124 | 1.964823% |
| D | 6311 | 60 | 0.950721% |
Noise dominated data is calculated using 1-second bins in cleaned event files. If a bin has >2000 counts, and if more than 50% of those come from <1% of pixels, then it is considered to be noise-dominated and hence unusable.
| Quadrant | # 1 sec bins | Bins with >0 counts | Bins with >2000 counts | High rate bins dominated by noise | Noise dominated (total time) | Noise dominated (detector-on time) | Marked lightcurve |
|---|---|---|---|---|---|---|---|
| A | 8727 | 6313 | 172 | 172 | 1.97% | 2.72% | 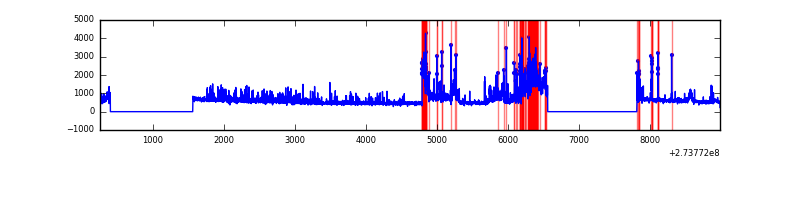 |
| B | 8727 | 6314 | 27 | 27 | 0.31% | 0.43% | 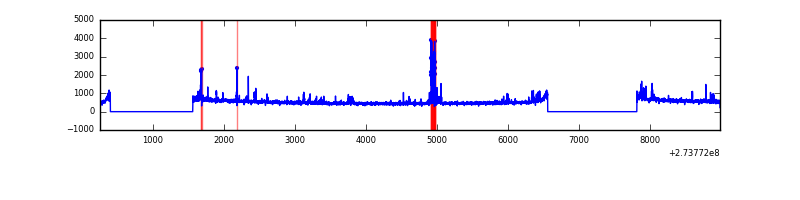 |
| C | 8727 | 6314 | 4 | 4 | 0.05% | 0.06% | 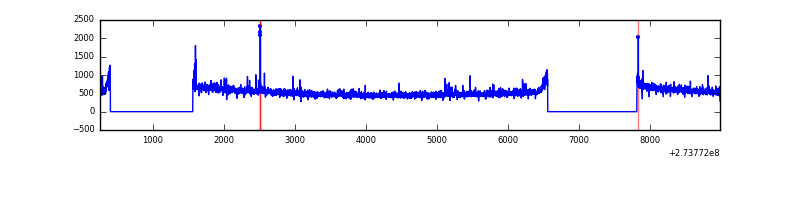 |
| D | 8727 | 6314 | 8 | 8 | 0.09% | 0.13% | 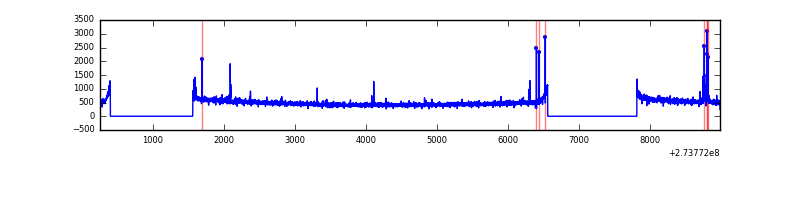 |
Top three noisy pixels from each quadrant. If the there are fewer than three noisy pixels in the level2.evt file, extra rows are filled as -1
| Pixel properties | Quadrant properties | ||||||
|---|---|---|---|---|---|---|---|
| Quadrant | DetID | PixID | Counts | Sigma | Mean | Median | Sigma |
| A | 15 | 239 | 1360515 | 8330.88 | 815 | 799 | 163.2 |
| A | 13 | 248 | 21560 | 127.2 | 815 | 799 | 163.2 |
| A | 9 | 143 | 12230 | 70.04 | 815 | 799 | 163.2 |
| B | 5 | 65 | 179768 | 1138.93 | 836 | 819 | 157.1 |
| B | 12 | 111 | 17688 | 107.36 | 836 | 819 | 157.1 |
| B | 11 | 111 | 14987 | 90.17 | 836 | 819 | 157.1 |
| C | 14 | 238 | 125953 | 670.72 | 801 | 808 | 186.6 |
| C | 3 | 233 | 56455 | 298.24 | 801 | 808 | 186.6 |
| C | 0 | 207 | 38501 | 202.02 | 801 | 808 | 186.6 |
| D | 10 | 70 | 43011 | 212.17 | 812 | 790 | 199.0 |
| D | 2 | 234 | 26134 | 127.36 | 812 | 790 | 199.0 |
| D | 1 | 52 | 14934 | 71.08 | 812 | 790 | 199.0 |
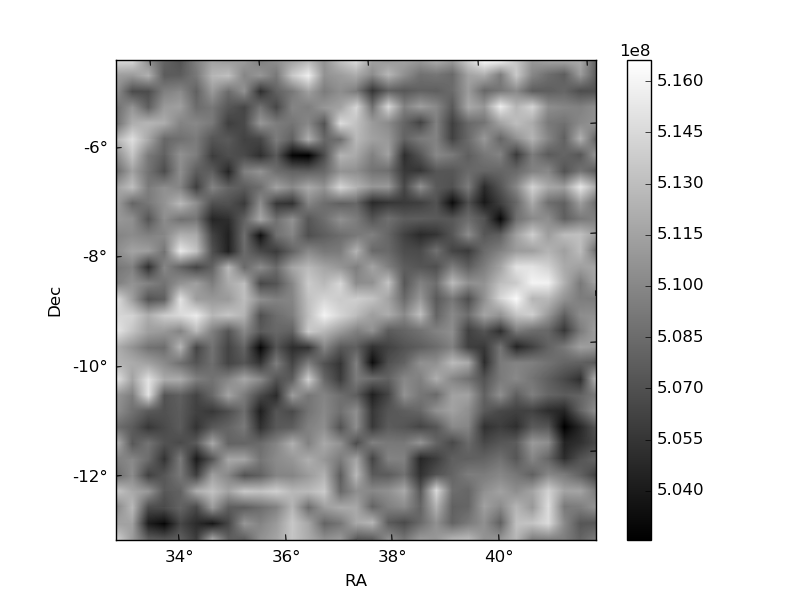
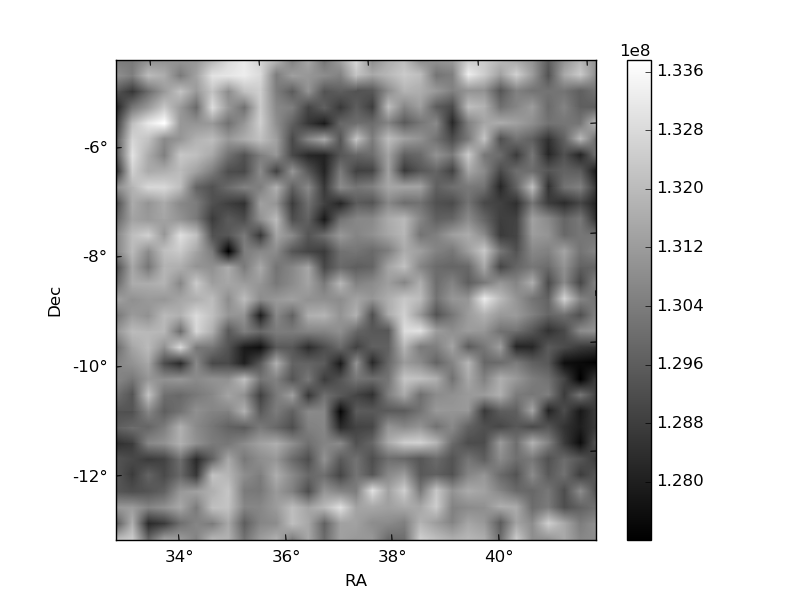
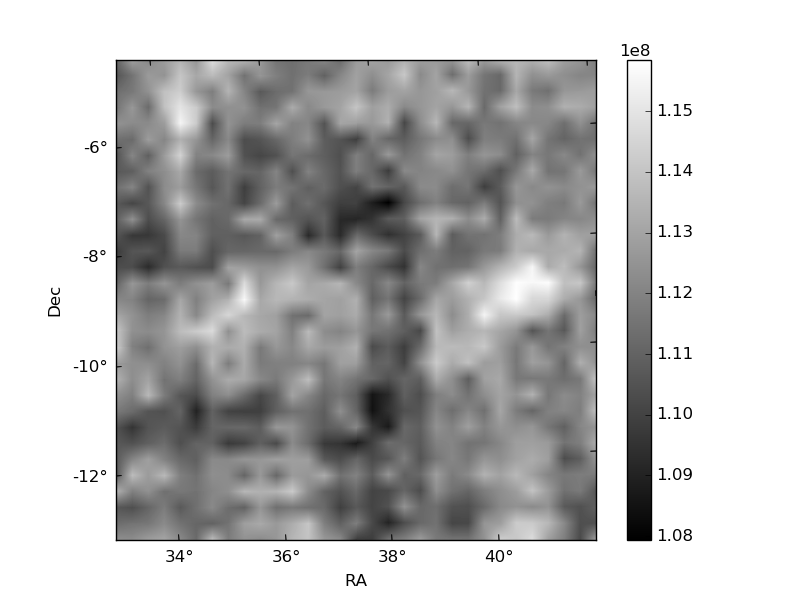
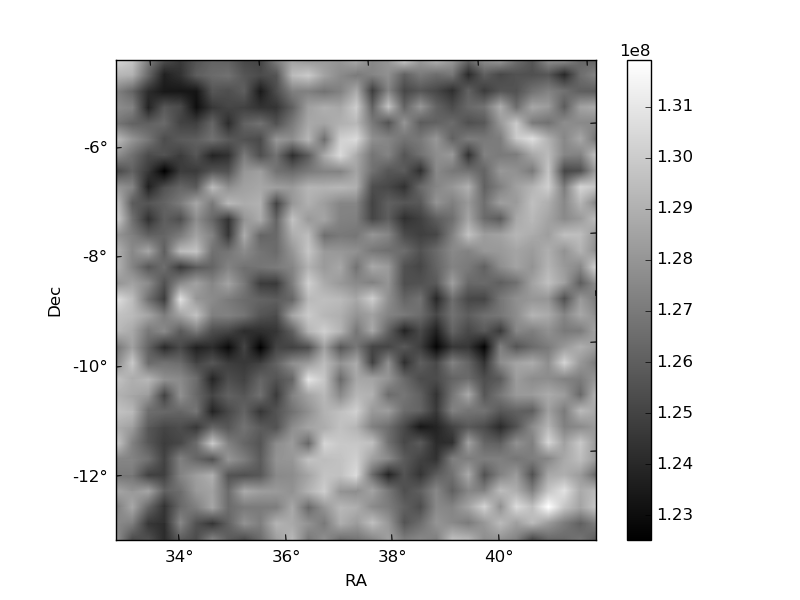
Histogram calculated using DETX and DETY for each event in the final _common_clean file
| Quadrant A | 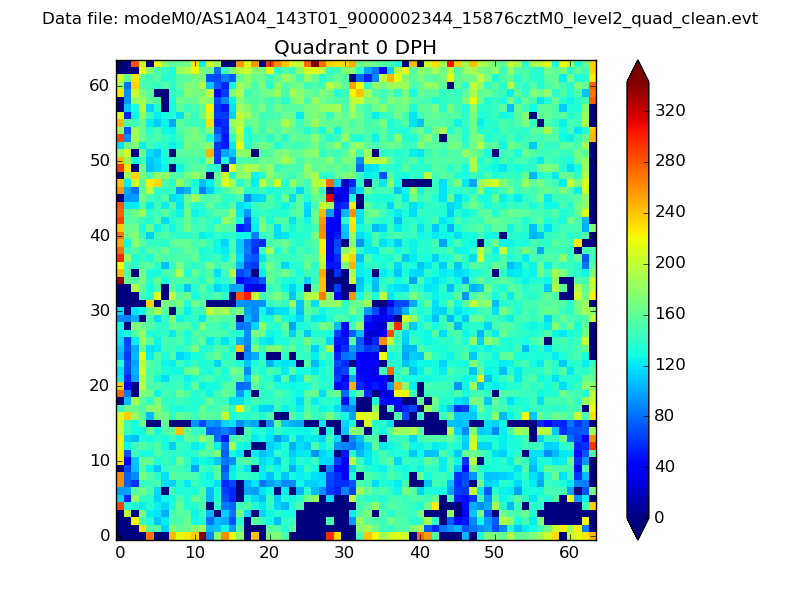 |
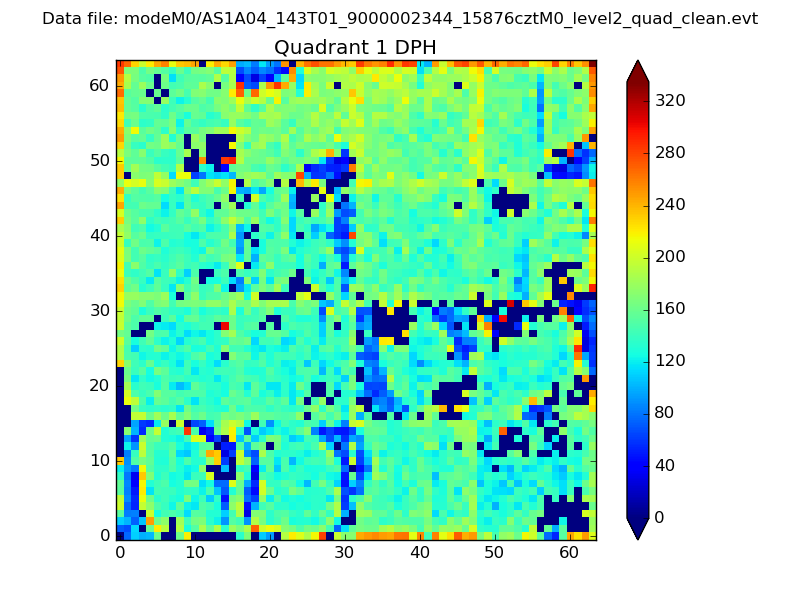 |
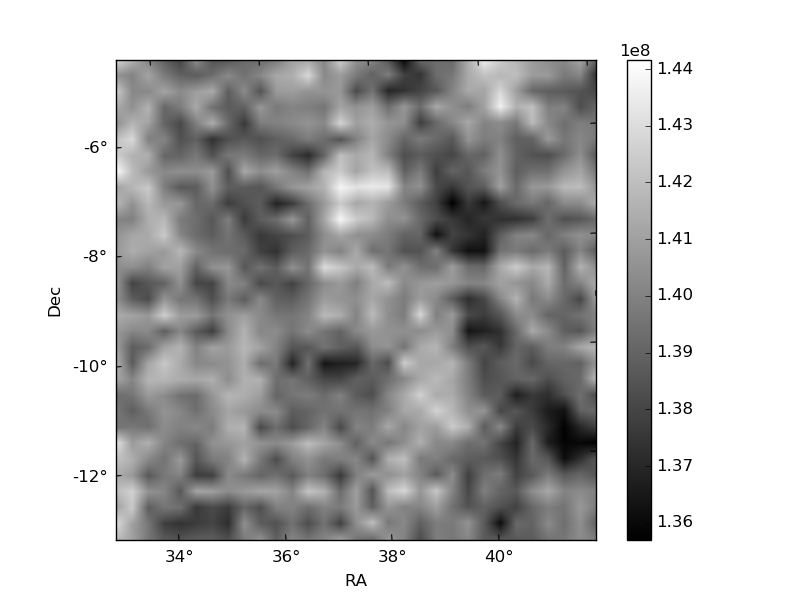
Quadrant B |
|---|---|---|---|
| Quadrant D | 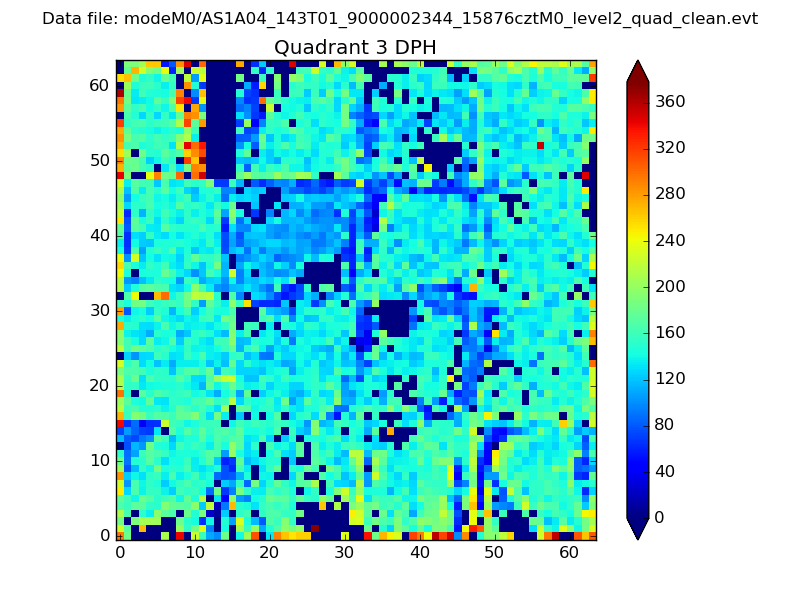 |
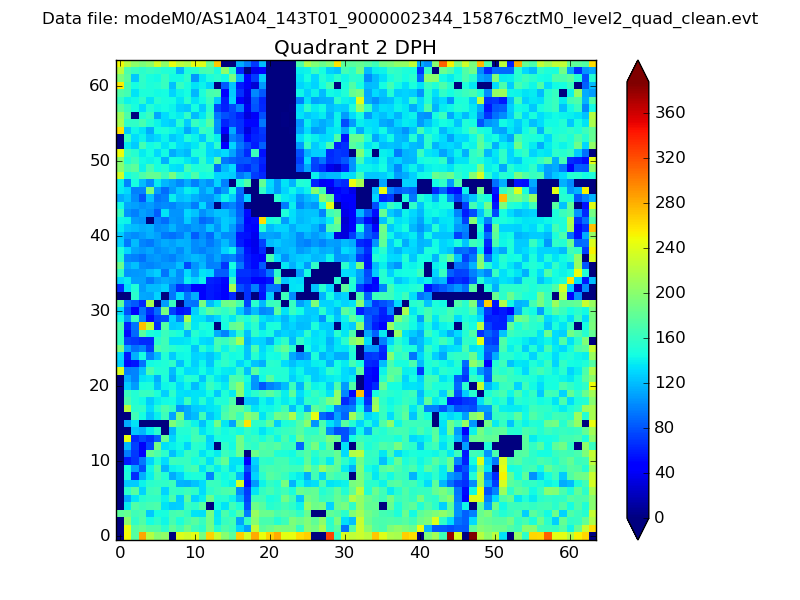 |
Quadrant C |
| Plot type | Count rate plots | Images |
|---|---|---|
| Comparison with Poisson distribution Blue bars denote a histogram of data divided into 1 sec bins. Red curve is a Poisson curve with rate = median count rate of data. |
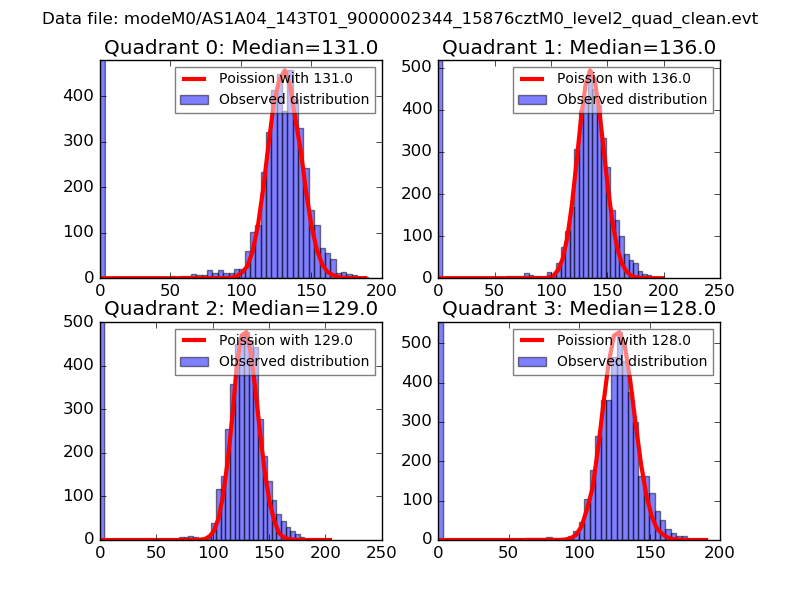 |
 |
| Quadrant-wise count rates Data is divided into 100 sec bins |
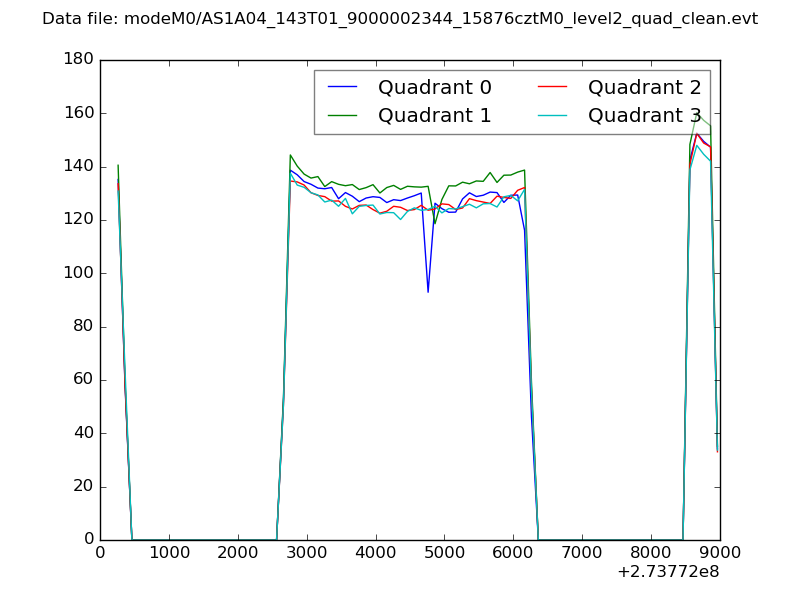 |
|
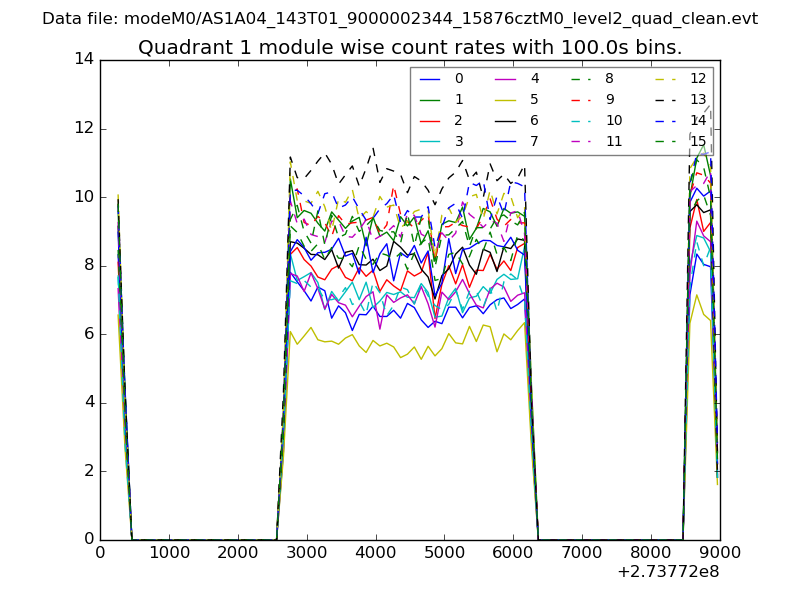
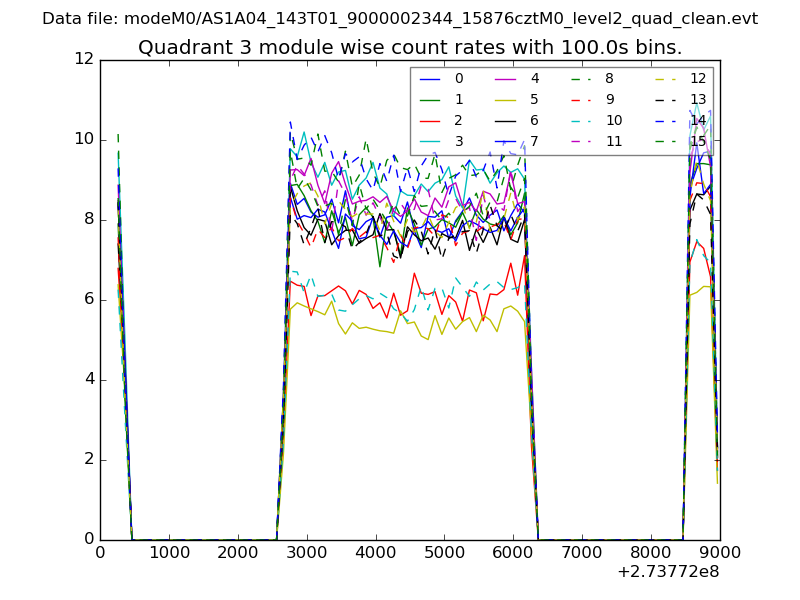
| Module-wise count rates for Quadrant A Data is divided into 100 sec bins |
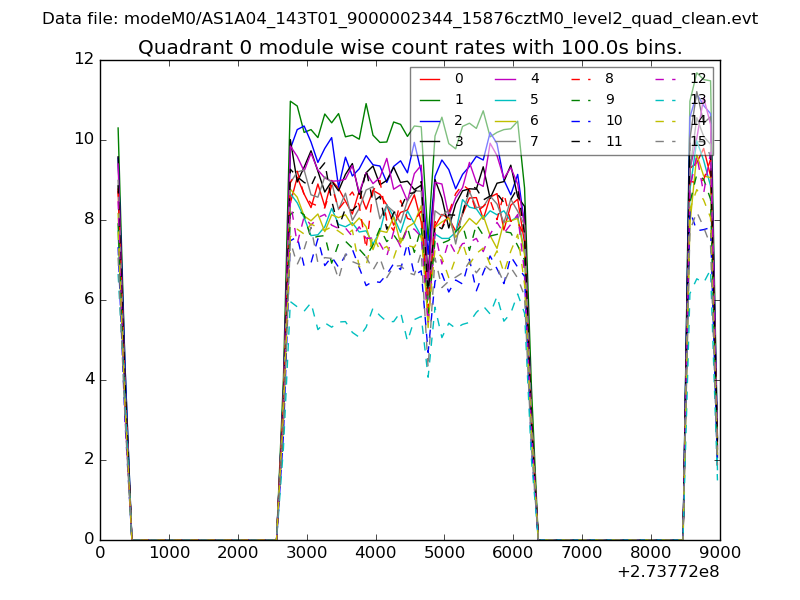 |
 |
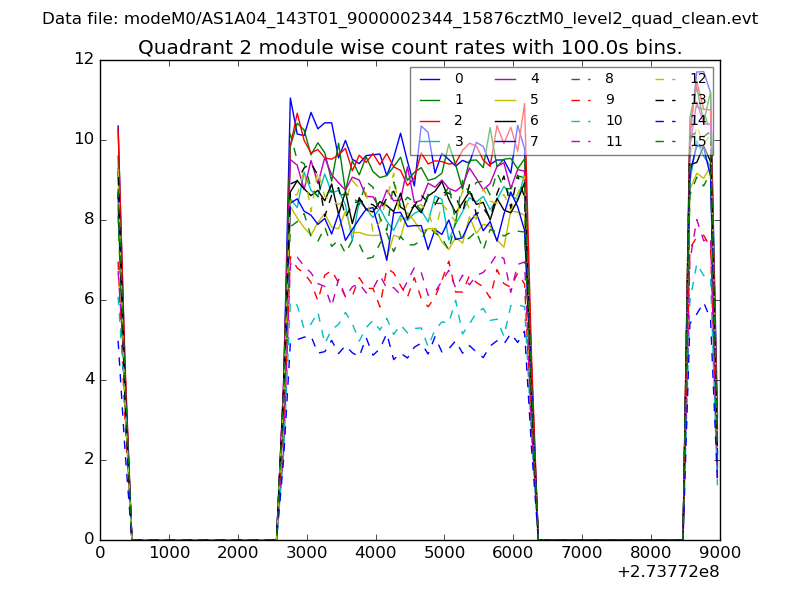
| Module-wise count rates for Quadrant B Data is divided into 100 sec bins |
 |
 |
| Module-wise count rates for Quadrant C Data is divided into 100 sec bins |
 |
 |
| Module-wise count rates for Quadrant D Data is divided into 100 sec bins |
 |
 |
| Parameter | Plot |
|---|---|
| CZT HV Monitor | 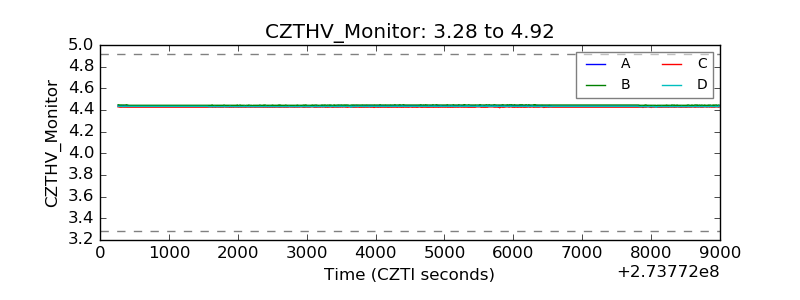 |
| D_VDD | 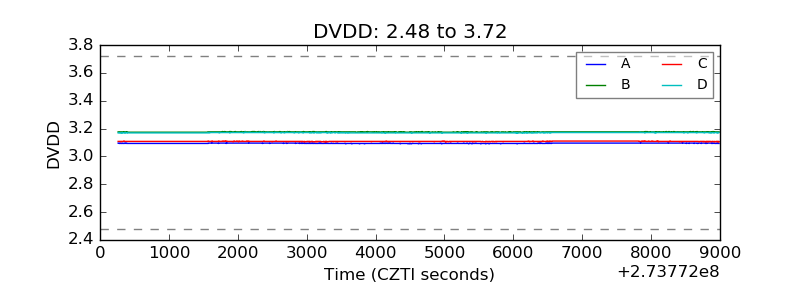 |
| Temperature 1 | 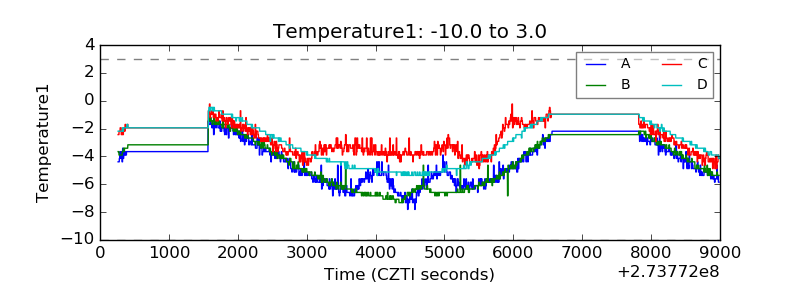 |
| Veto HV Monitor | 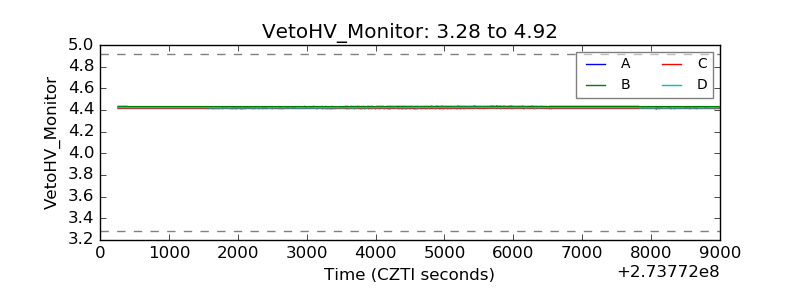 |
| Veto LLD | 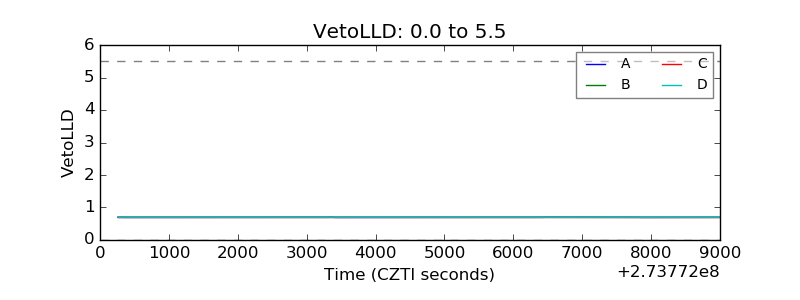 |
| Alpha Counter | 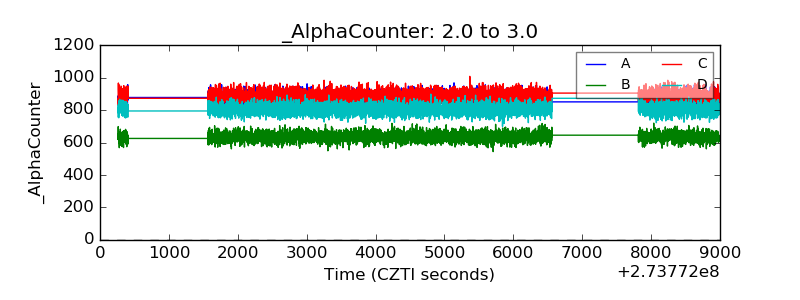 |
| _CPM_Rate | 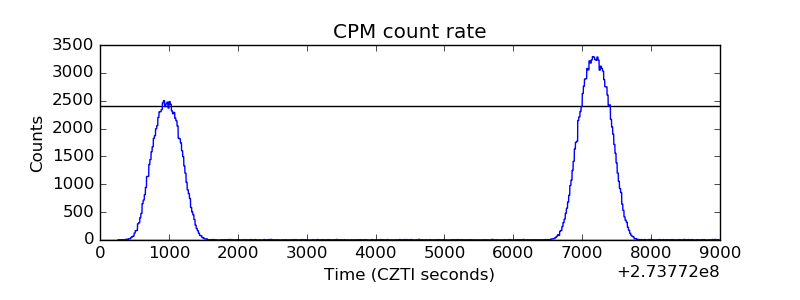 |
| CZT Counter | 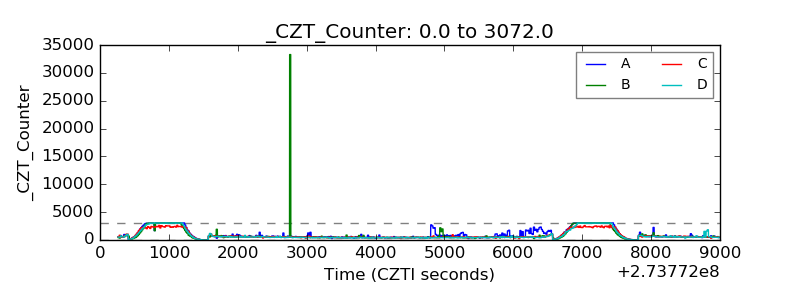 |
| +2.5 Volts monitor |  |
| +5 Volts monitor |  |
| _ROLL_ROT | 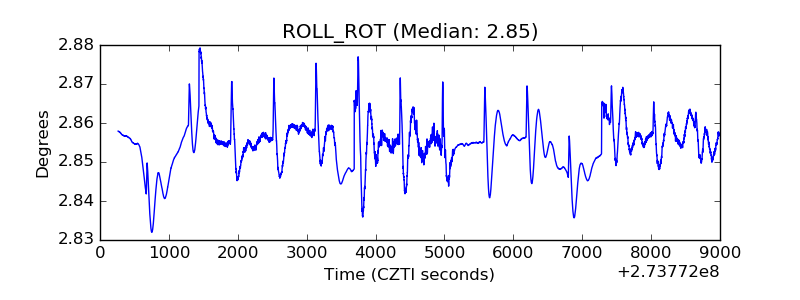 |
| _Roll_DEC | 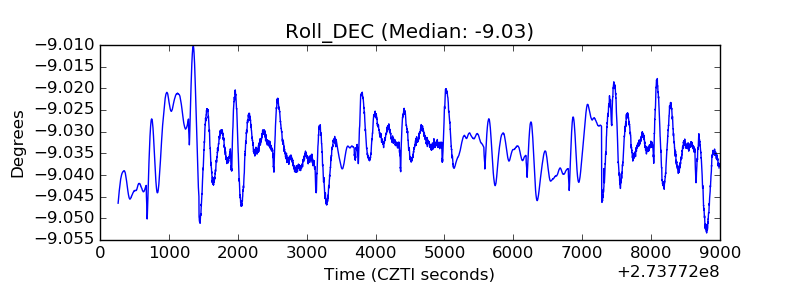 |
| _Roll_RA | 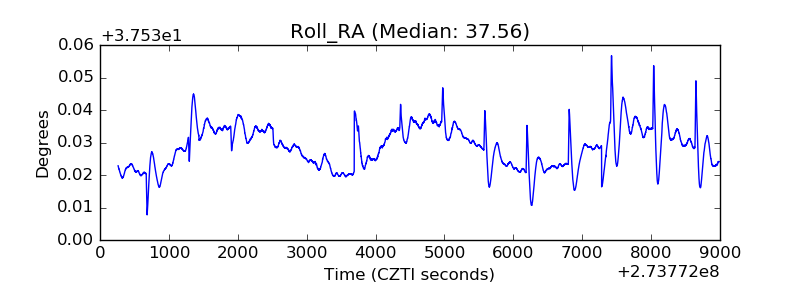 |
| Veto Counter | 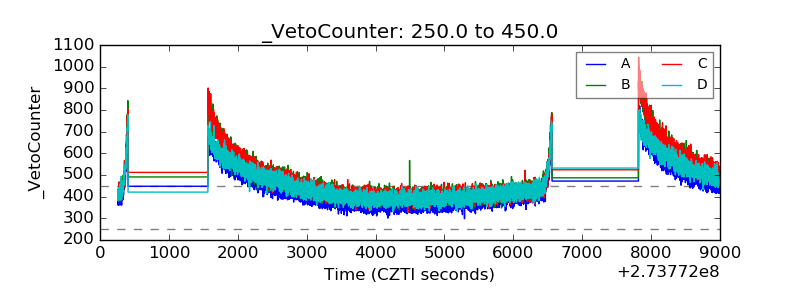 |