| Param | Original file | Final file |
|---|---|---|
| Filename | modeM0/AS1A04_143T01_9000002344_15877cztM0_level2.evt | modeM0/AS1A04_143T01_9000002344_15877cztM0_level2_quad_clean.evt |
| Size (bytes) | 440,726,400 | 96,707,520 |
| Size | 420.3 MB | 92.2 MB |
| Events in quadrant A | 3,288,822 | 628,878 |
| Events in quadrant B | 3,328,471 | 652,776 |
| Events in quadrant C | 3,230,348 | 616,869 |
| Events in quadrant D | 3,084,862 | 603,897 |
| Mode SS | |||
|---|---|---|---|
| Quadrant | BADHDUFLAG | Total packets | Discarded packets |
| A | 0 | 126 | 0 |
| B | 0 | 126 | 0 |
| C | 0 | 126 | 0 |
| D | 0 | 126 | 0 |
| Mode M0 | |||
|---|---|---|---|
| Quadrant | BADHDUFLAG | Total packets | Discarded packets |
| A | 0 | 13676 | 3 |
| B | 0 | 13810 | 2 |
| C | 0 | 13414 | 2 |
| D | 0 | 13178 | 2 |
| Mode M9 | |||
|---|---|---|---|
| Quadrant | BADHDUFLAG | Total packets | Discarded packets |
| A | 0 | 13 | 0 |
| B | 0 | 13 | 0 |
| C | 0 | 13 | 0 |
| D | 0 | 13 | 0 |
| Quadrant | Total seconds | Saturated seconds | Saturation percentage |
|---|---|---|---|
| A | 6101 | 68 | 1.114571% |
| B | 6101 | 74 | 1.212916% |
| C | 6101 | 73 | 1.196525% |
| D | 6101 | 26 | 0.426160% |
Noise dominated data is calculated using 1-second bins in cleaned event files. If a bin has >2000 counts, and if more than 50% of those come from <1% of pixels, then it is considered to be noise-dominated and hence unusable.
| Quadrant | # 1 sec bins | Bins with >0 counts | Bins with >2000 counts | High rate bins dominated by noise | Noise dominated (total time) | Noise dominated (detector-on time) | Marked lightcurve |
|---|---|---|---|---|---|---|---|
| A | 7432 | 6103 | 13 | 13 | 0.17% | 0.21% | 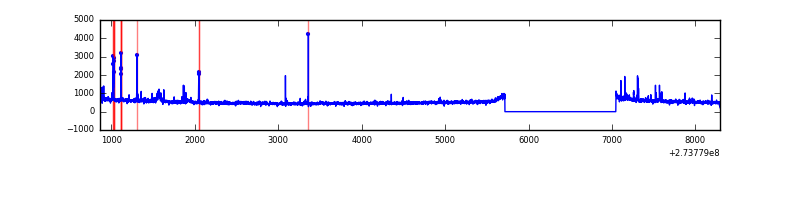 |
| B | 7432 | 6103 | 5 | 5 | 0.07% | 0.08% | 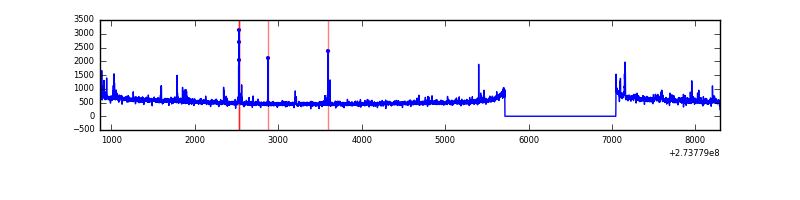 |
| C | 7432 | 6103 | 0 | 0 | 0.00% | 0.00% | 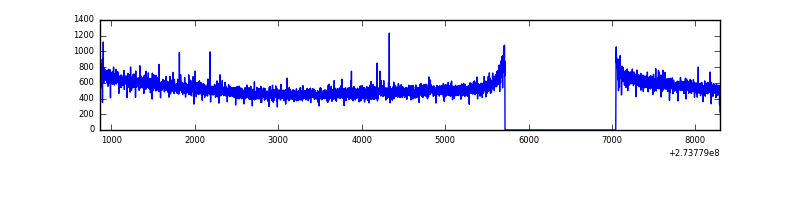 |
| D | 7432 | 6103 | 8 | 8 | 0.11% | 0.13% | 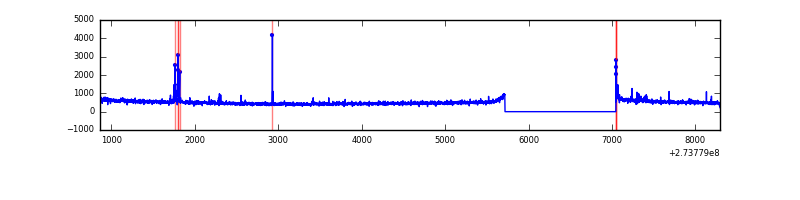 |
Top three noisy pixels from each quadrant. If the there are fewer than three noisy pixels in the level2.evt file, extra rows are filled as -1
| Pixel properties | Quadrant properties | ||||||
|---|---|---|---|---|---|---|---|
| Quadrant | DetID | PixID | Counts | Sigma | Mean | Median | Sigma |
| A | 15 | 239 | 145440 | 893.93 | 808 | 793 | 161.8 |
| A | 13 | 248 | 21223 | 126.26 | 808 | 793 | 161.8 |
| A | 15 | 157 | 11226 | 64.48 | 808 | 793 | 161.8 |
| B | 5 | 65 | 51507 | 329.66 | 820 | 802 | 153.8 |
| B | 4 | 173 | 19090 | 118.9 | 820 | 802 | 153.8 |
| B | 12 | 111 | 17062 | 105.72 | 820 | 802 | 153.8 |
| C | 14 | 238 | 121860 | 663.9 | 784 | 793 | 182.4 |
| C | 3 | 233 | 26501 | 140.98 | 784 | 793 | 182.4 |
| C | 0 | 207 | 12171 | 62.39 | 784 | 793 | 182.4 |
| D | 10 | 70 | 42301 | 214.18 | 790 | 767 | 193.9 |
| D | 1 | 52 | 34068 | 171.73 | 790 | 767 | 193.9 |
| D | 2 | 234 | 25492 | 127.5 | 790 | 767 | 193.9 |
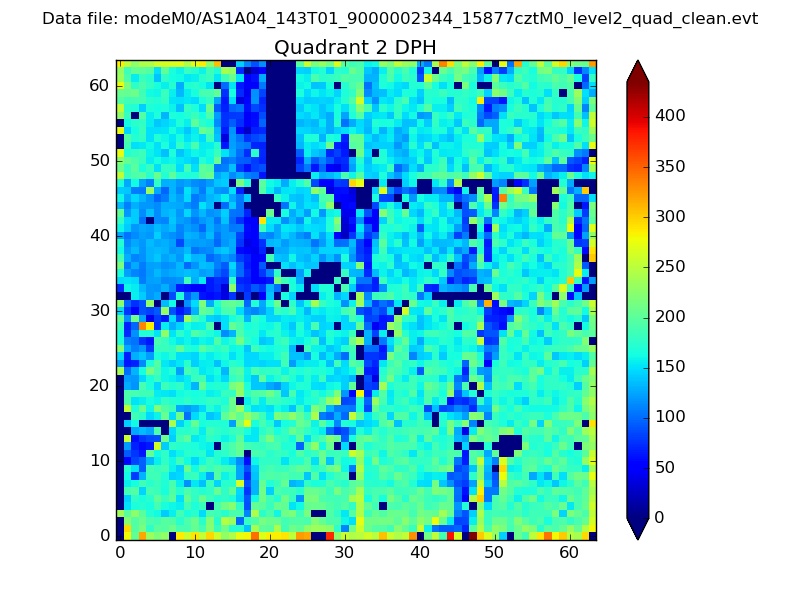
Histogram calculated using DETX and DETY for each event in the final _common_clean file
| Quadrant A | 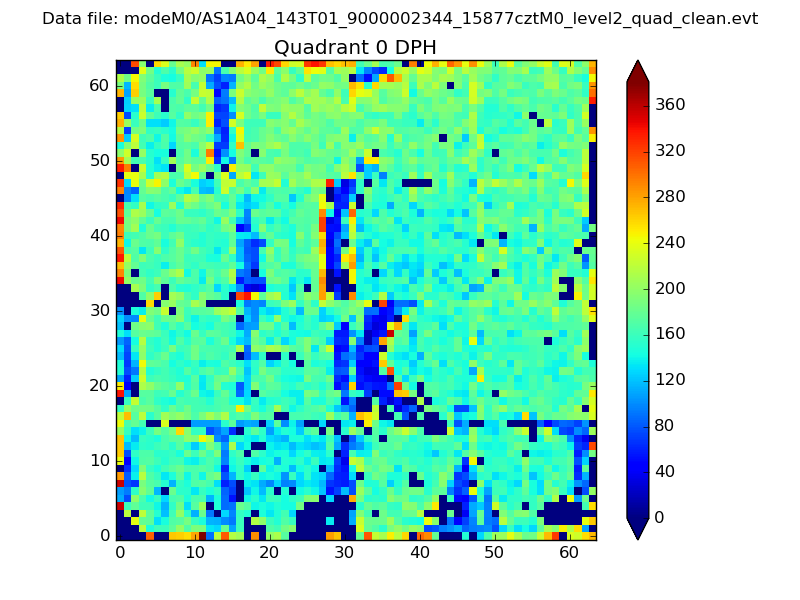 |
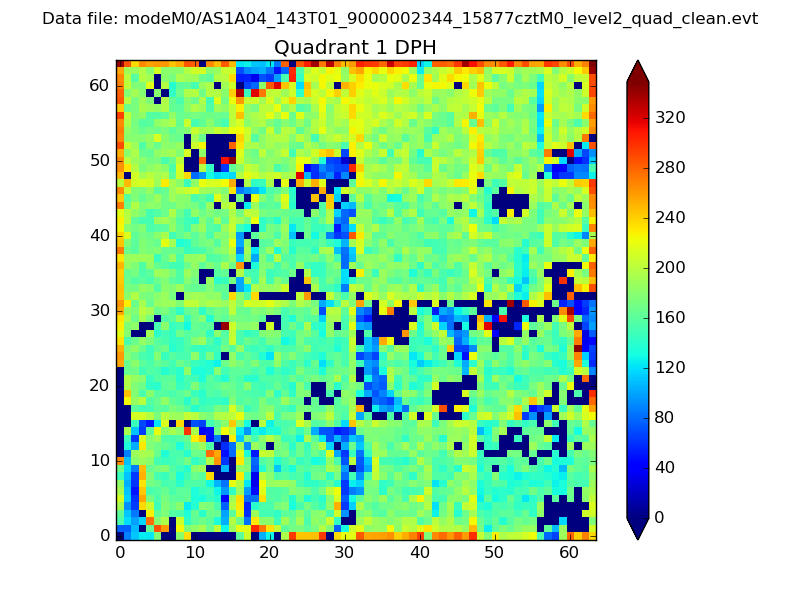 |
Quadrant B |
|---|---|---|---|
| Quadrant D | 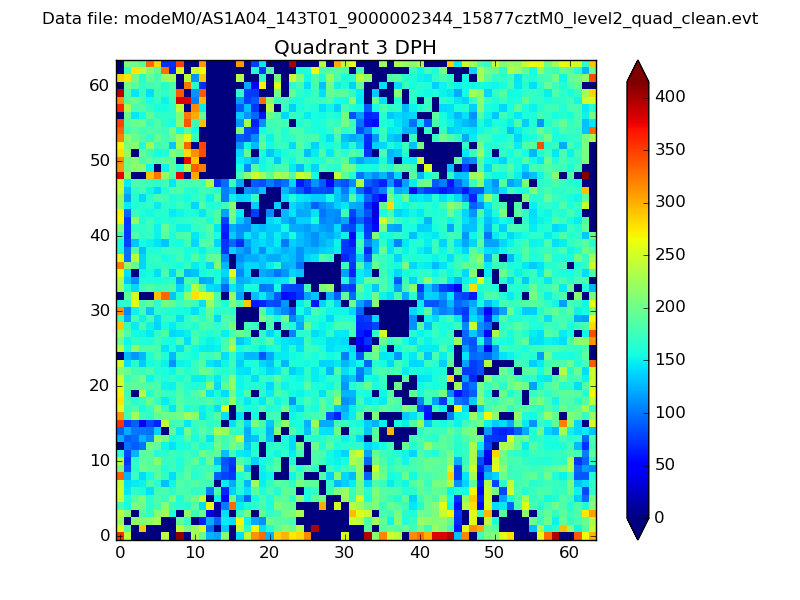 |
 |
Quadrant C |
| Plot type | Count rate plots | Images |
|---|---|---|
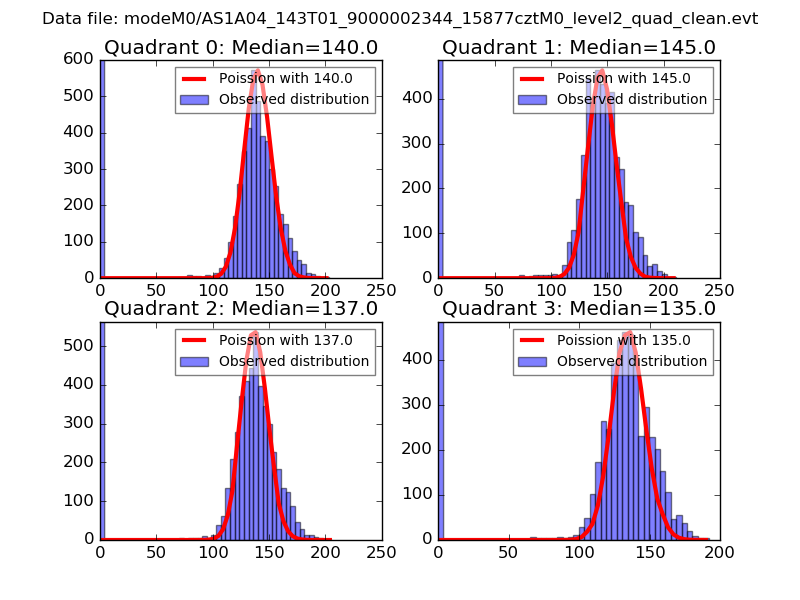
| Comparison with Poisson distribution Blue bars denote a histogram of data divided into 1 sec bins. Red curve is a Poisson curve with rate = median count rate of data. |
 |
 |
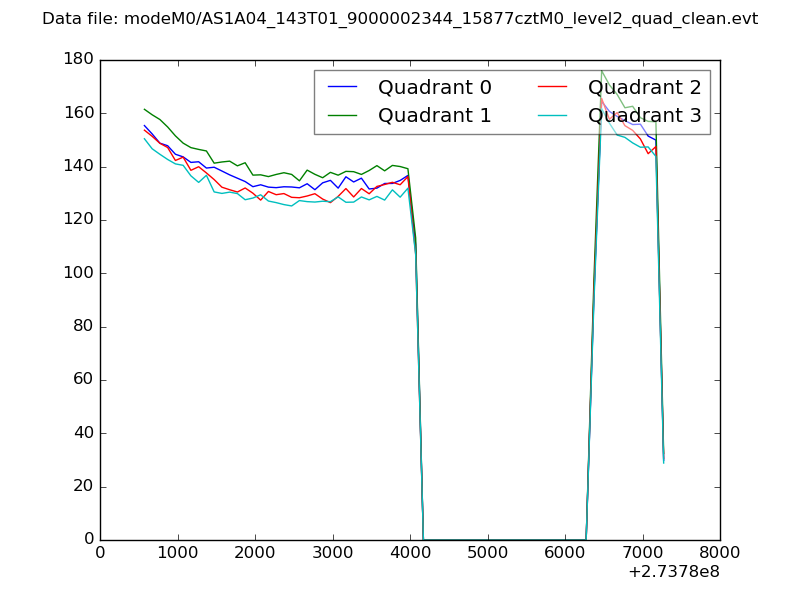
| Quadrant-wise count rates Data is divided into 100 sec bins |
 |
|
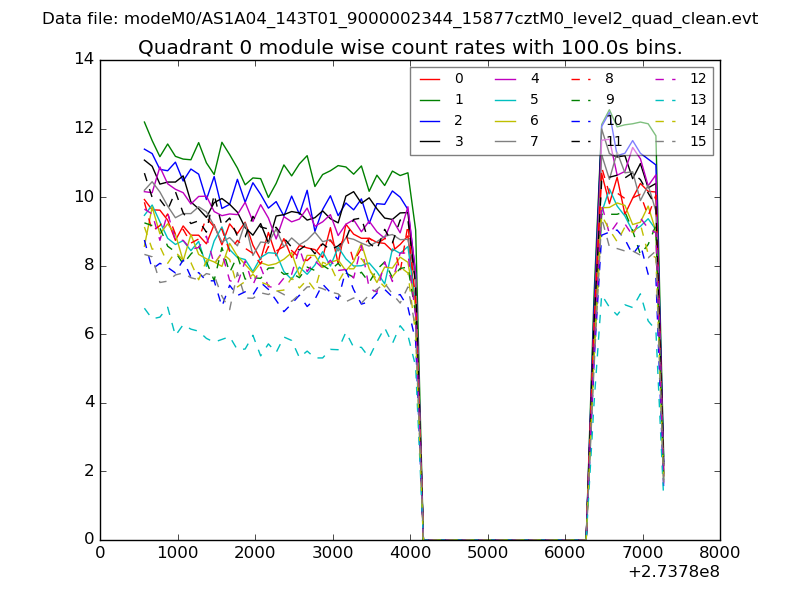
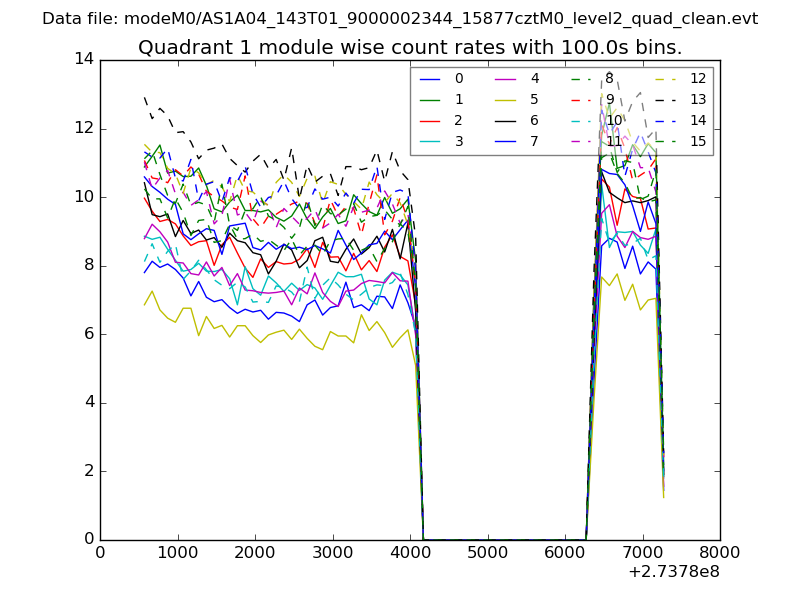
| Module-wise count rates for Quadrant A Data is divided into 100 sec bins |
 |
 |
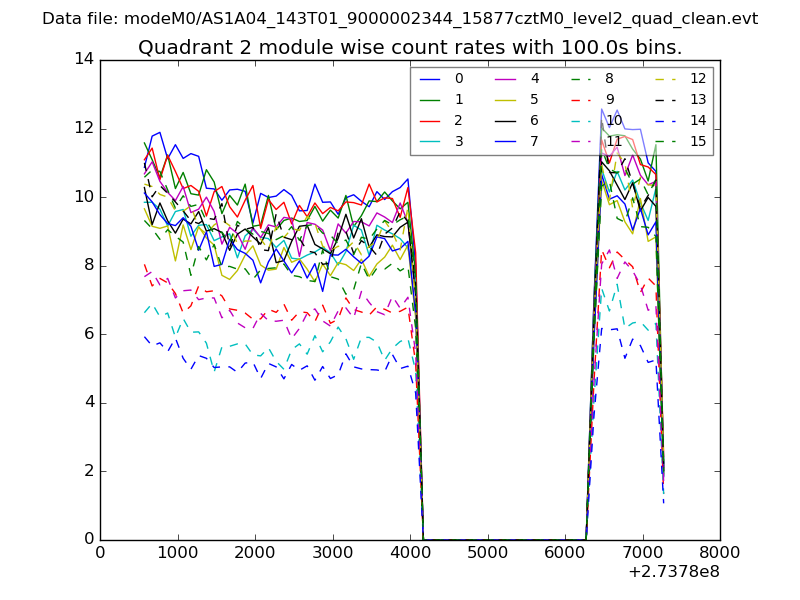
| Module-wise count rates for Quadrant B Data is divided into 100 sec bins |
 |
 |
| Module-wise count rates for Quadrant C Data is divided into 100 sec bins |
 |
 |
| Module-wise count rates for Quadrant D Data is divided into 100 sec bins |
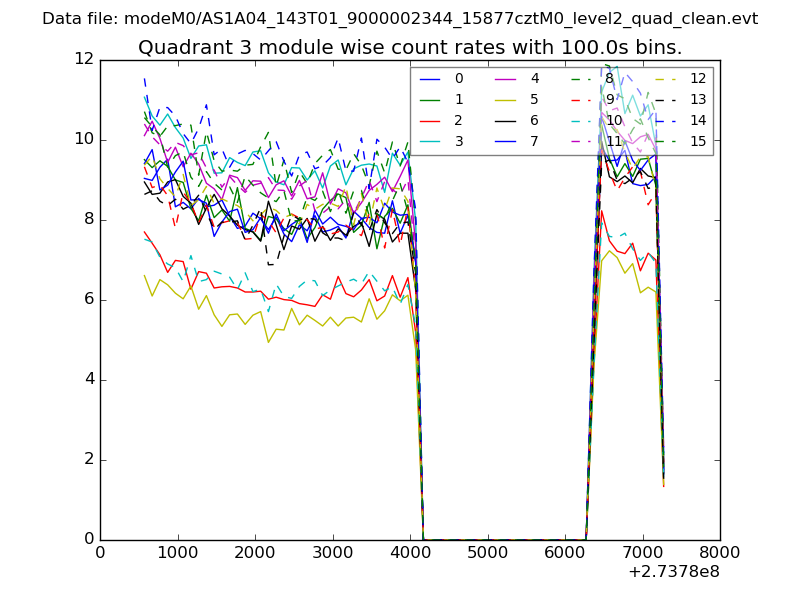 |
 |
| Parameter | Plot |
|---|---|
| CZT HV Monitor | 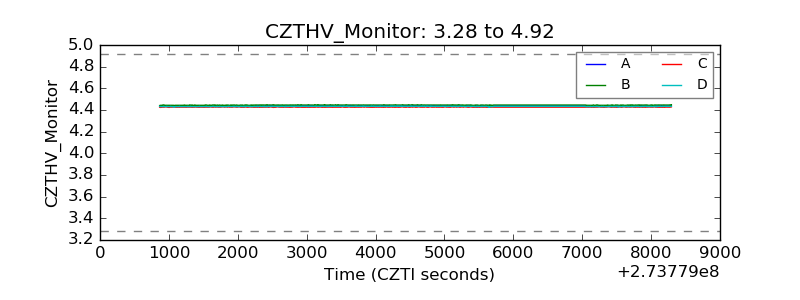 |
| D_VDD | 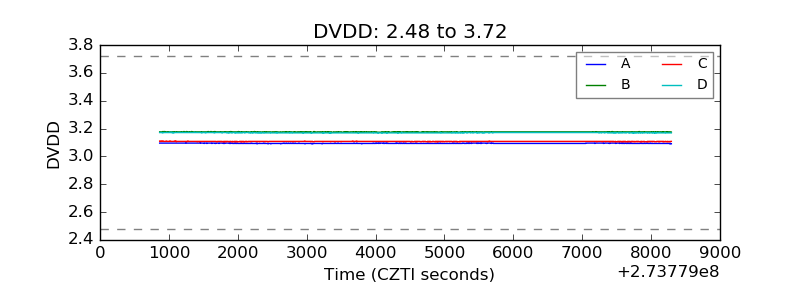 |
| Temperature 1 | 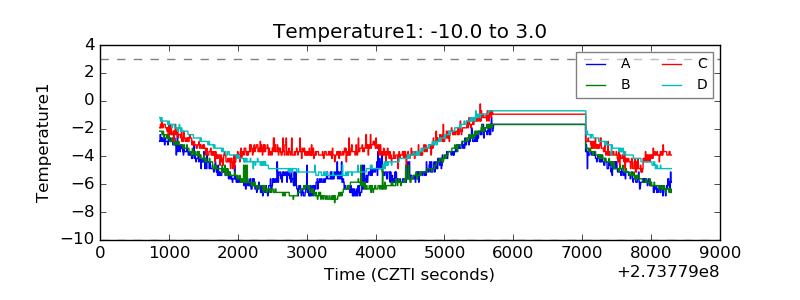 |
| Veto HV Monitor | 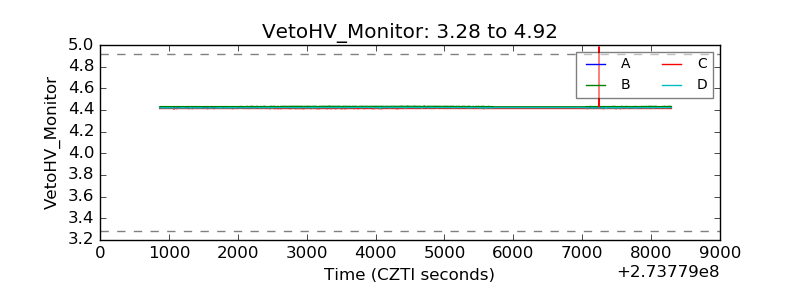 |
| Veto LLD | 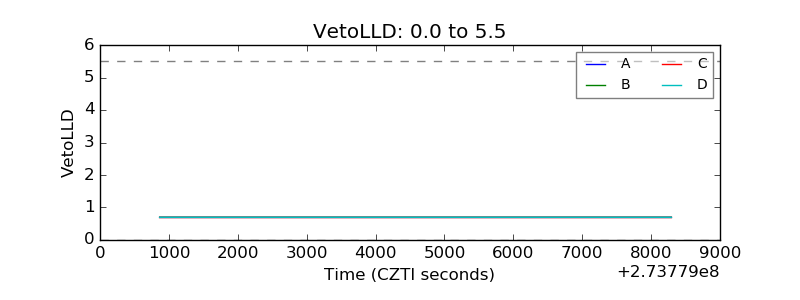 |
| Alpha Counter | 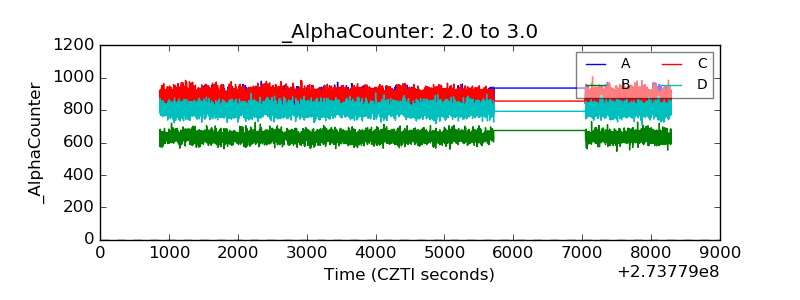 |
| _CPM_Rate | 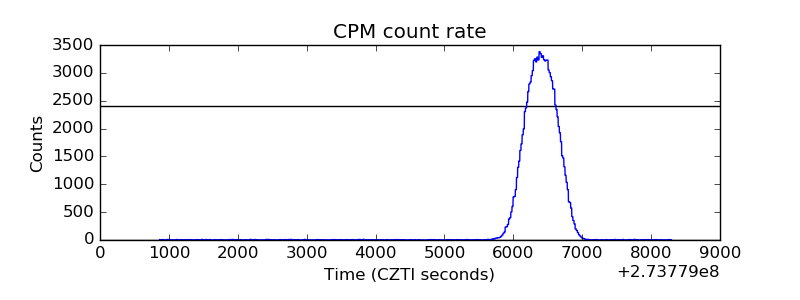 |
| CZT Counter | 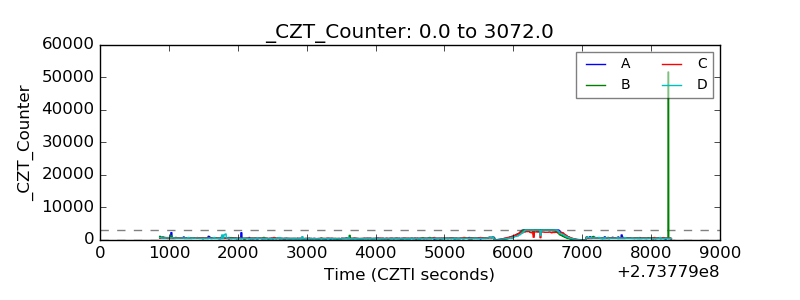 |
| +2.5 Volts monitor |  |
| +5 Volts monitor |  |
| _ROLL_ROT | 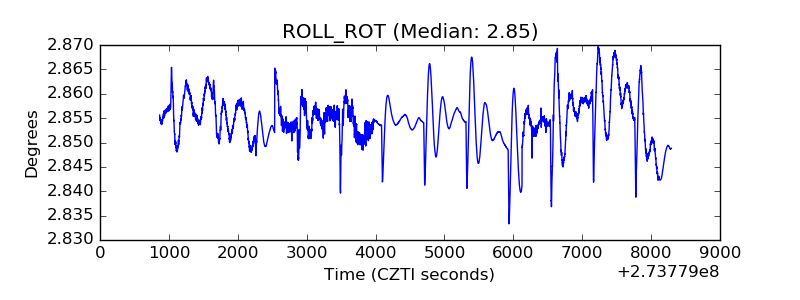 |
| _Roll_DEC | 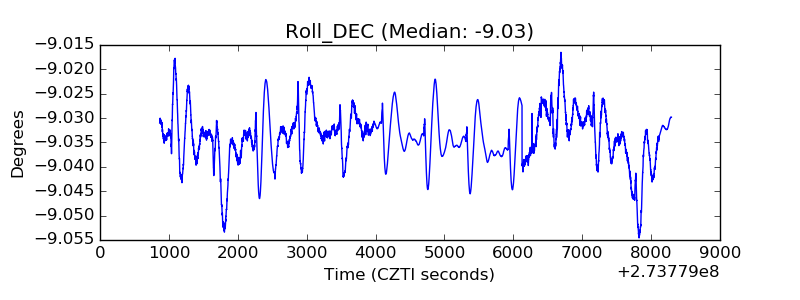 |
| _Roll_RA | 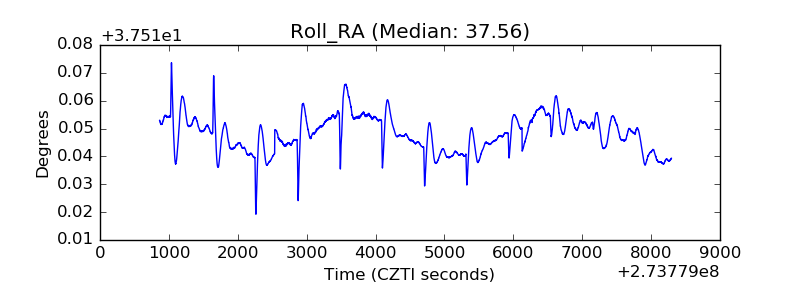 |
| Veto Counter | 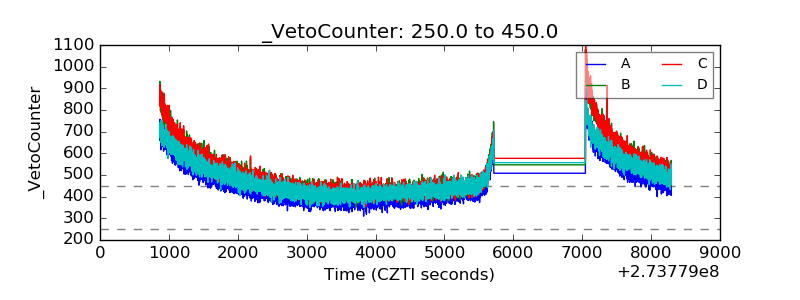 |