| Param | Original file | Final file |
|---|---|---|
| Filename | modeM0/AS1A04_143T01_9000002344_15878cztM0_level2.evt | modeM0/AS1A04_143T01_9000002344_15878cztM0_level2_quad_clean.evt |
| Size (bytes) | 430,830,720 | 106,729,920 |
| Size | 410.9 MB | 101.8 MB |
| Events in quadrant A | 3,151,398 | 702,966 |
| Events in quadrant B | 3,280,014 | 734,404 |
| Events in quadrant C | 3,194,163 | 693,657 |
| Events in quadrant D | 3,007,651 | 675,451 |
| Mode SS | |||
|---|---|---|---|
| Quadrant | BADHDUFLAG | Total packets | Discarded packets |
| A | 0 | 122 | 0 |
| B | 0 | 122 | 0 |
| C | 0 | 122 | 0 |
| D | 0 | 122 | 0 |
| Mode M0 | |||
|---|---|---|---|
| Quadrant | BADHDUFLAG | Total packets | Discarded packets |
| A | 0 | 13202 | 3 |
| B | 0 | 13601 | 2 |
| C | 0 | 13243 | 2 |
| D | 0 | 12918 | 2 |
| Mode M9 | |||
|---|---|---|---|
| Quadrant | BADHDUFLAG | Total packets | Discarded packets |
| A | 0 | 26 | 0 |
| B | 0 | 26 | 0 |
| C | 0 | 26 | 0 |
| D | 0 | 27 | 0 |
| Quadrant | Total seconds | Saturated seconds | Saturation percentage |
|---|---|---|---|
| A | 6108 | 18 | 0.294695% |
| B | 6108 | 35 | 0.573019% |
| C | 6108 | 62 | 1.015062% |
| D | 6108 | 15 | 0.245580% |
Noise dominated data is calculated using 1-second bins in cleaned event files. If a bin has >2000 counts, and if more than 50% of those come from <1% of pixels, then it is considered to be noise-dominated and hence unusable.
| Quadrant | # 1 sec bins | Bins with >0 counts | Bins with >2000 counts | High rate bins dominated by noise | Noise dominated (total time) | Noise dominated (detector-on time) | Marked lightcurve |
|---|---|---|---|---|---|---|---|
| A | 7539 | 6110 | 0 | 0 | 0.00% | 0.00% | 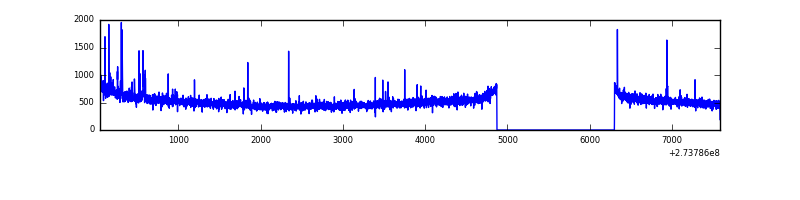 |
| B | 7539 | 6110 | 3 | 3 | 0.04% | 0.05% | 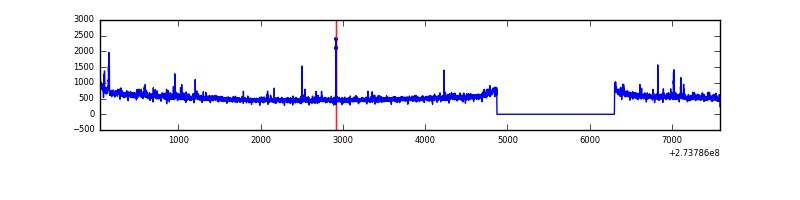 |
| C | 7539 | 6110 | 0 | 0 | 0.00% | 0.00% | 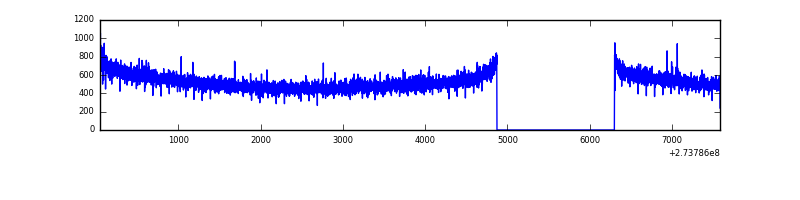 |
| D | 7539 | 6110 | 3 | 3 | 0.04% | 0.05% | 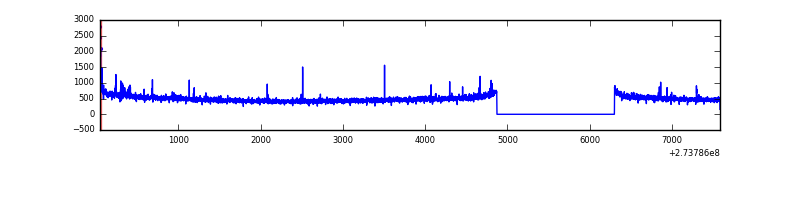 |
Top three noisy pixels from each quadrant. If the there are fewer than three noisy pixels in the level2.evt file, extra rows are filled as -1
| Pixel properties | Quadrant properties | ||||||
|---|---|---|---|---|---|---|---|
| Quadrant | DetID | PixID | Counts | Sigma | Mean | Median | Sigma |
| A | 15 | 239 | 57303 | 353.18 | 799 | 784 | 160.0 |
| A | 12 | 96 | 11551 | 67.28 | 799 | 784 | 160.0 |
| A | 0 | 226 | 7217 | 40.2 | 799 | 784 | 160.0 |
| B | 4 | 173 | 26511 | 168.59 | 813 | 795 | 152.5 |
| B | 12 | 111 | 17224 | 107.7 | 813 | 795 | 152.5 |
| B | 11 | 111 | 14478 | 89.7 | 813 | 795 | 152.5 |
| C | 14 | 238 | 120975 | 663.63 | 780 | 789 | 181.1 |
| C | 3 | 233 | 15150 | 79.3 | 780 | 789 | 181.1 |
| C | 0 | 207 | 11374 | 58.45 | 780 | 789 | 181.1 |
| D | 1 | 52 | 27686 | 141.04 | 782 | 761 | 190.9 |
| D | 2 | 234 | 24035 | 121.92 | 782 | 761 | 190.9 |
| D | 12 | 218 | 15104 | 75.13 | 782 | 761 | 190.9 |
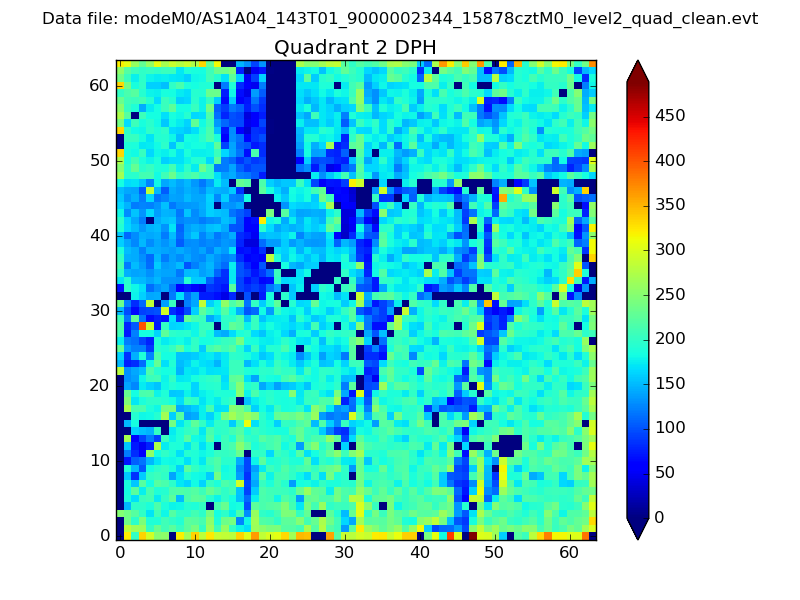
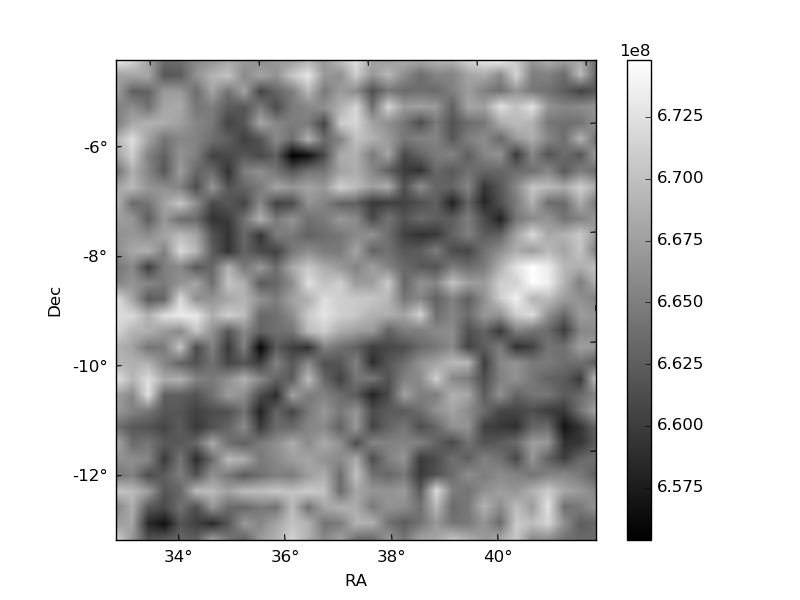
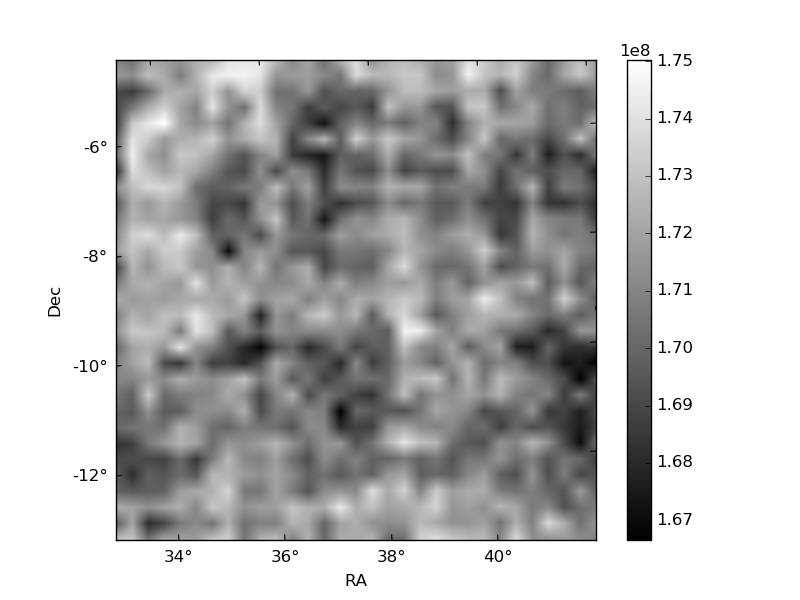
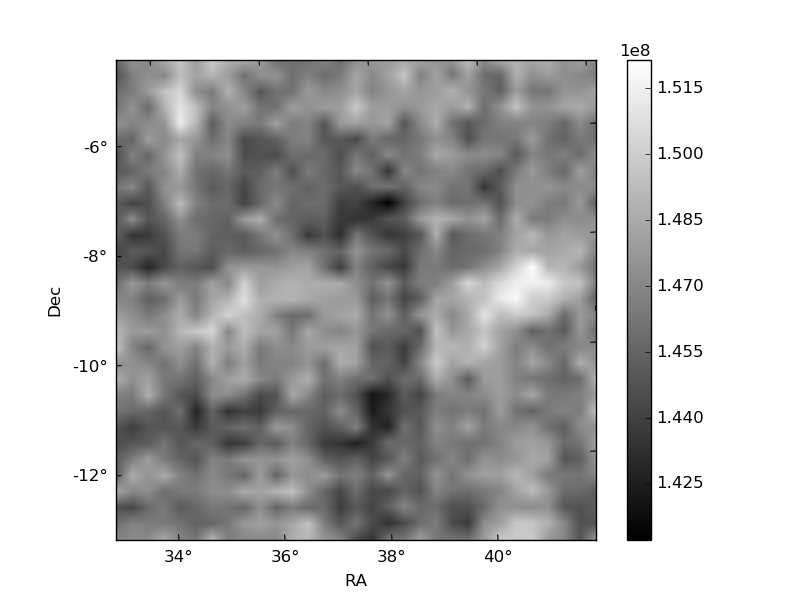
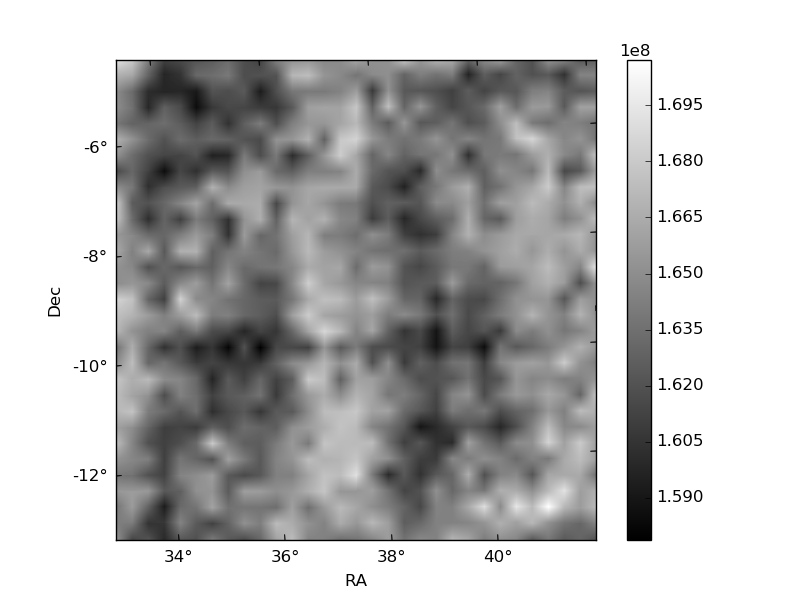
Histogram calculated using DETX and DETY for each event in the final _common_clean file
| Quadrant A | 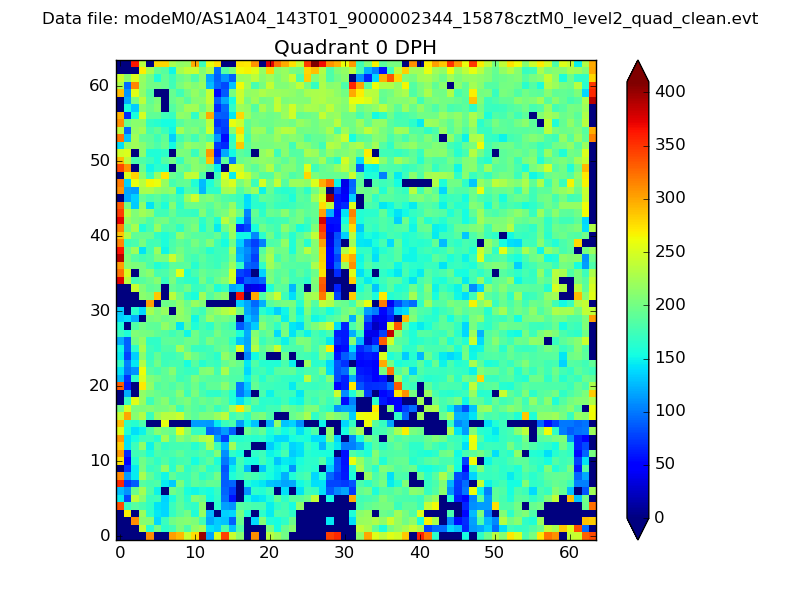 |
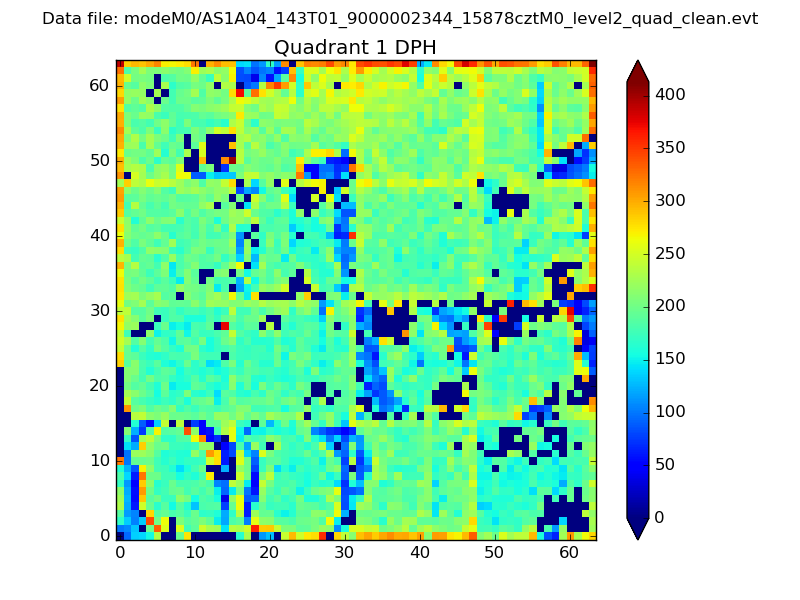 |
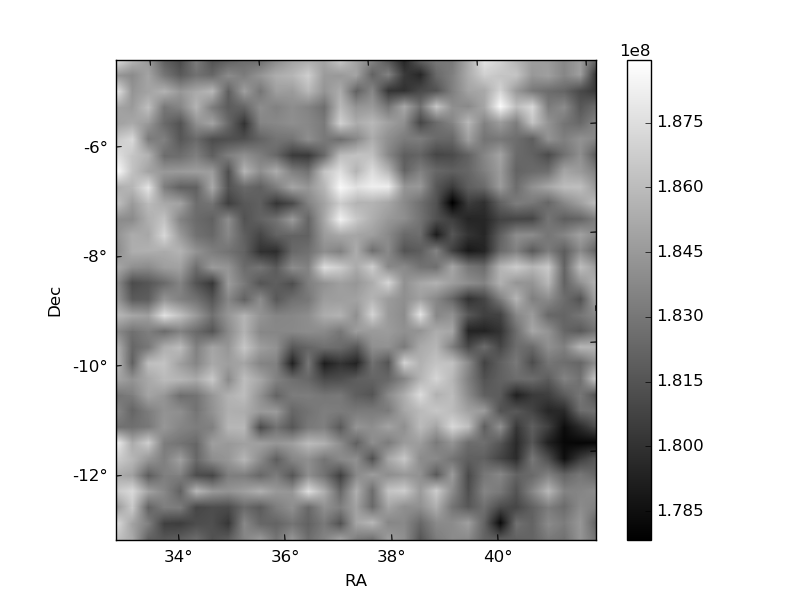
Quadrant B |
|---|---|---|---|
| Quadrant D | 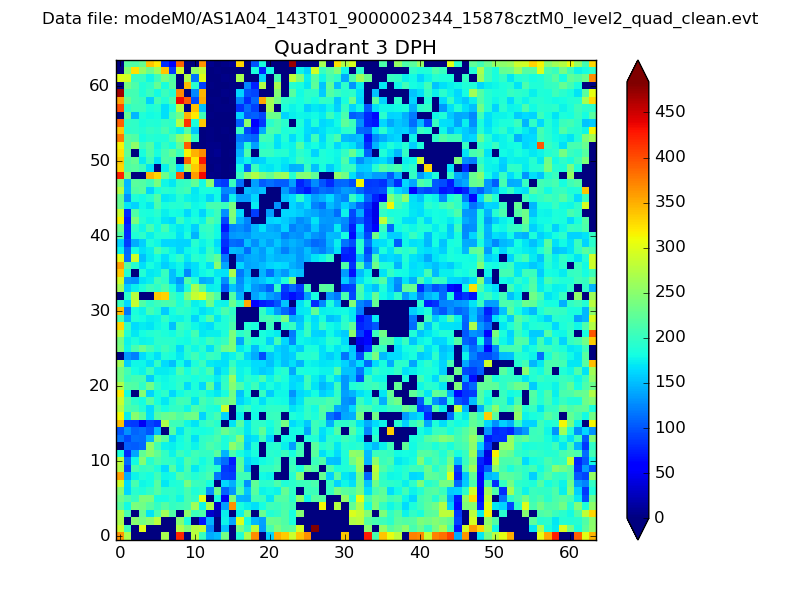 |
 |
Quadrant C |
| Plot type | Count rate plots | Images |
|---|---|---|
| Comparison with Poisson distribution Blue bars denote a histogram of data divided into 1 sec bins. Red curve is a Poisson curve with rate = median count rate of data. |
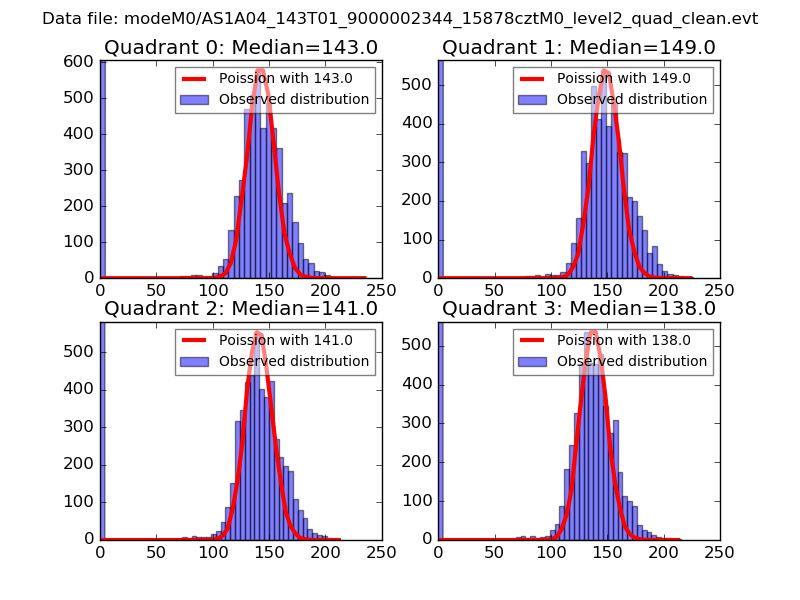 |
 |
| Quadrant-wise count rates Data is divided into 100 sec bins |
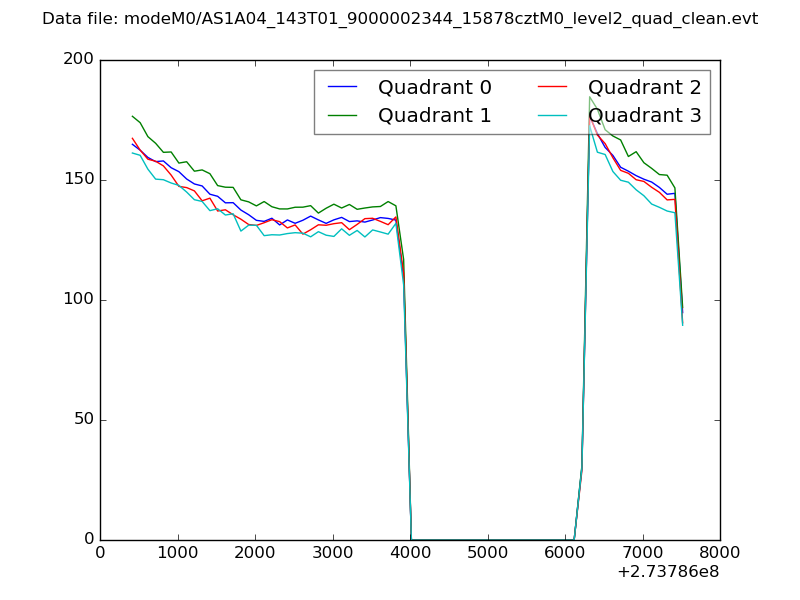 |
|
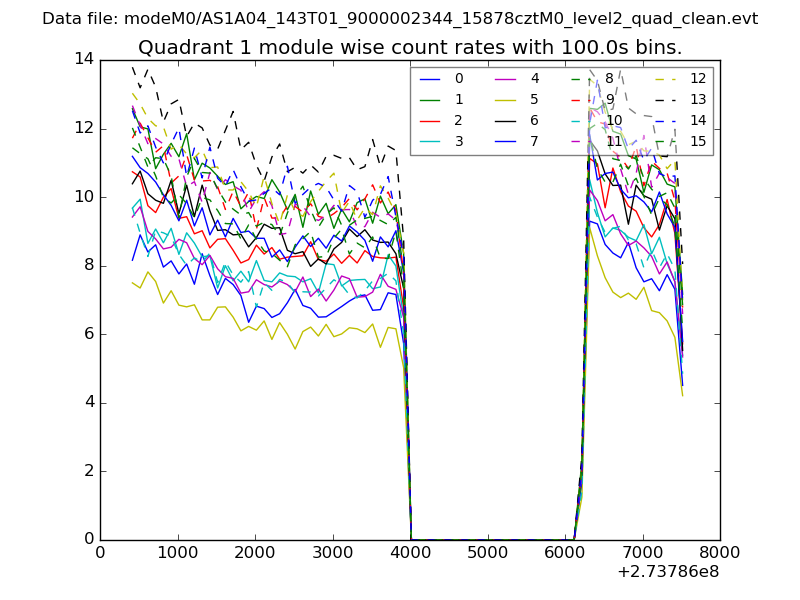
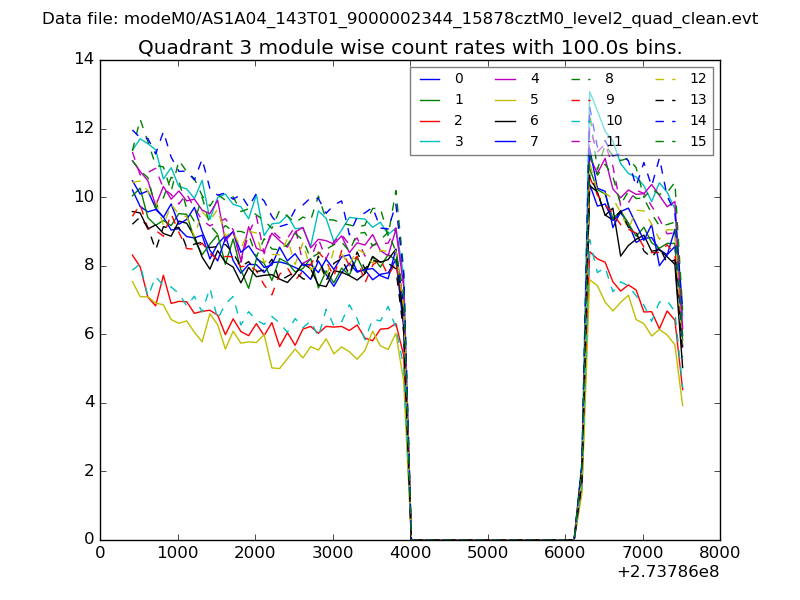
| Module-wise count rates for Quadrant A Data is divided into 100 sec bins |
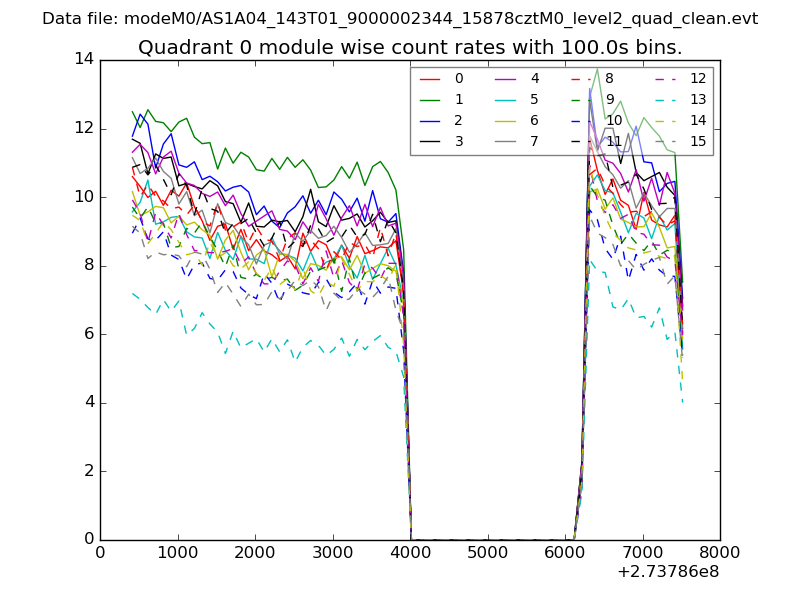 |
 |
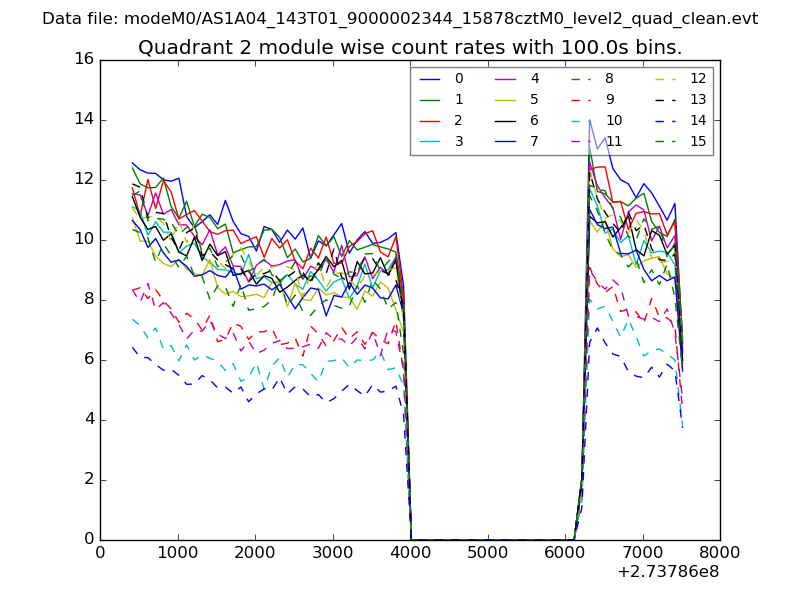
| Module-wise count rates for Quadrant B Data is divided into 100 sec bins |
 |
 |
| Module-wise count rates for Quadrant C Data is divided into 100 sec bins |
 |
 |
| Module-wise count rates for Quadrant D Data is divided into 100 sec bins |
 |
 |
| Parameter | Plot |
|---|---|
| CZT HV Monitor | 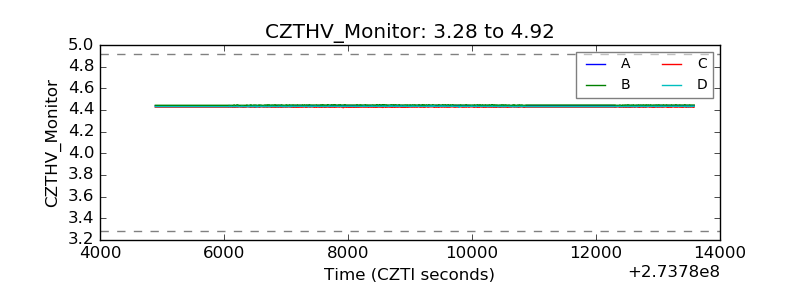 |
| D_VDD | 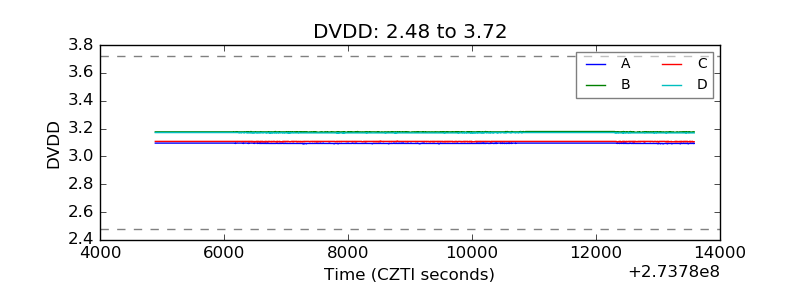 |
| Temperature 1 | 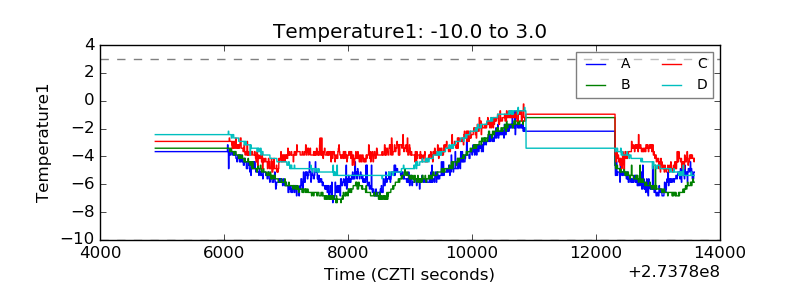 |
| Veto HV Monitor | 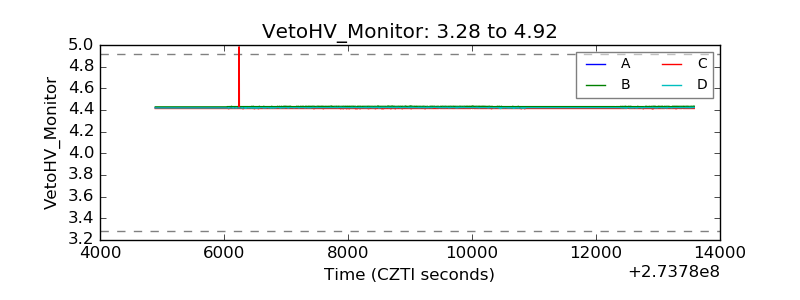 |
| Veto LLD | 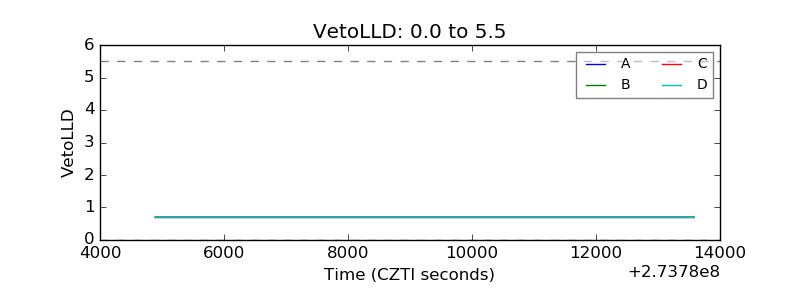 |
| Alpha Counter | 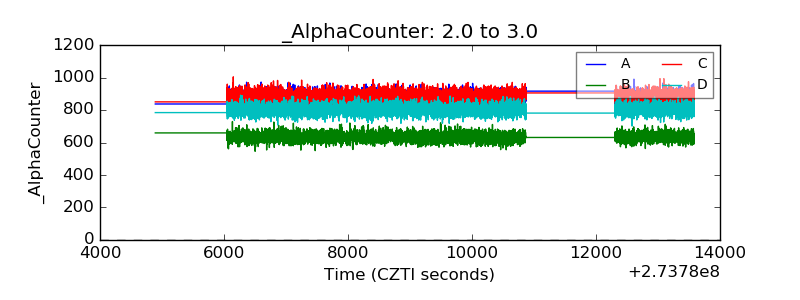 |
| _CPM_Rate | 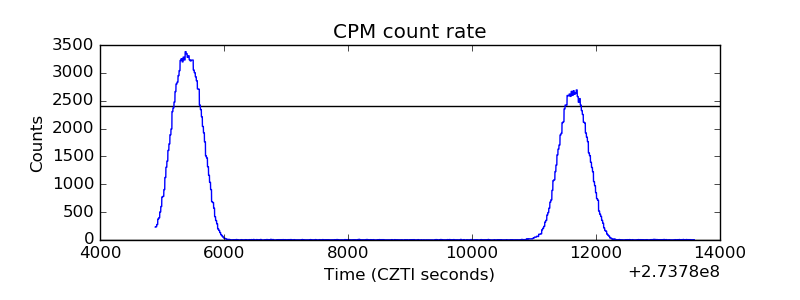 |
| CZT Counter | 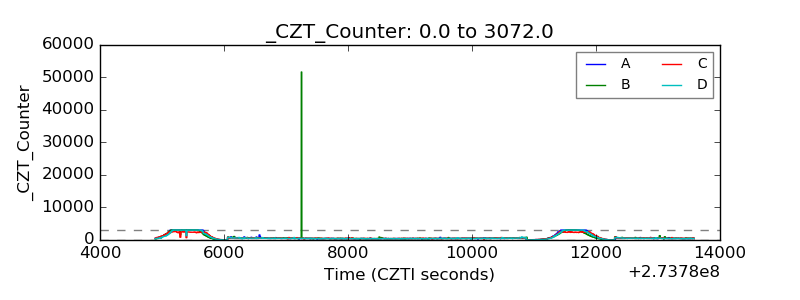 |
| +2.5 Volts monitor |  |
| +5 Volts monitor |  |
| _ROLL_ROT | 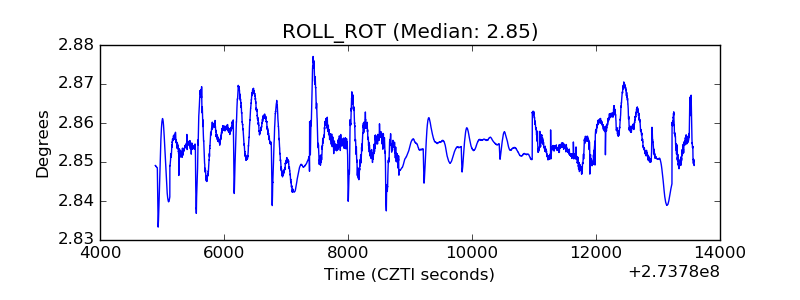 |
| _Roll_DEC | 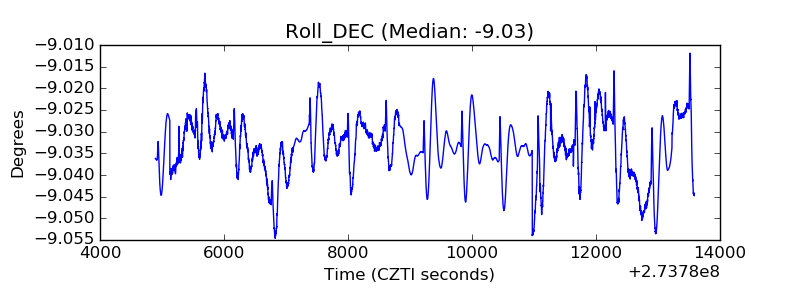 |
| _Roll_RA | 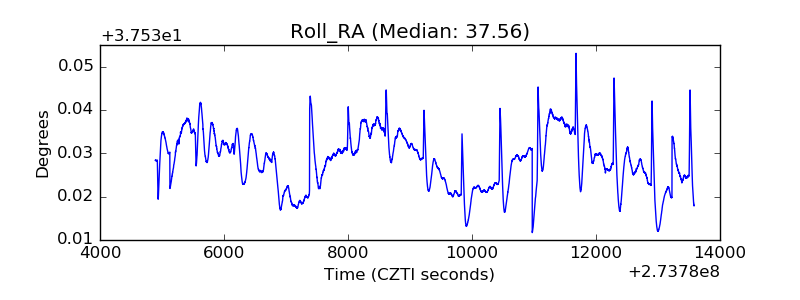 |
| Veto Counter | 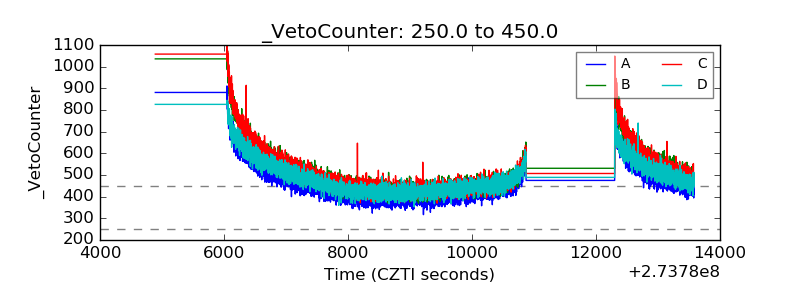 |