| Param | Original file | Final file |
|---|---|---|
| Filename | modeM0/AS1A04_143T01_9000002344_15879cztM0_level2.evt | modeM0/AS1A04_143T01_9000002344_15879cztM0_level2_quad_clean.evt |
| Size (bytes) | 490,132,800 | 102,597,120 |
| Size | 467.4 MB | 97.8 MB |
| Events in quadrant A | 4,318,386 | 634,665 |
| Events in quadrant B | 3,474,614 | 703,323 |
| Events in quadrant C | 3,407,028 | 664,886 |
| Events in quadrant D | 3,199,620 | 648,248 |
| Mode SS | |||
|---|---|---|---|
| Quadrant | BADHDUFLAG | Total packets | Discarded packets |
| A | 0 | 134 | 0 |
| B | 0 | 134 | 0 |
| C | 0 | 134 | 0 |
| D | 0 | 134 | 0 |
| Mode M0 | |||
|---|---|---|---|
| Quadrant | BADHDUFLAG | Total packets | Discarded packets |
| A | 0 | 16994 | 3 |
| B | 0 | 14438 | 2 |
| C | 0 | 14199 | 2 |
| D | 0 | 13834 | 2 |
| Mode M9 | |||
|---|---|---|---|
| Quadrant | BADHDUFLAG | Total packets | Discarded packets |
| A | 0 | 29 | 0 |
| B | 0 | 29 | 0 |
| C | 0 | 29 | 0 |
| D | 0 | 29 | 0 |
| Quadrant | Total seconds | Saturated seconds | Saturation percentage |
|---|---|---|---|
| A | 6547 | 510 | 7.789827% |
| B | 6547 | 79 | 1.206660% |
| C | 6547 | 81 | 1.237208% |
| D | 6547 | 25 | 0.381854% |
Noise dominated data is calculated using 1-second bins in cleaned event files. If a bin has >2000 counts, and if more than 50% of those come from <1% of pixels, then it is considered to be noise-dominated and hence unusable.
| Quadrant | # 1 sec bins | Bins with >0 counts | Bins with >2000 counts | High rate bins dominated by noise | Noise dominated (total time) | Noise dominated (detector-on time) | Marked lightcurve |
|---|---|---|---|---|---|---|---|
| A | 9313 | 6551 | 435 | 435 | 4.67% | 6.64% | 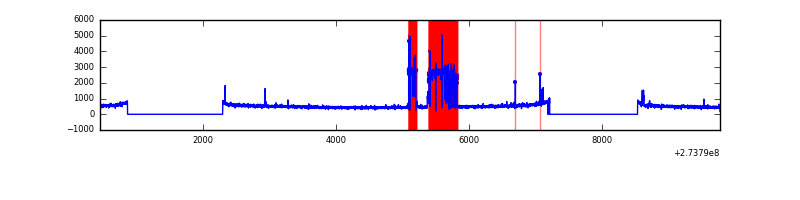 |
| B | 9313 | 6551 | 1 | 1 | 0.01% | 0.02% | 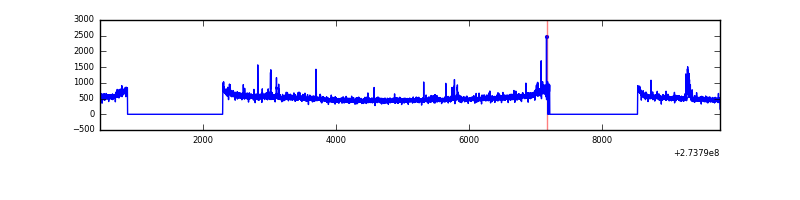 |
| C | 9313 | 6551 | 1 | 1 | 0.01% | 0.02% | 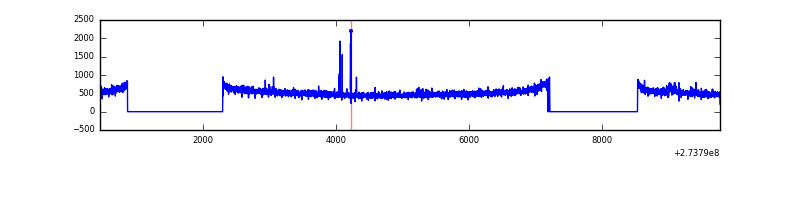 |
| D | 9313 | 6551 | 4 | 4 | 0.04% | 0.06% | 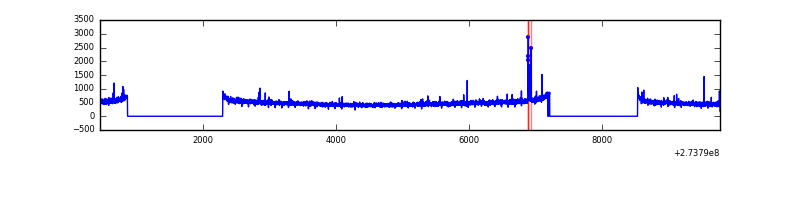 |
Top three noisy pixels from each quadrant. If the there are fewer than three noisy pixels in the level2.evt file, extra rows are filled as -1
| Pixel properties | Quadrant properties | ||||||
|---|---|---|---|---|---|---|---|
| Quadrant | DetID | PixID | Counts | Sigma | Mean | Median | Sigma |
| A | 15 | 239 | 1175764 | 7158.3 | 814 | 797 | 164.1 |
| A | 12 | 96 | 8785 | 48.67 | 814 | 797 | 164.1 |
| A | 0 | 226 | 7133 | 38.6 | 814 | 797 | 164.1 |
| B | 4 | 173 | 62812 | 382.13 | 860 | 840 | 162.2 |
| B | 12 | 111 | 18414 | 108.36 | 860 | 840 | 162.2 |
| B | 11 | 111 | 15699 | 91.62 | 860 | 840 | 162.2 |
| C | 14 | 238 | 126046 | 652.32 | 825 | 833 | 192.0 |
| C | 10 | 22 | 30224 | 153.12 | 825 | 833 | 192.0 |
| C | 0 | 207 | 18649 | 92.82 | 825 | 833 | 192.0 |
| D | 13 | 172 | 36160 | 175.72 | 827 | 805 | 201.2 |
| D | 1 | 52 | 29983 | 145.02 | 827 | 805 | 201.2 |
| D | 2 | 234 | 24793 | 119.22 | 827 | 805 | 201.2 |
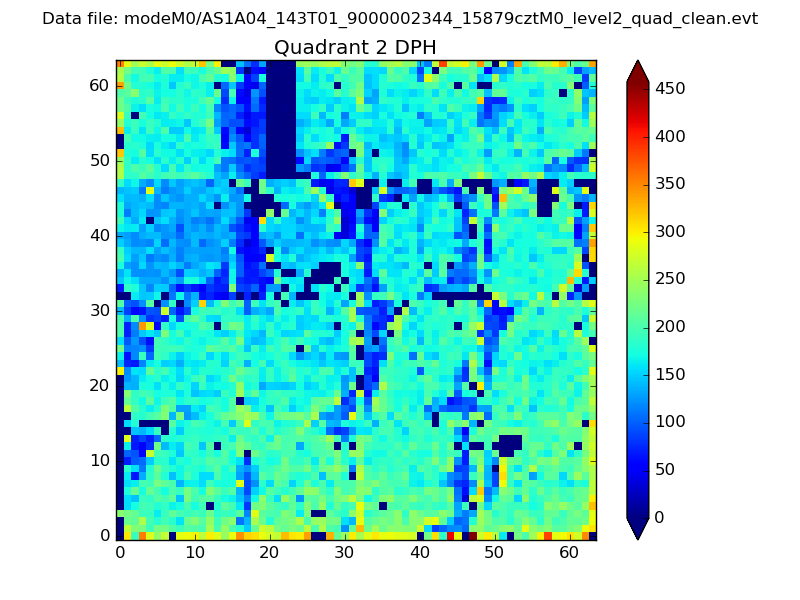
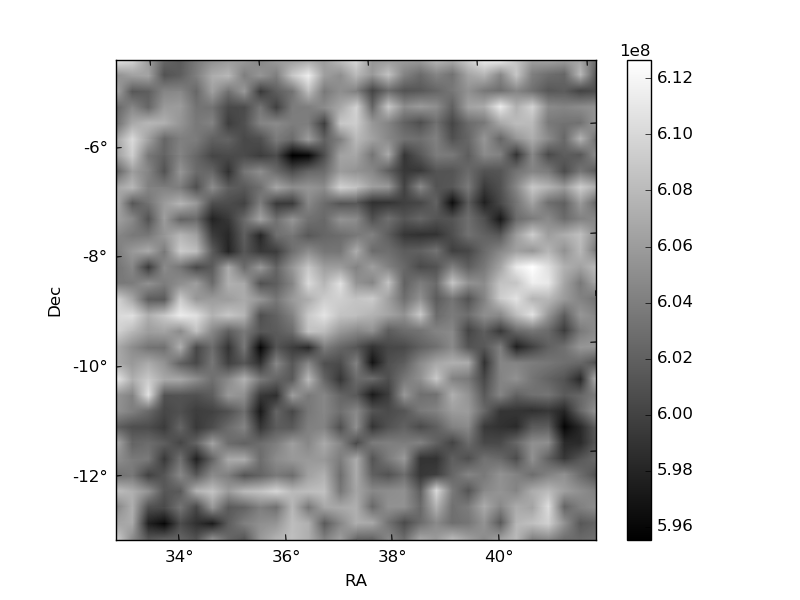
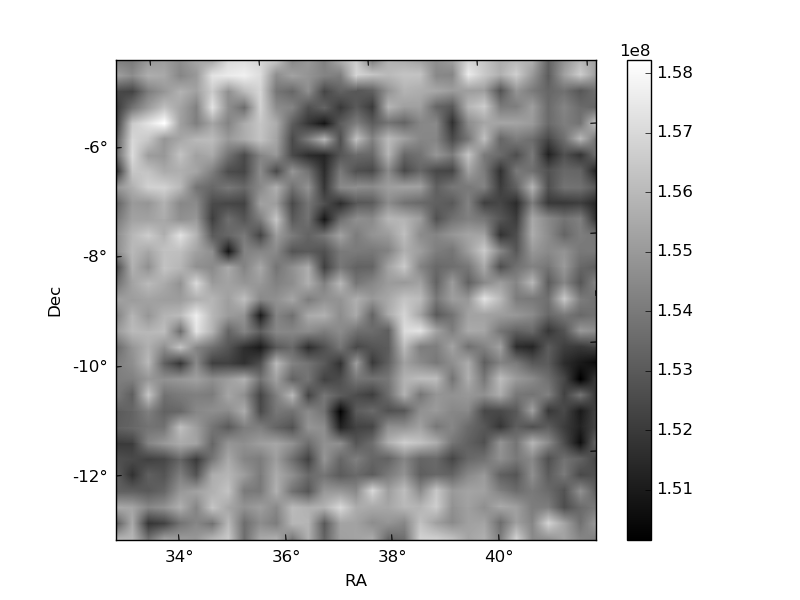
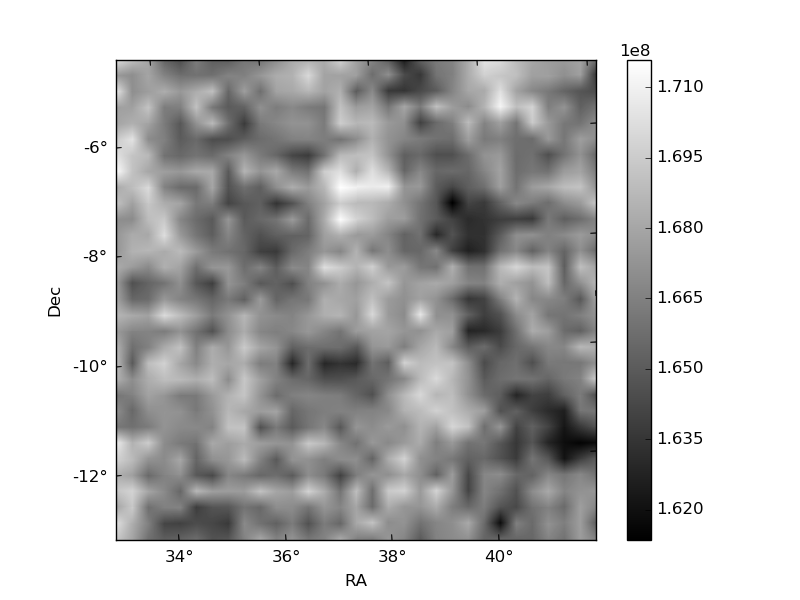
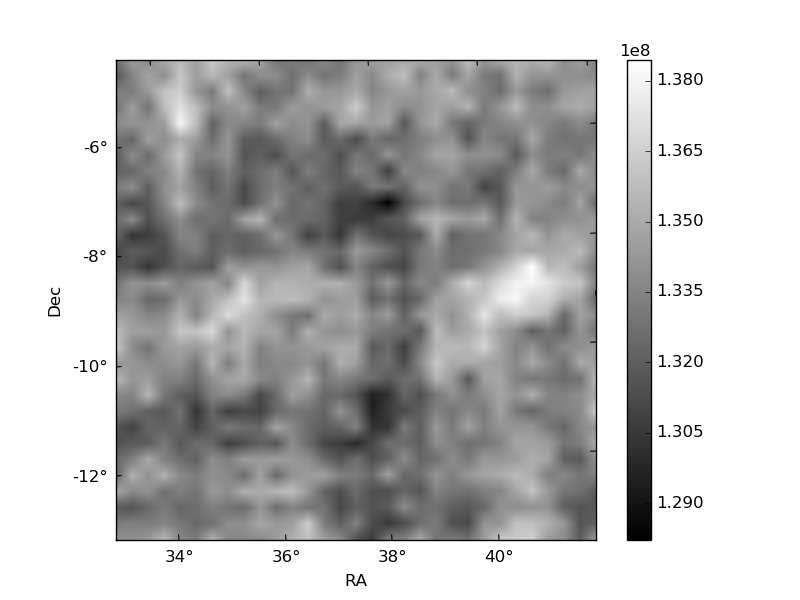
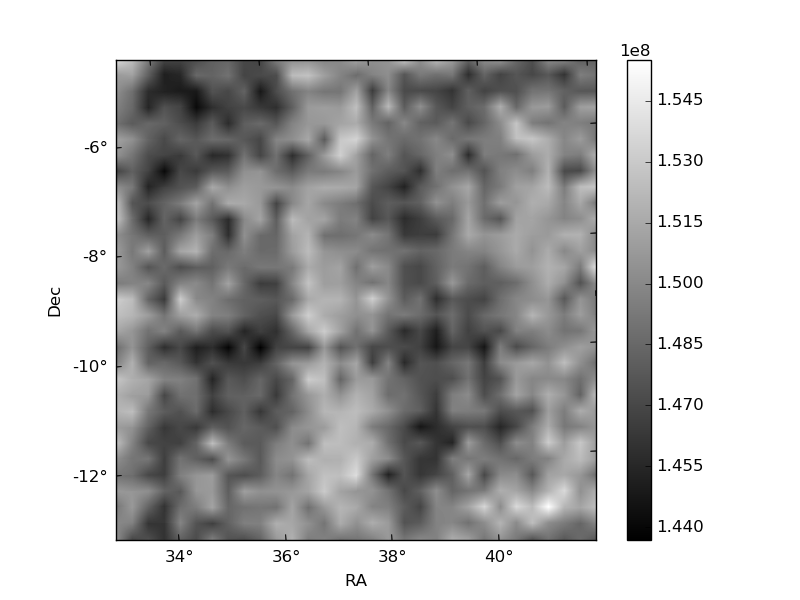
Histogram calculated using DETX and DETY for each event in the final _common_clean file
| Quadrant A | 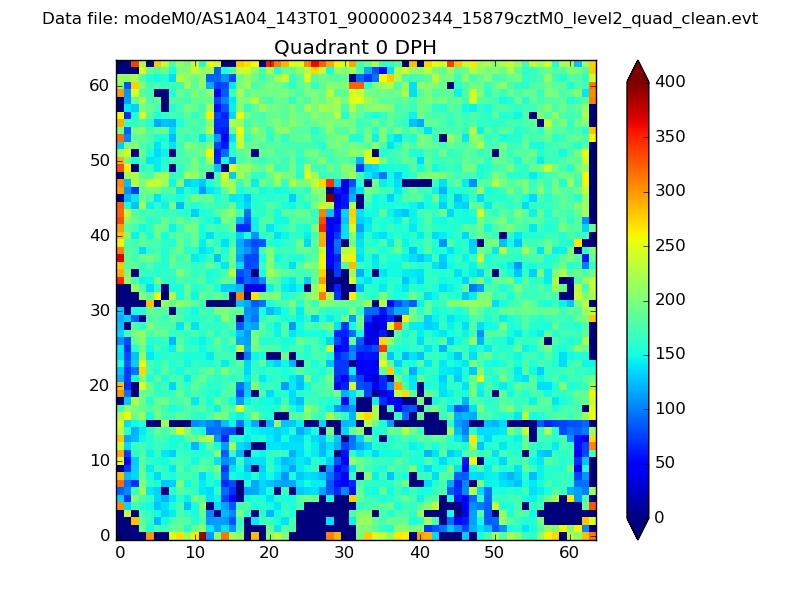 |
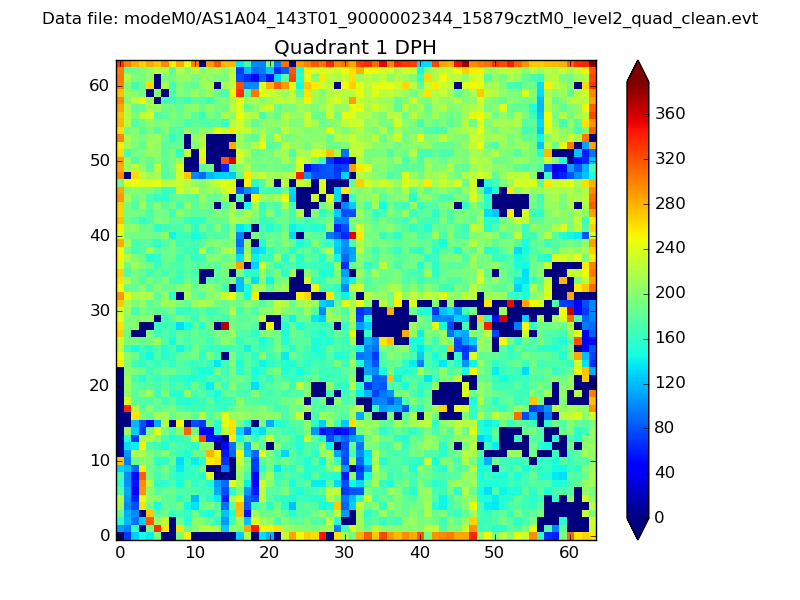 |
Quadrant B |
|---|---|---|---|
| Quadrant D | 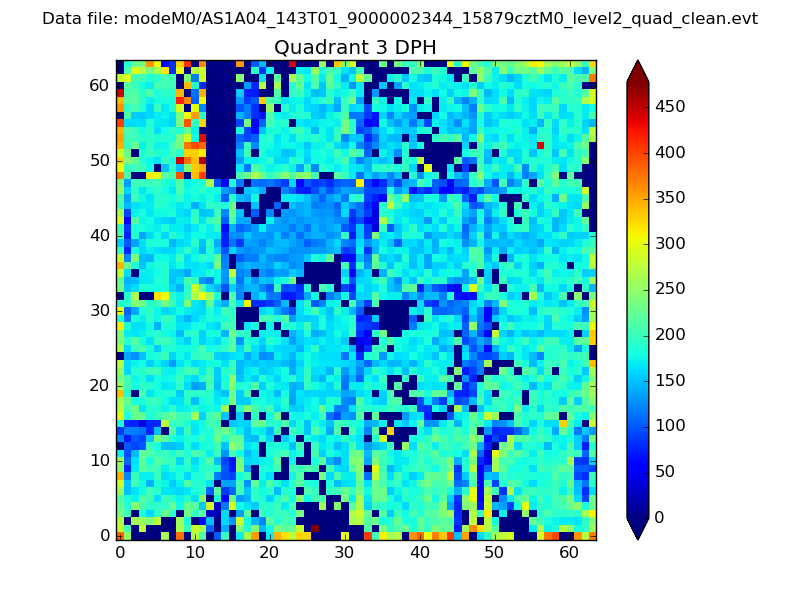 |
 |
Quadrant C |
| Plot type | Count rate plots | Images |
|---|---|---|
| Comparison with Poisson distribution Blue bars denote a histogram of data divided into 1 sec bins. Red curve is a Poisson curve with rate = median count rate of data. |
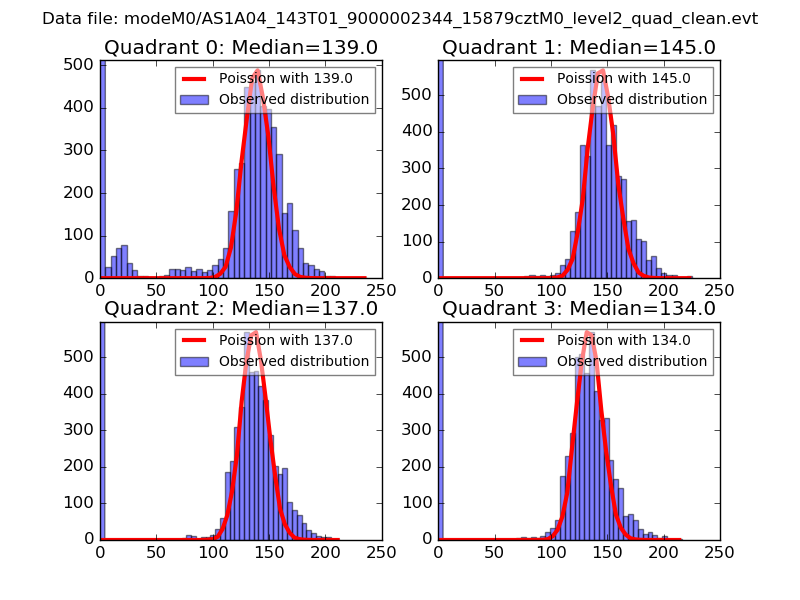 |
 |
| Quadrant-wise count rates Data is divided into 100 sec bins |
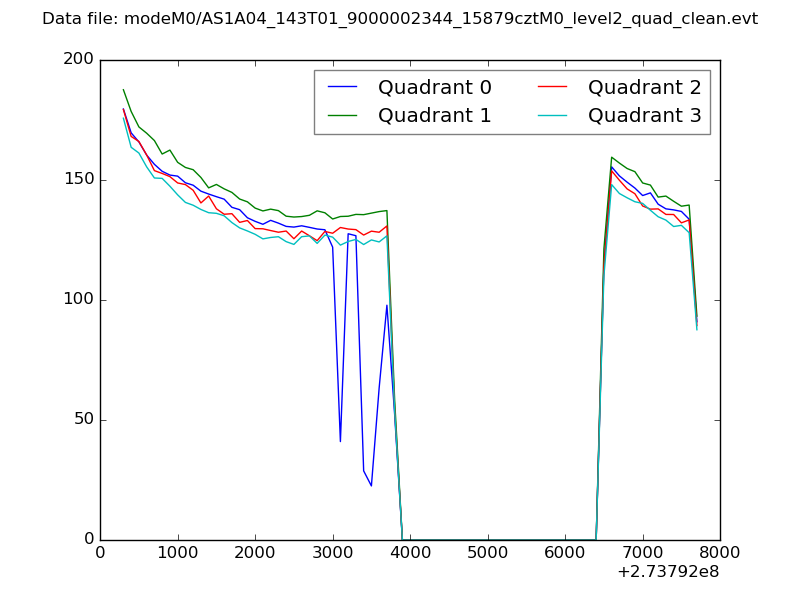 |
|
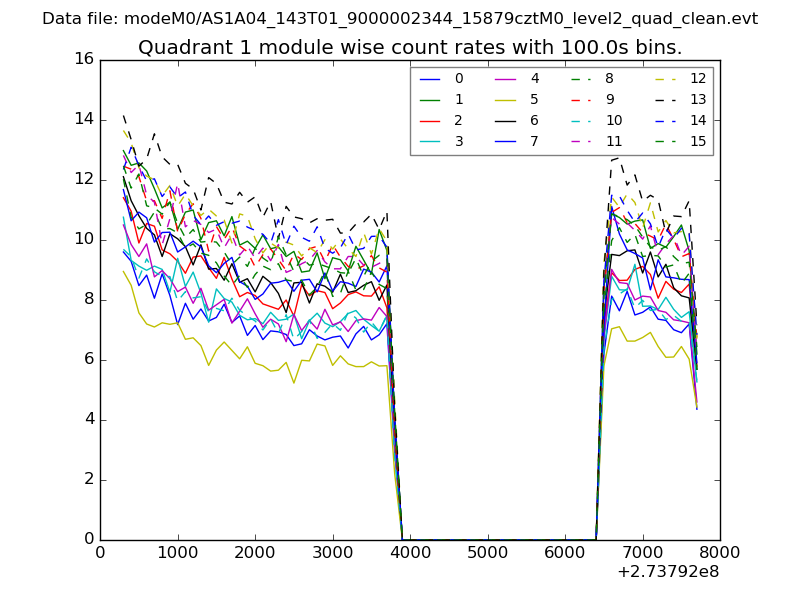
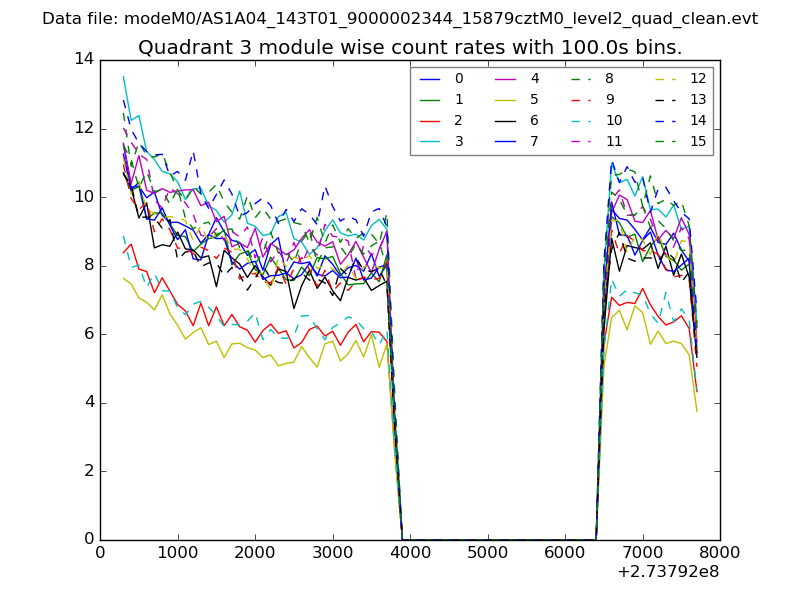
| Module-wise count rates for Quadrant A Data is divided into 100 sec bins |
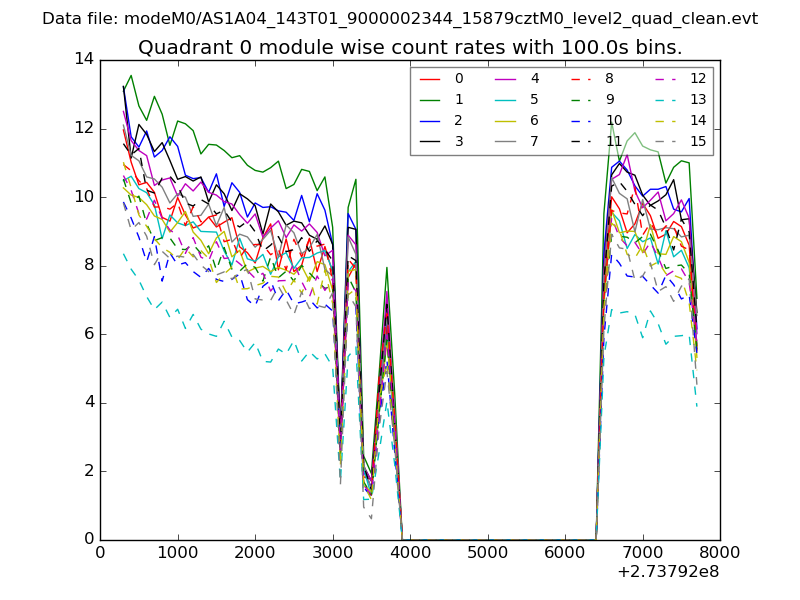 |
 |
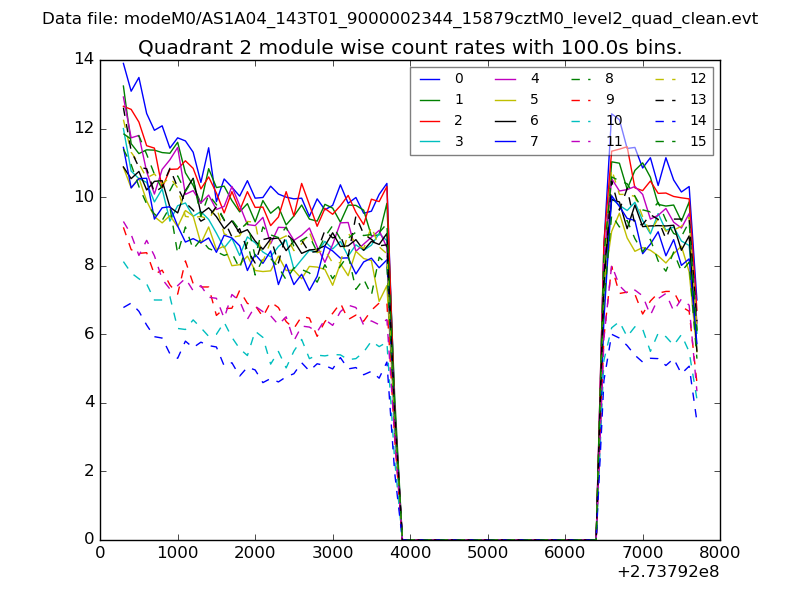
| Module-wise count rates for Quadrant B Data is divided into 100 sec bins |
 |
 |
| Module-wise count rates for Quadrant C Data is divided into 100 sec bins |
 |
 |
| Module-wise count rates for Quadrant D Data is divided into 100 sec bins |
 |
 |
| Parameter | Plot |
|---|---|
| CZT HV Monitor | 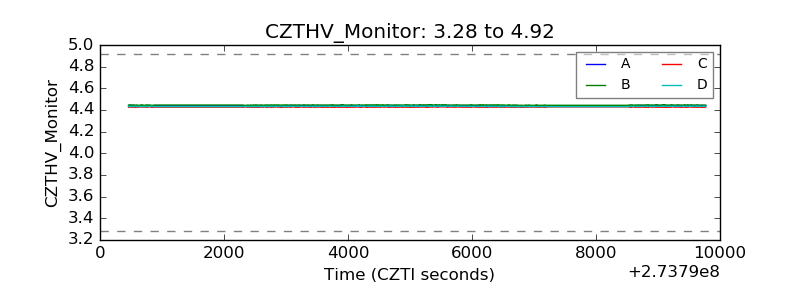 |
| D_VDD | 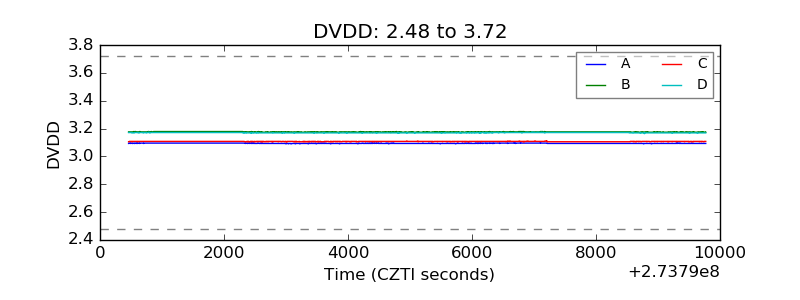 |
| Temperature 1 | 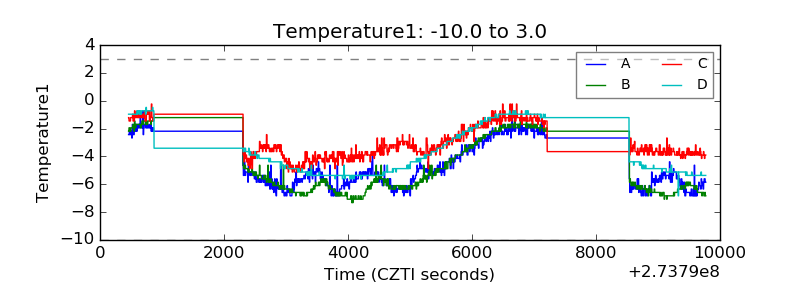 |
| Veto HV Monitor | 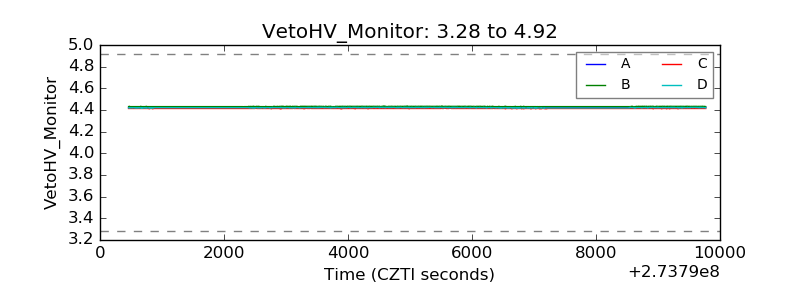 |
| Veto LLD | 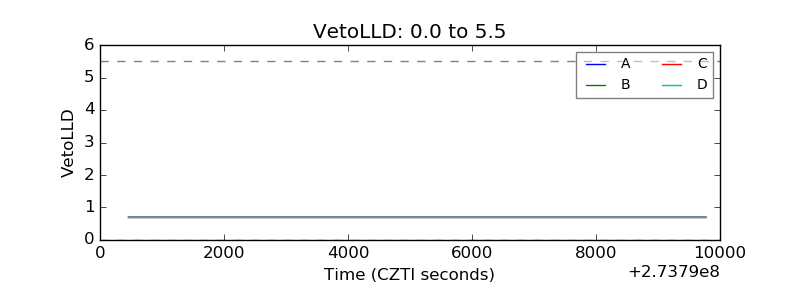 |
| Alpha Counter | 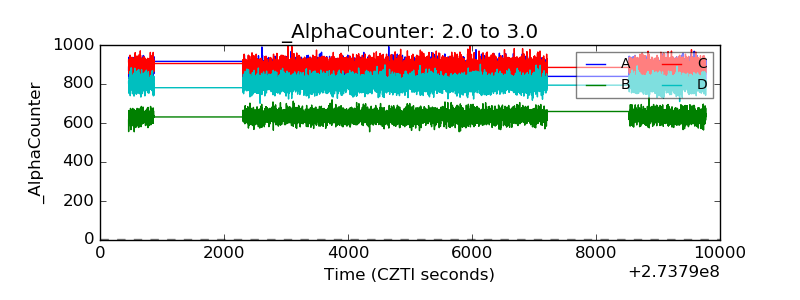 |
| _CPM_Rate |  |
| CZT Counter | 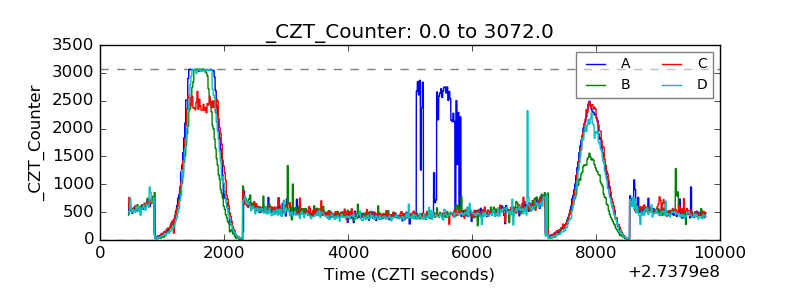 |
| +2.5 Volts monitor |  |
| +5 Volts monitor |  |
| _ROLL_ROT | 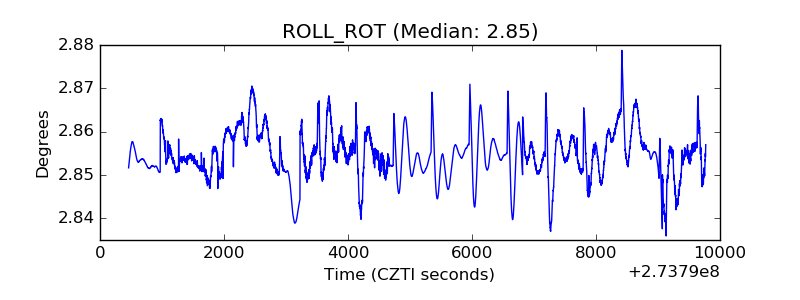 |
| _Roll_DEC | 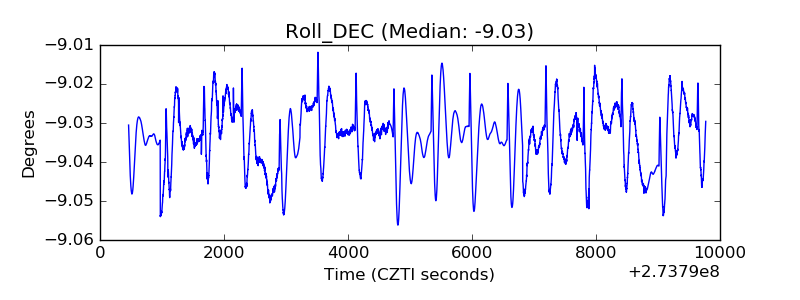 |
| _Roll_RA | 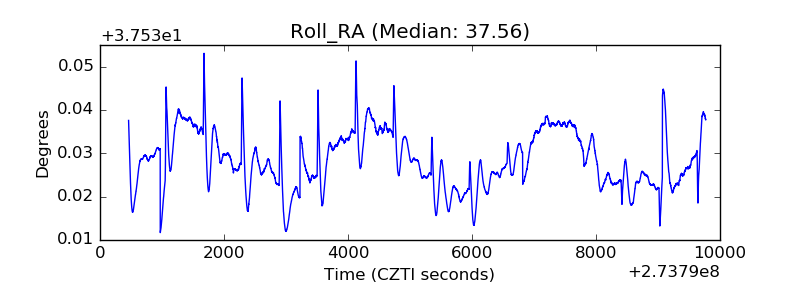 |
| Veto Counter | 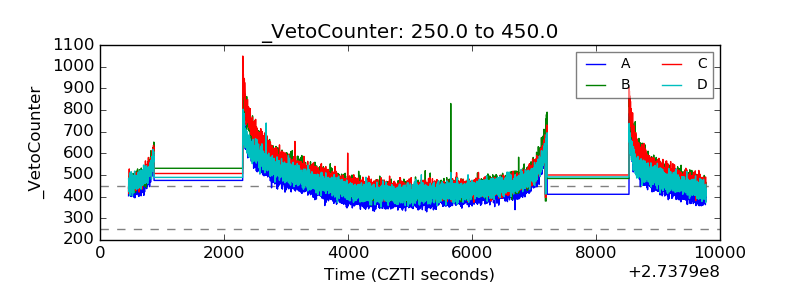 |