| Param | Original file | Final file |
|---|---|---|
| Filename | modeM0/AS1A04_143T01_9000002344_15880cztM0_level2.evt | modeM0/AS1A04_143T01_9000002344_15880cztM0_level2_quad_clean.evt |
| Size (bytes) | 457,611,840 | 92,263,680 |
| Size | 436.4 MB | 88.0 MB |
| Events in quadrant A | 3,403,824 | 588,811 |
| Events in quadrant B | 3,216,910 | 612,052 |
| Events in quadrant C | 3,228,755 | 580,588 |
| Events in quadrant D | 3,573,745 | 565,564 |
| Mode SS | |||
|---|---|---|---|
| Quadrant | BADHDUFLAG | Total packets | Discarded packets |
| A | 0 | 130 | 0 |
| B | 0 | 130 | 0 |
| C | 0 | 130 | 0 |
| D | 0 | 130 | 0 |
| Mode M0 | |||
|---|---|---|---|
| Quadrant | BADHDUFLAG | Total packets | Discarded packets |
| A | 0 | 14295 | 3 |
| B | 0 | 13625 | 2 |
| C | 0 | 13642 | 2 |
| D | 0 | 15134 | 2 |
| Mode M9 | |||
|---|---|---|---|
| Quadrant | BADHDUFLAG | Total packets | Discarded packets |
| A | 0 | 19 | 0 |
| B | 0 | 19 | 0 |
| C | 0 | 19 | 0 |
| D | 0 | 20 | 0 |
| Quadrant | Total seconds | Saturated seconds | Saturation percentage |
|---|---|---|---|
| A | 6409 | 101 | 1.575909% |
| B | 6409 | 65 | 1.014199% |
| C | 6409 | 51 | 0.795756% |
| D | 6409 | 204 | 3.183024% |
Noise dominated data is calculated using 1-second bins in cleaned event files. If a bin has >2000 counts, and if more than 50% of those come from <1% of pixels, then it is considered to be noise-dominated and hence unusable.
| Quadrant | # 1 sec bins | Bins with >0 counts | Bins with >2000 counts | High rate bins dominated by noise | Noise dominated (total time) | Noise dominated (detector-on time) | Marked lightcurve |
|---|---|---|---|---|---|---|---|
| A | 7535 | 6411 | 39 | 39 | 0.52% | 0.61% | 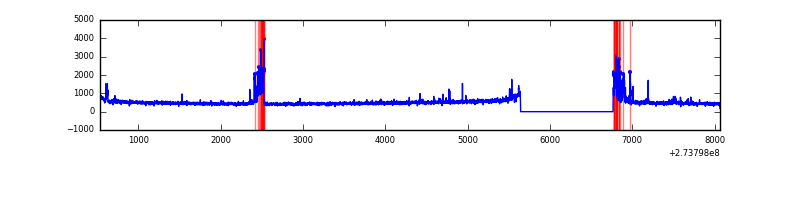 |
| B | 7535 | 6411 | 3 | 3 | 0.04% | 0.05% | 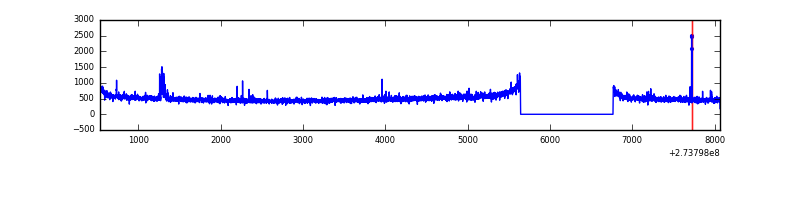 |
| C | 7535 | 6411 | 2 | 2 | 0.03% | 0.03% | 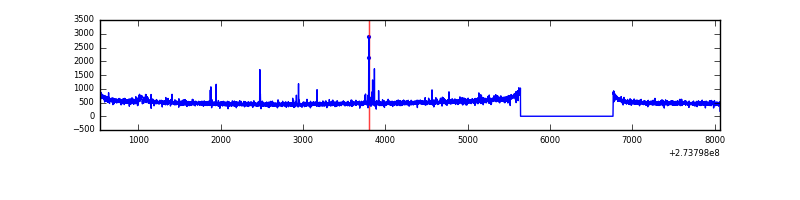 |
| D | 7535 | 6411 | 144 | 144 | 1.91% | 2.25% | 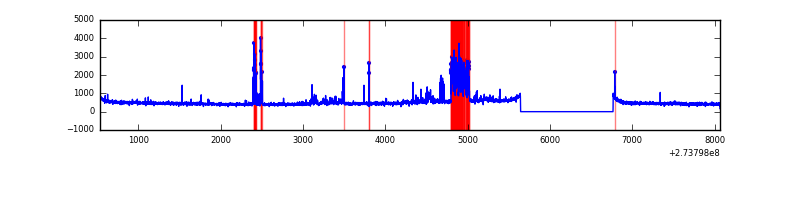 |
Top three noisy pixels from each quadrant. If the there are fewer than three noisy pixels in the level2.evt file, extra rows are filled as -1
| Pixel properties | Quadrant properties | ||||||
|---|---|---|---|---|---|---|---|
| Quadrant | DetID | PixID | Counts | Sigma | Mean | Median | Sigma |
| A | 15 | 239 | 182133 | 1134.64 | 796 | 781 | 159.8 |
| A | 15 | 157 | 146047 | 908.87 | 796 | 781 | 159.8 |
| A | 9 | 143 | 14499 | 85.83 | 796 | 781 | 159.8 |
| B | 4 | 173 | 36674 | 234.1 | 808 | 788 | 153.3 |
| B | 12 | 111 | 17685 | 110.23 | 808 | 788 | 153.3 |
| B | 11 | 111 | 15185 | 93.92 | 808 | 788 | 153.3 |
| C | 14 | 238 | 118140 | 643.19 | 776 | 783 | 182.5 |
| C | 0 | 207 | 30592 | 163.37 | 776 | 783 | 182.5 |
| C | 10 | 22 | 21859 | 115.51 | 776 | 783 | 182.5 |
| D | 13 | 172 | 367845 | 1955.54 | 767 | 745 | 187.7 |
| D | 1 | 52 | 283677 | 1507.18 | 767 | 745 | 187.7 |
| D | 2 | 234 | 22086 | 113.68 | 767 | 745 | 187.7 |
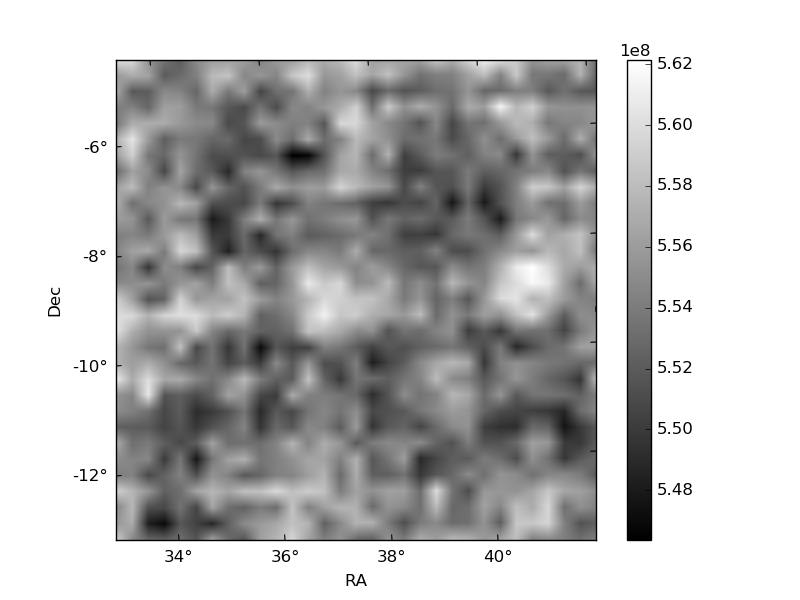
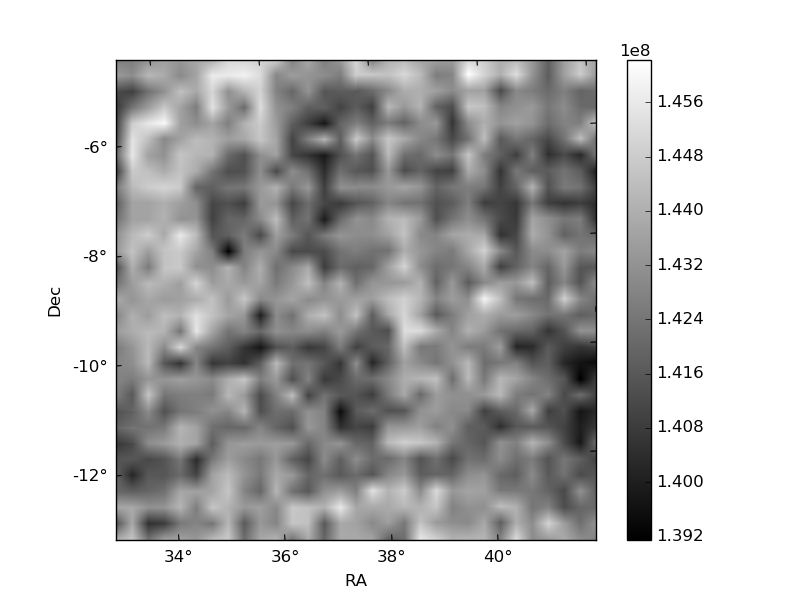
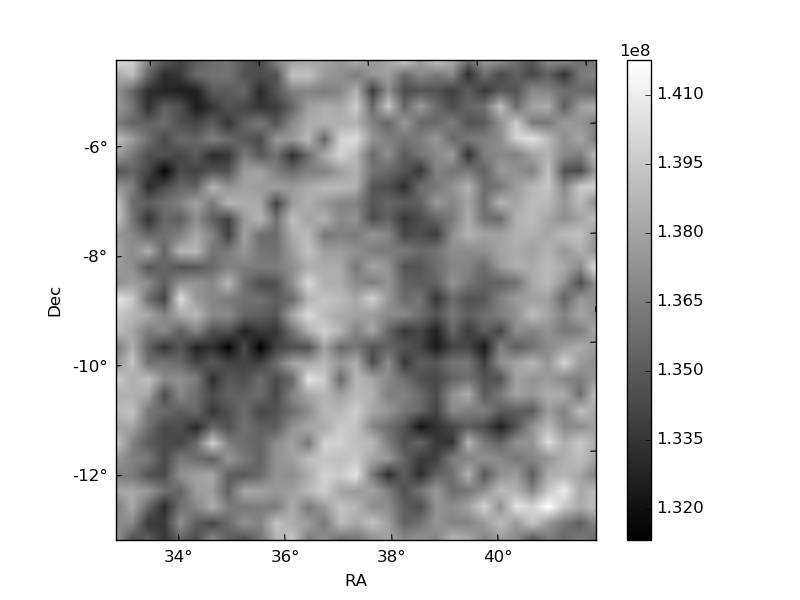
Histogram calculated using DETX and DETY for each event in the final _common_clean file
| Quadrant A | 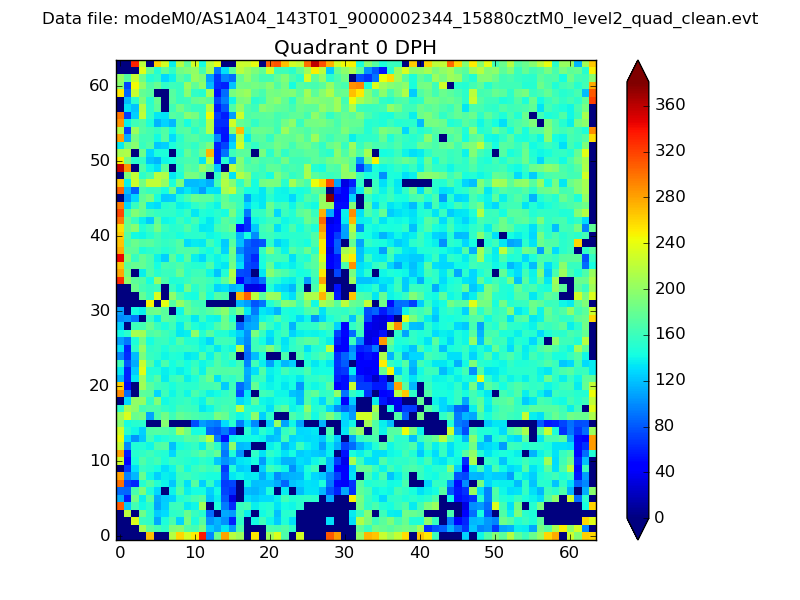 |
 |
Quadrant B |
|---|---|---|---|
| Quadrant D | 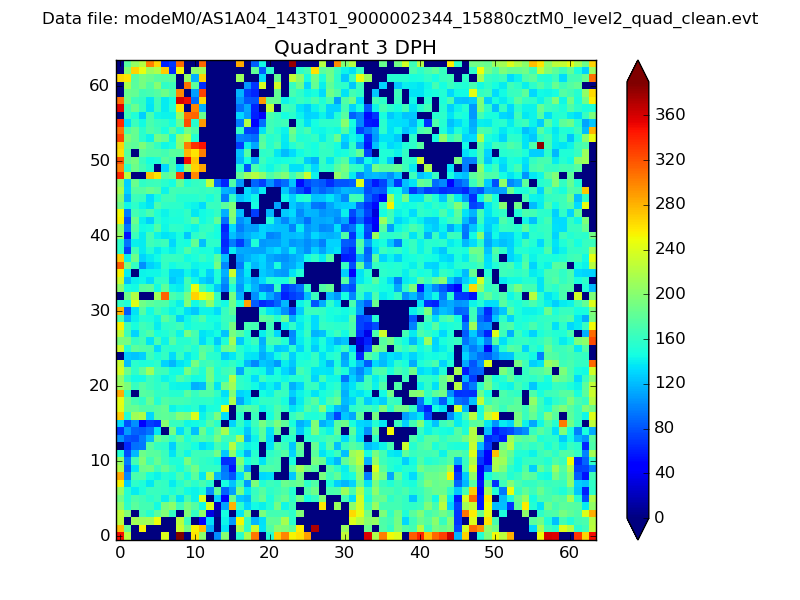 |
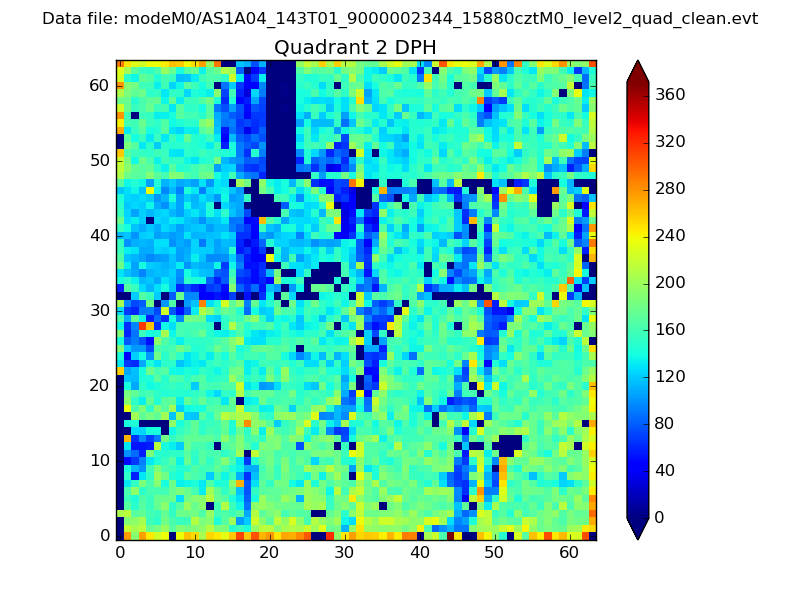 |
Quadrant C |
| Plot type | Count rate plots | Images |
|---|---|---|
| Comparison with Poisson distribution Blue bars denote a histogram of data divided into 1 sec bins. Red curve is a Poisson curve with rate = median count rate of data. |
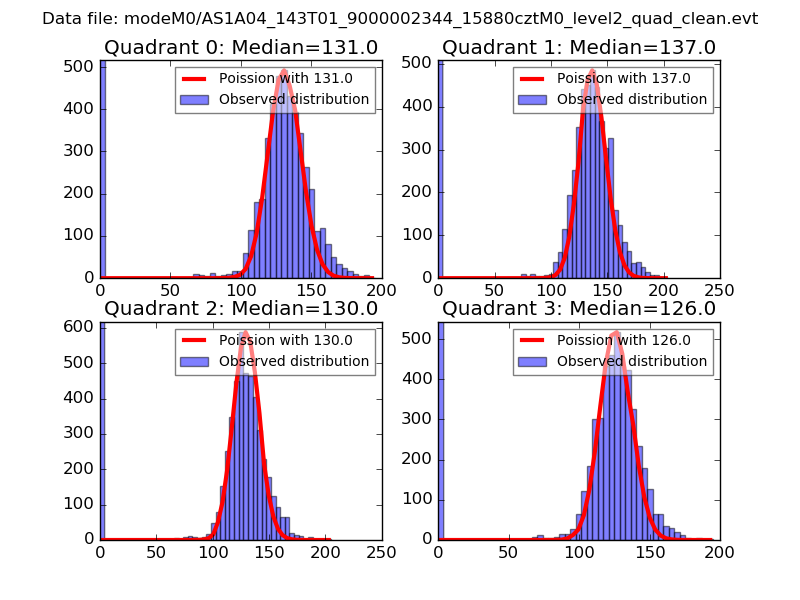 |
 |
| Quadrant-wise count rates Data is divided into 100 sec bins |
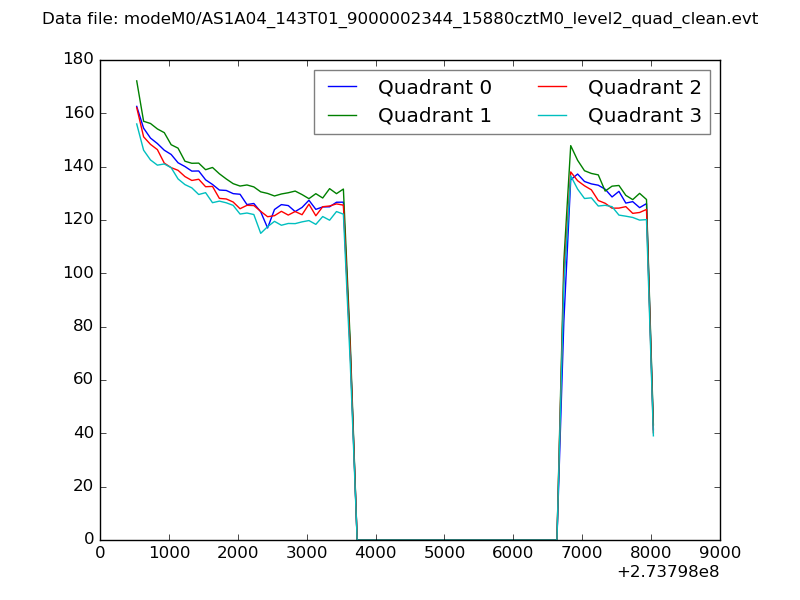 |
|
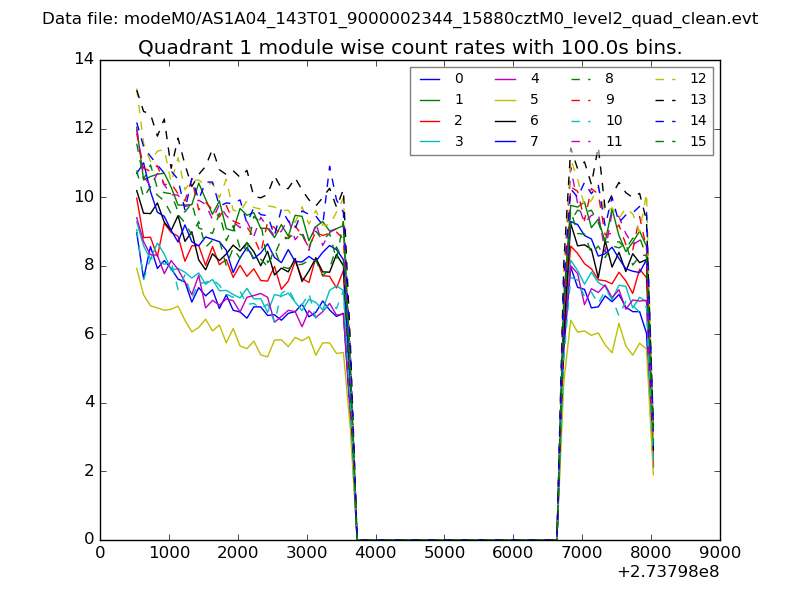
| Module-wise count rates for Quadrant A Data is divided into 100 sec bins |
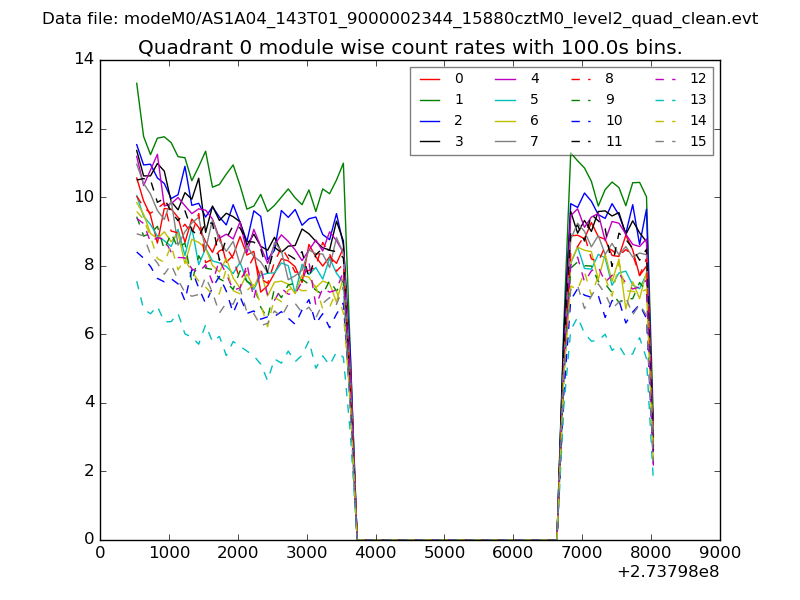 |
 |
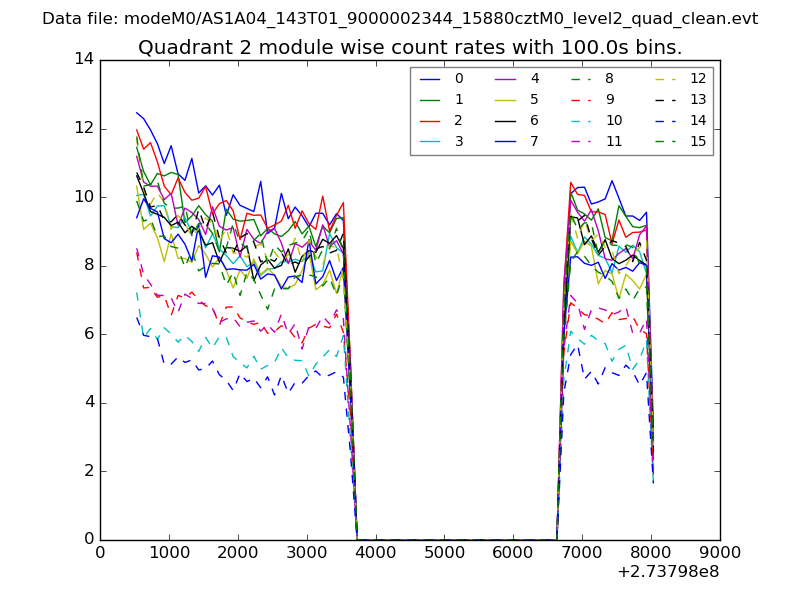
| Module-wise count rates for Quadrant B Data is divided into 100 sec bins |
 |
 |
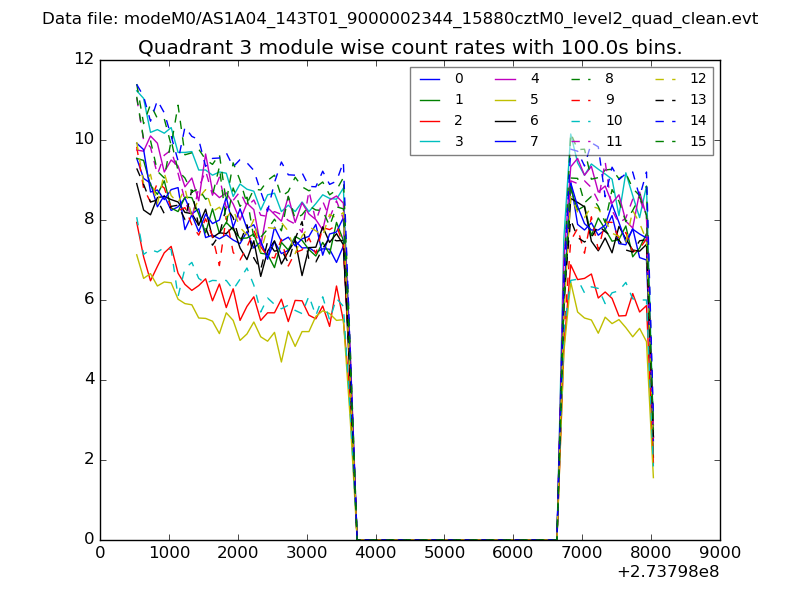
| Module-wise count rates for Quadrant C Data is divided into 100 sec bins |
 |
 |
| Module-wise count rates for Quadrant D Data is divided into 100 sec bins |
 |
 |
| Parameter | Plot |
|---|---|
| CZT HV Monitor | 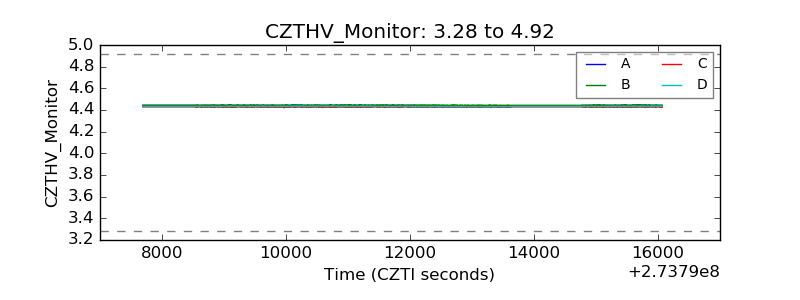 |
| D_VDD | 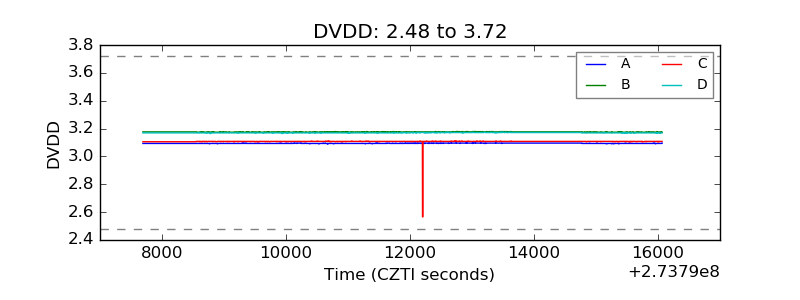 |
| Temperature 1 | 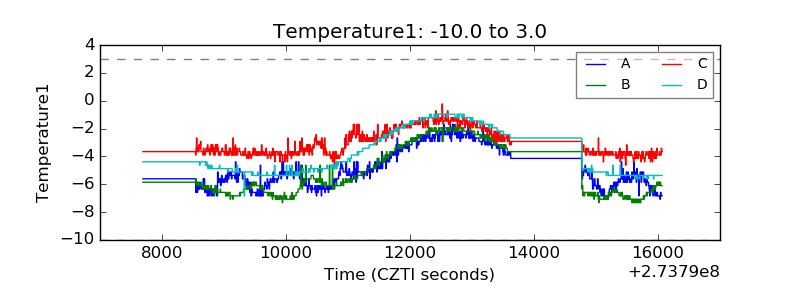 |
| Veto HV Monitor | 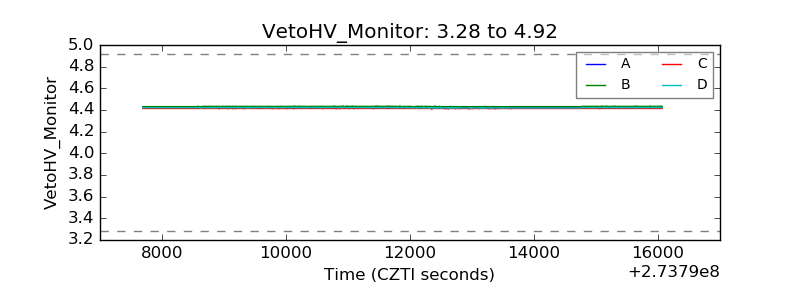 |
| Veto LLD | 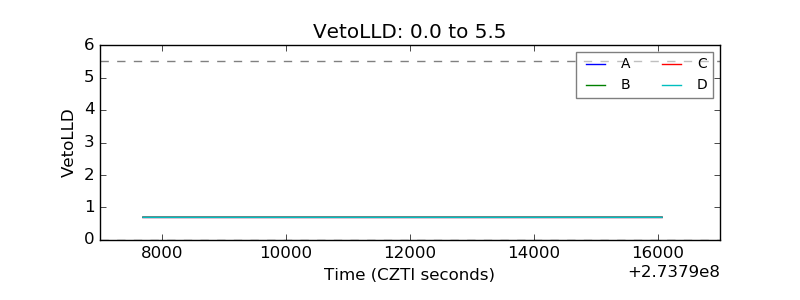 |
| Alpha Counter | 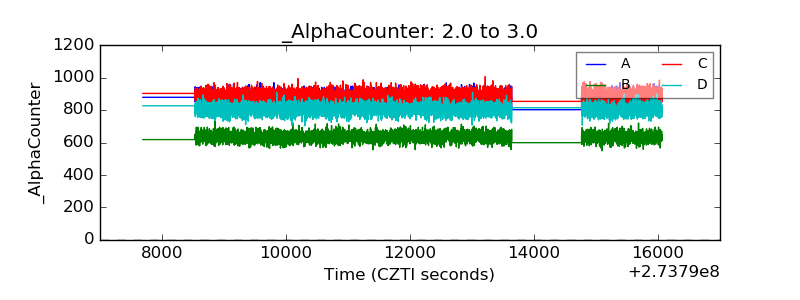 |
| _CPM_Rate | 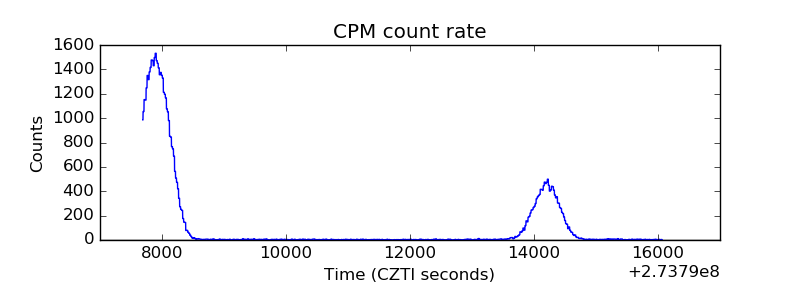 |
| CZT Counter | 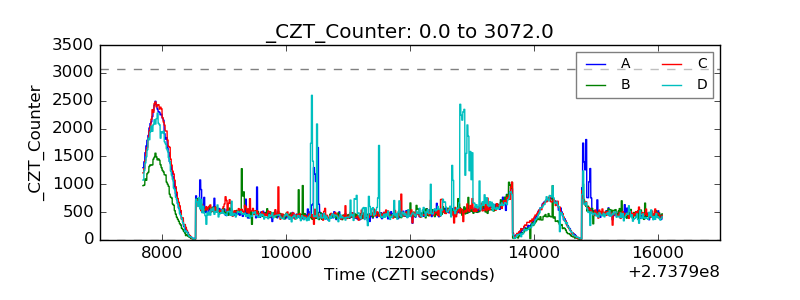 |
| +2.5 Volts monitor |  |
| +5 Volts monitor |  |
| _ROLL_ROT | 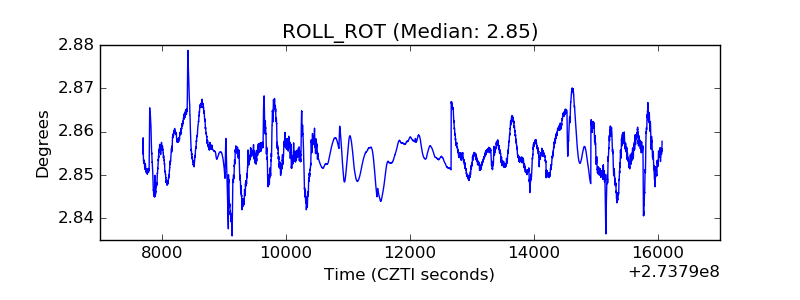 |
| _Roll_DEC | 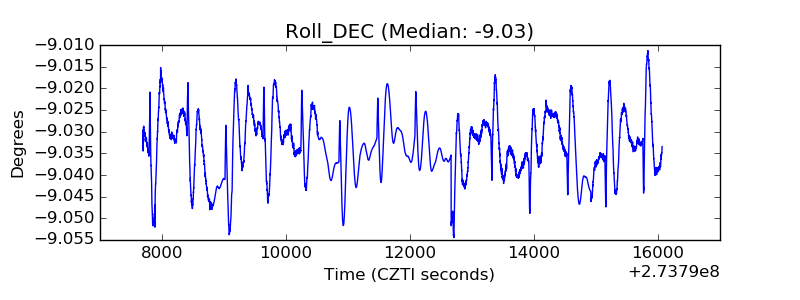 |
| _Roll_RA | 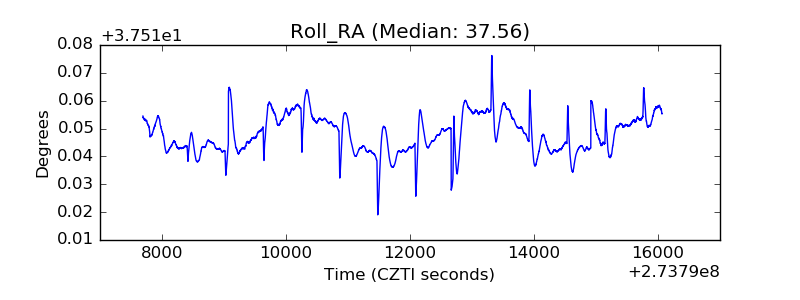 |
| Veto Counter | 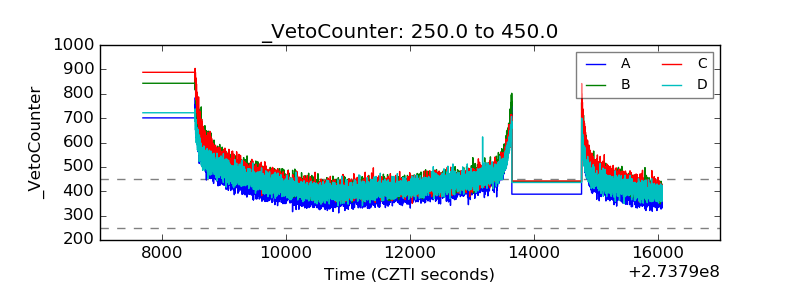 |