| Param | Original file | Final file |
|---|---|---|
| Filename | modeM0/AS1A04_143T01_9000002344_15881cztM0_level2.evt | modeM0/AS1A04_143T01_9000002344_15881cztM0_level2_quad_clean.evt |
| Size (bytes) | 483,246,720 | 100,393,920 |
| Size | 460.9 MB | 95.7 MB |
| Events in quadrant A | 3,649,745 | 636,496 |
| Events in quadrant B | 3,568,568 | 657,322 |
| Events in quadrant C | 3,563,317 | 624,038 |
| Events in quadrant D | 3,355,625 | 612,386 |
| Mode SS | |||
|---|---|---|---|
| Quadrant | BADHDUFLAG | Total packets | Discarded packets |
| A | 0 | 150 | 0 |
| B | 0 | 150 | 0 |
| C | 0 | 150 | 0 |
| D | 0 | 150 | 0 |
| Mode M0 | |||
|---|---|---|---|
| Quadrant | BADHDUFLAG | Total packets | Discarded packets |
| A | 0 | 15720 | 3 |
| B | 0 | 15318 | 2 |
| C | 0 | 15200 | 2 |
| D | 0 | 15133 | 2 |
| Mode M9 | |||
|---|---|---|---|
| Quadrant | BADHDUFLAG | Total packets | Discarded packets |
| A | 0 | 11 | 0 |
| B | 0 | 11 | 0 |
| C | 0 | 11 | 0 |
| D | 0 | 12 | 0 |
| Quadrant | Total seconds | Saturated seconds | Saturation percentage |
|---|---|---|---|
| A | 7325 | 107 | 1.460751% |
| B | 7325 | 80 | 1.092150% |
| C | 7325 | 80 | 1.092150% |
| D | 7325 | 20 | 0.273038% |
Noise dominated data is calculated using 1-second bins in cleaned event files. If a bin has >2000 counts, and if more than 50% of those come from <1% of pixels, then it is considered to be noise-dominated and hence unusable.
| Quadrant | # 1 sec bins | Bins with >0 counts | Bins with >2000 counts | High rate bins dominated by noise | Noise dominated (total time) | Noise dominated (detector-on time) | Marked lightcurve |
|---|---|---|---|---|---|---|---|
| A | 8056 | 7327 | 35 | 35 | 0.43% | 0.48% | 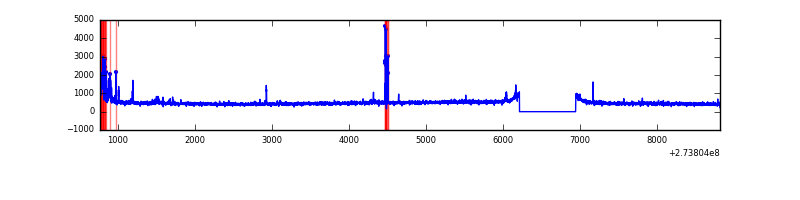 |
| B | 8056 | 7327 | 8 | 8 | 0.10% | 0.11% | 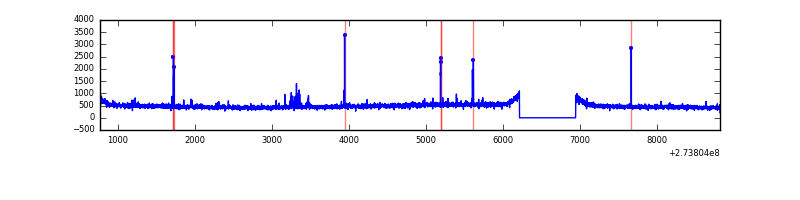 |
| C | 8056 | 7327 | 0 | 0 | 0.00% | 0.00% | 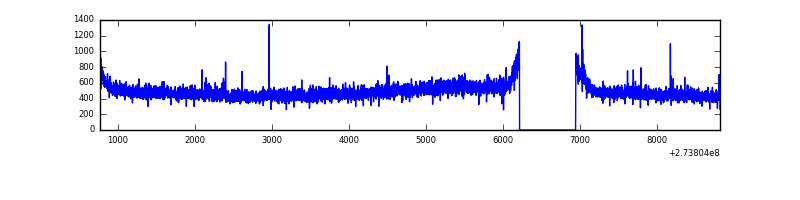 |
| D | 8056 | 7327 | 3 | 3 | 0.04% | 0.04% | 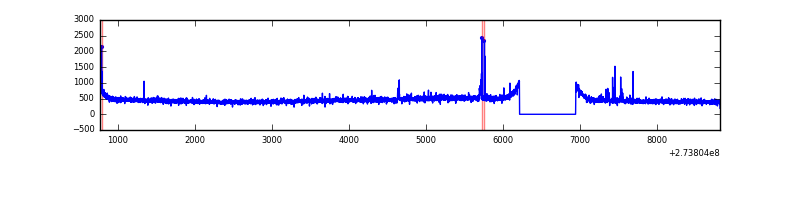 |
Top three noisy pixels from each quadrant. If the there are fewer than three noisy pixels in the level2.evt file, extra rows are filled as -1
| Pixel properties | Quadrant properties | ||||||
|---|---|---|---|---|---|---|---|
| Quadrant | DetID | PixID | Counts | Sigma | Mean | Median | Sigma |
| A | 15 | 157 | 162142 | 899.75 | 882 | 863 | 179.2 |
| A | 15 | 239 | 78655 | 433.99 | 882 | 863 | 179.2 |
| A | 9 | 143 | 17180 | 91.03 | 882 | 863 | 179.2 |
| B | 4 | 173 | 37550 | 215.04 | 889 | 867 | 170.6 |
| B | 12 | 111 | 20288 | 113.85 | 889 | 867 | 170.6 |
| B | 4 | 48 | 18370 | 102.6 | 889 | 867 | 170.6 |
| C | 14 | 238 | 131411 | 648.15 | 858 | 864 | 201.4 |
| C | 3 | 233 | 39366 | 191.16 | 858 | 864 | 201.4 |
| C | 0 | 207 | 34210 | 165.56 | 858 | 864 | 201.4 |
| D | 1 | 52 | 35436 | 163.52 | 866 | 840 | 211.6 |
| D | 2 | 234 | 25864 | 118.28 | 866 | 840 | 211.6 |
| D | 7 | 223 | 22630 | 102.99 | 866 | 840 | 211.6 |
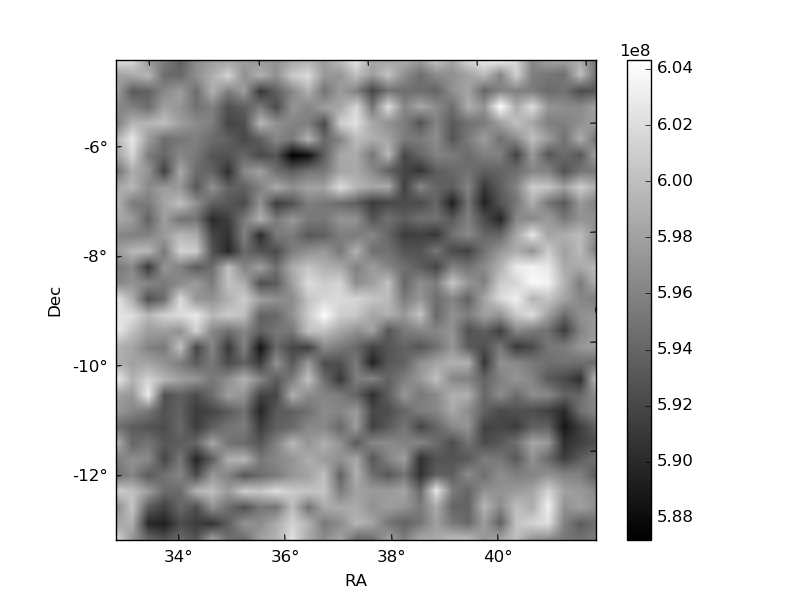
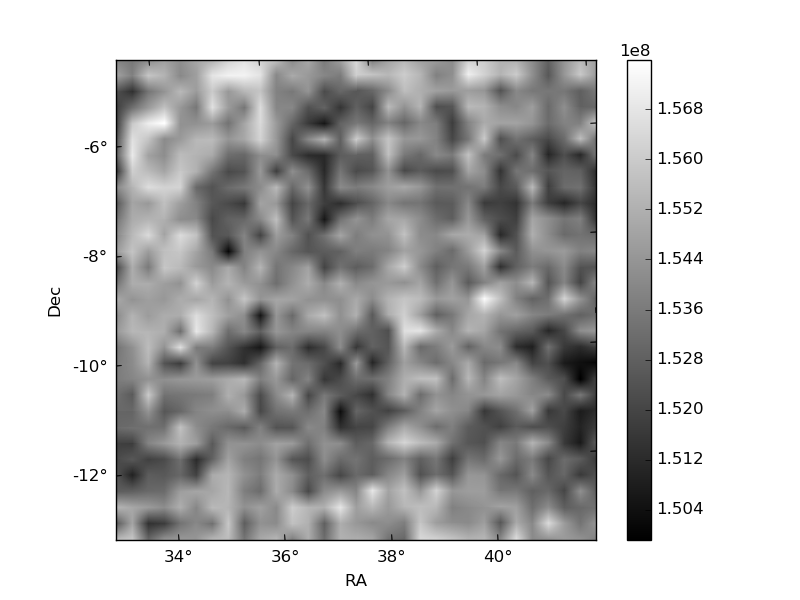
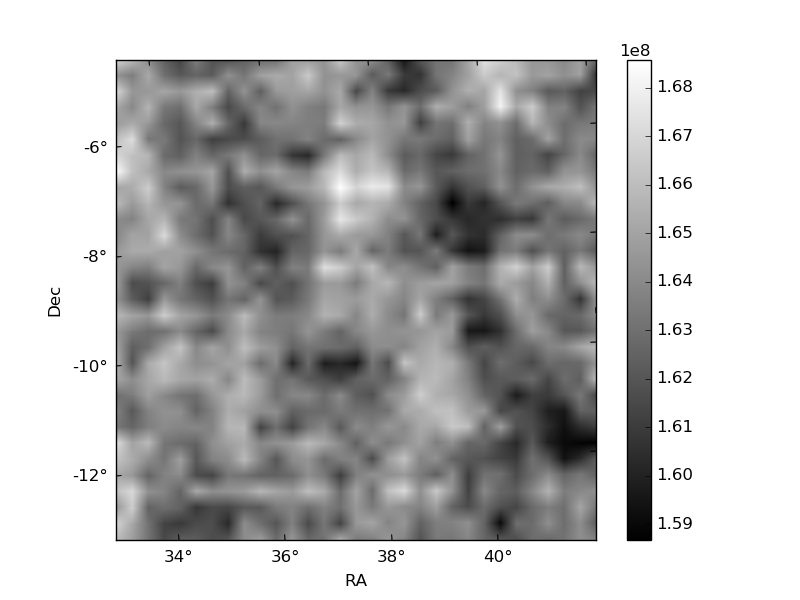
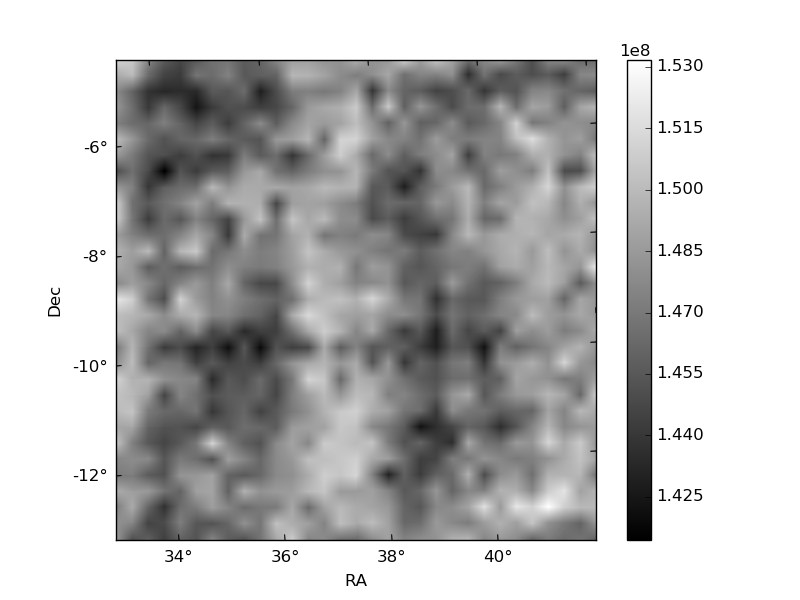
Histogram calculated using DETX and DETY for each event in the final _common_clean file
| Quadrant A | 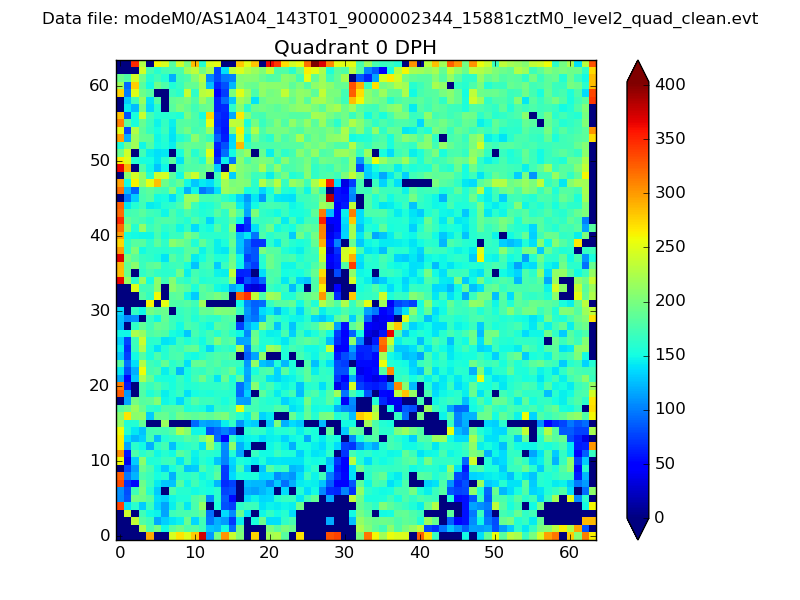 |
 |
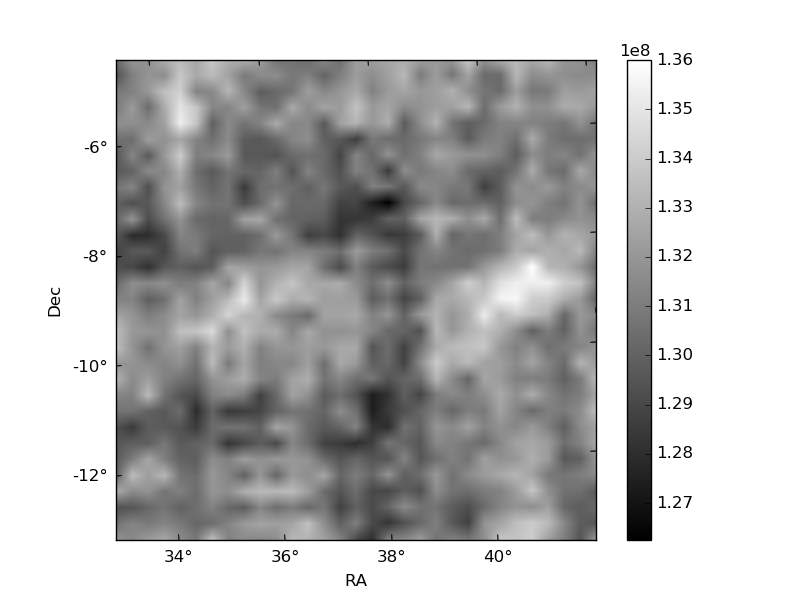
Quadrant B |
|---|---|---|---|
| Quadrant D | 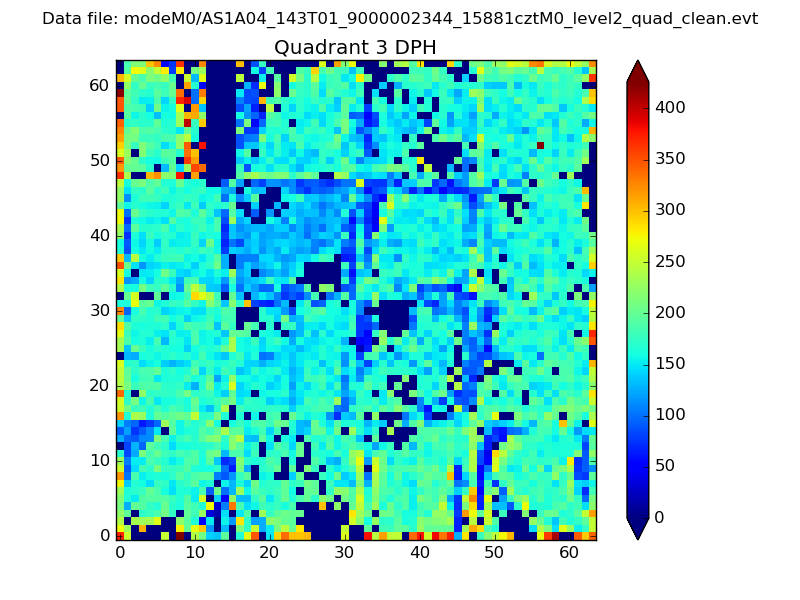 |
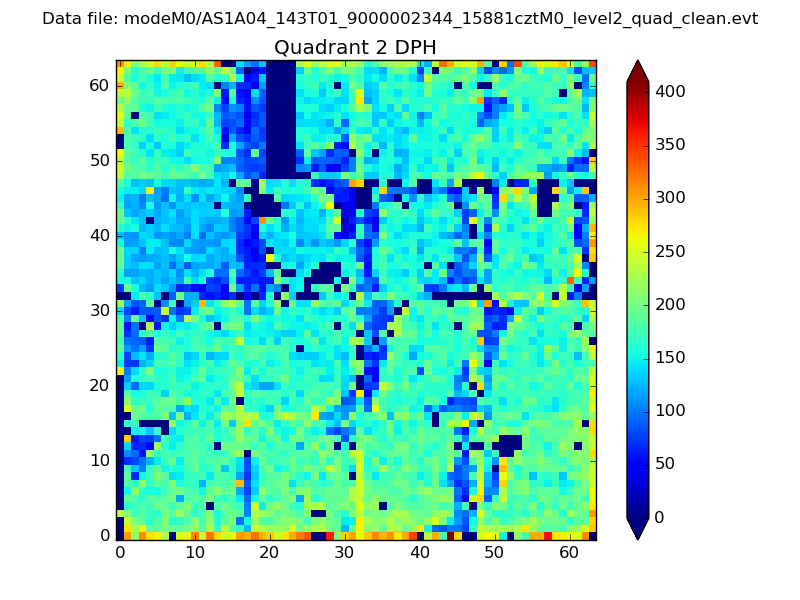 |
Quadrant C |
| Plot type | Count rate plots | Images |
|---|---|---|
| Comparison with Poisson distribution Blue bars denote a histogram of data divided into 1 sec bins. Red curve is a Poisson curve with rate = median count rate of data. |
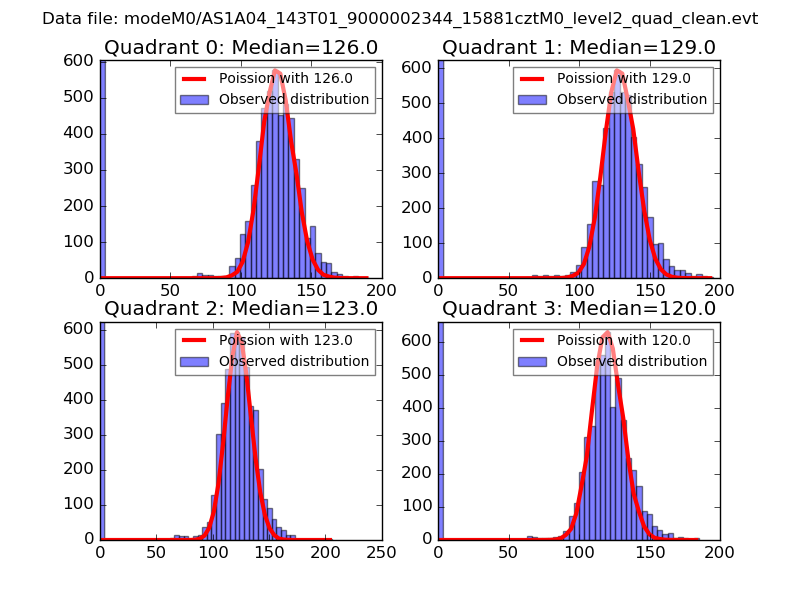 |
 |
| Quadrant-wise count rates Data is divided into 100 sec bins |
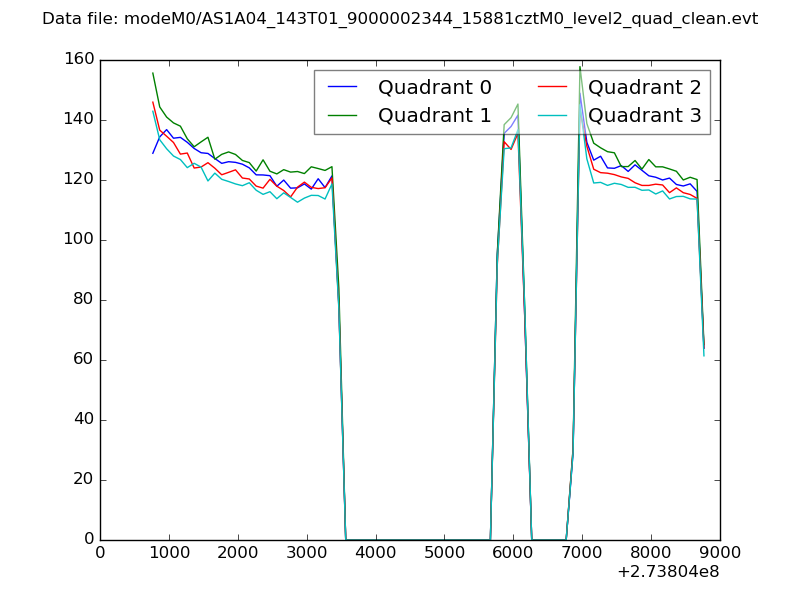 |
|
| Module-wise count rates for Quadrant A Data is divided into 100 sec bins |
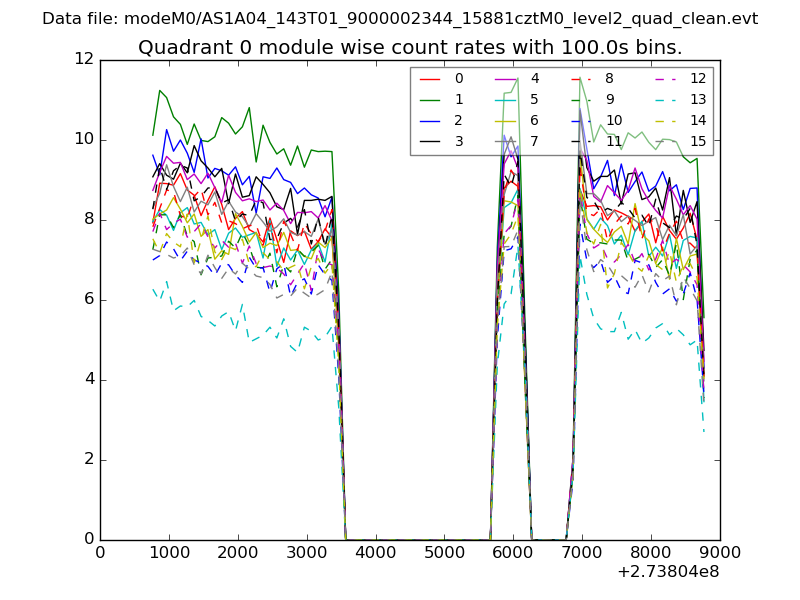 |
 |
| Module-wise count rates for Quadrant B Data is divided into 100 sec bins |
 |
 |
| Module-wise count rates for Quadrant C Data is divided into 100 sec bins |
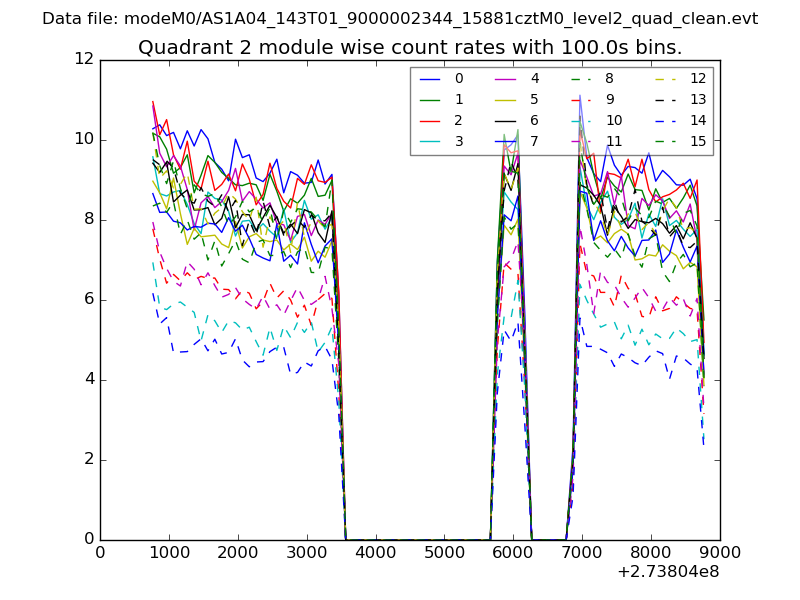 |
 |
| Module-wise count rates for Quadrant D Data is divided into 100 sec bins |
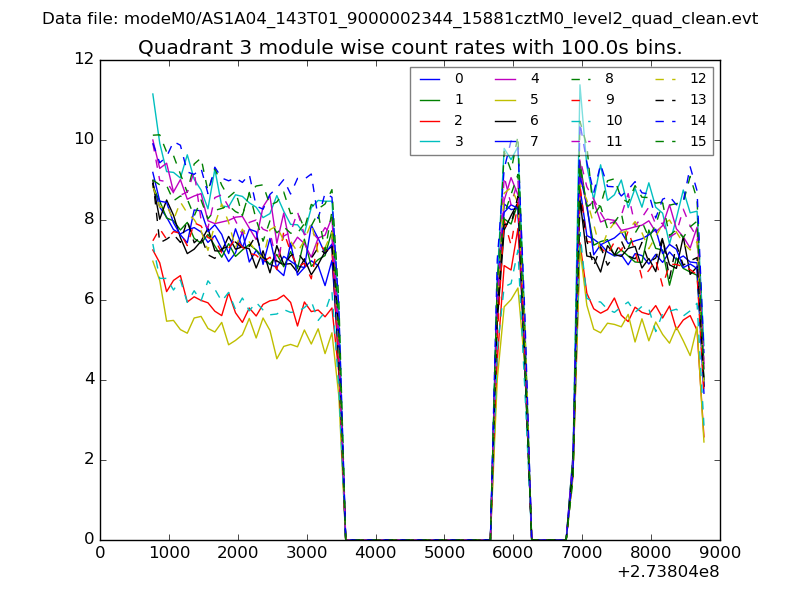 |
 |
| Parameter | Plot |
|---|---|
| CZT HV Monitor |  |
| D_VDD | 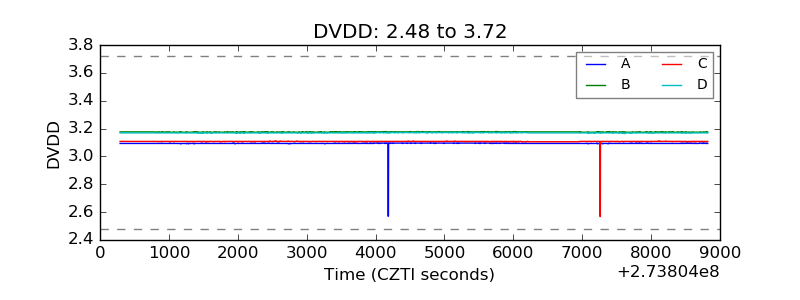 |
| Temperature 1 | 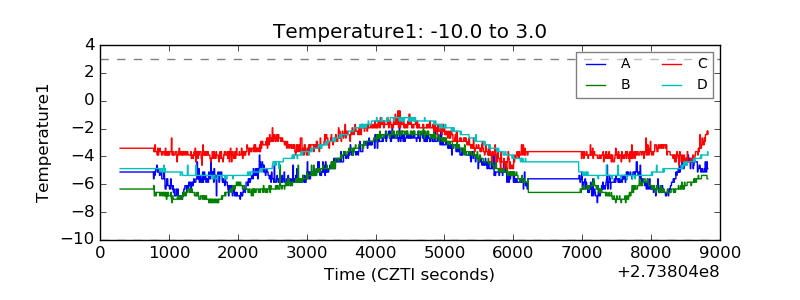 |
| Veto HV Monitor | 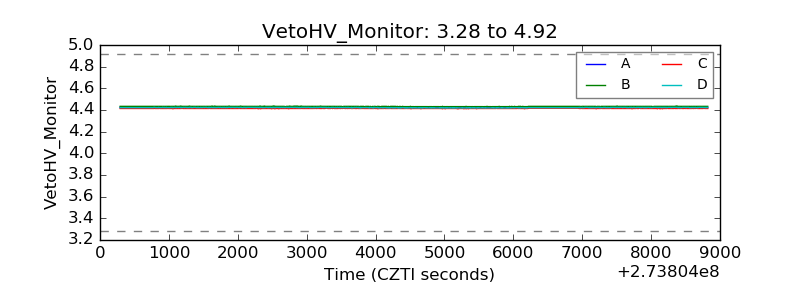 |
| Veto LLD | 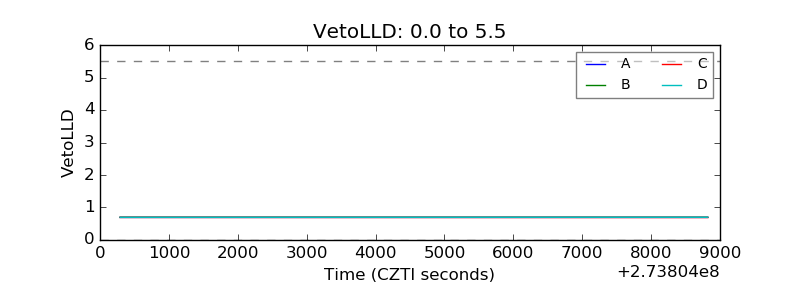 |
| Alpha Counter | 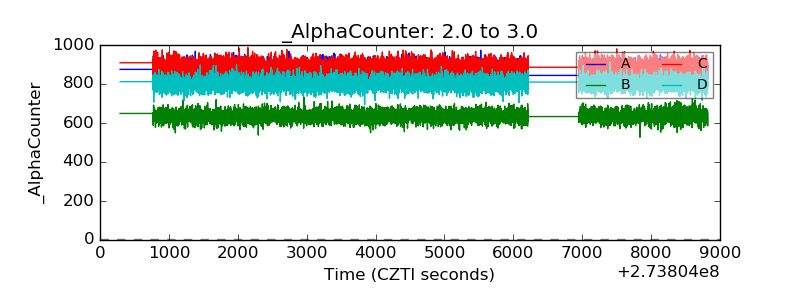 |
| _CPM_Rate | 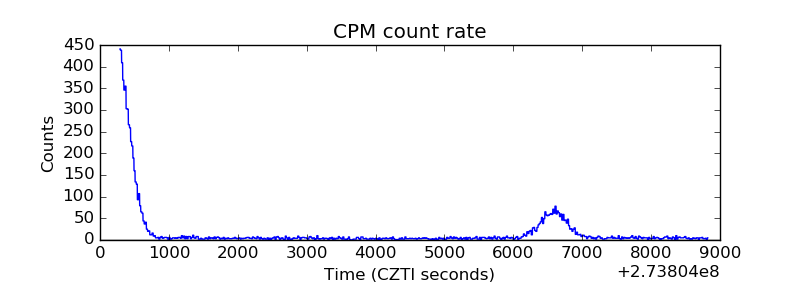 |
| CZT Counter |  |
| +2.5 Volts monitor |  |
| +5 Volts monitor | 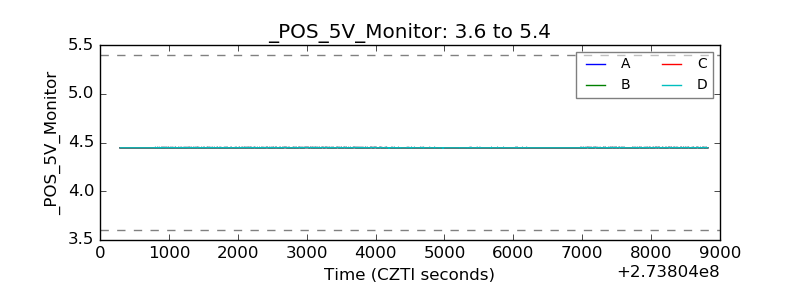 |
| _ROLL_ROT | 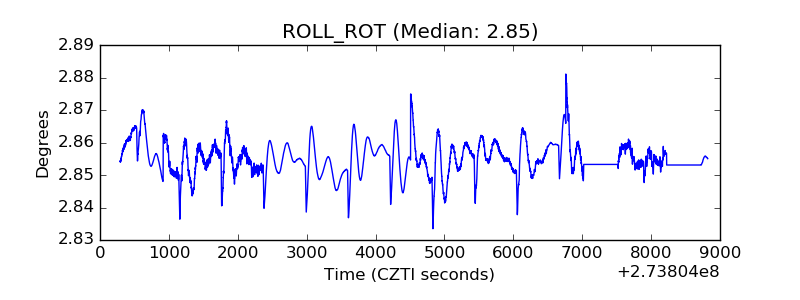 |
| _Roll_DEC | 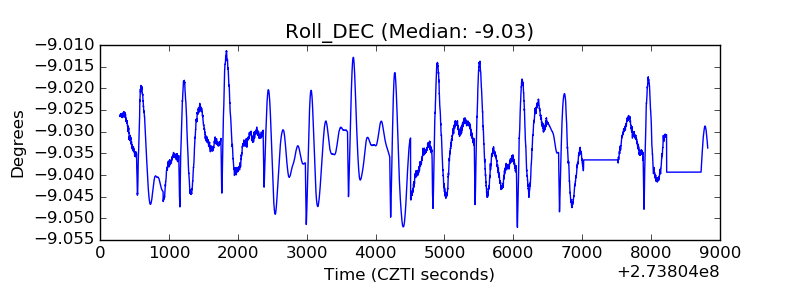 |
| _Roll_RA | 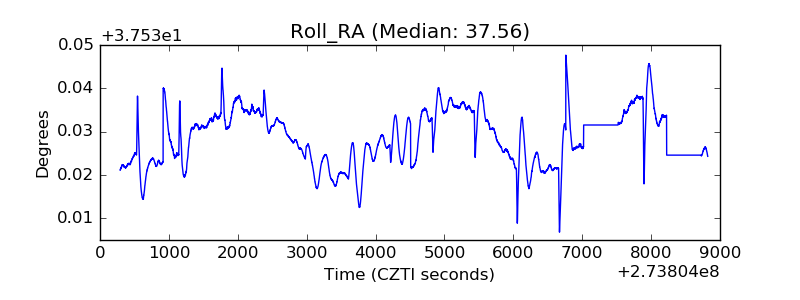 |
| Veto Counter | 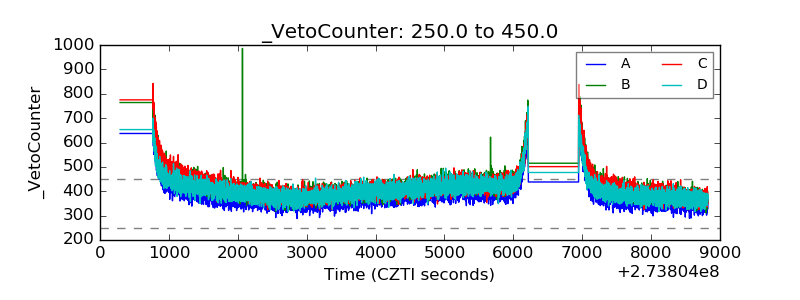 |