| Param | Original file | Final file |
|---|---|---|
| Filename | modeM0/AS1A04_143T01_9000002344_15882cztM0_level2.evt | modeM0/AS1A04_143T01_9000002344_15882cztM0_level2_quad_clean.evt |
| Size (bytes) | 476,899,200 | 98,164,800 |
| Size | 454.8 MB | 93.6 MB |
| Events in quadrant A | 3,478,560 | 620,930 |
| Events in quadrant B | 3,548,155 | 638,018 |
| Events in quadrant C | 3,537,045 | 607,409 |
| Events in quadrant D | 3,382,712 | 598,146 |
| Mode SS | |||
|---|---|---|---|
| Quadrant | BADHDUFLAG | Total packets | Discarded packets |
| A | 0 | 150 | 0 |
| B | 0 | 150 | 0 |
| C | 0 | 150 | 2 |
| D | 0 | 150 | 2 |
| Mode M0 | |||
|---|---|---|---|
| Quadrant | BADHDUFLAG | Total packets | Discarded packets |
| A | 0 | 15346 | 84 |
| B | 0 | 15402 | 71 |
| C | 0 | 15251 | 89 |
| D | 0 | 15308 | 60 |
| Mode M9 | |||
|---|---|---|---|
| Quadrant | BADHDUFLAG | Total packets | Discarded packets |
| A | 0 | 3 | 0 |
| B | 0 | 3 | 0 |
| C | 0 | 3 | 0 |
| D | 0 | 3 | 0 |
| Quadrant | Total seconds | Saturated seconds | Saturation percentage |
|---|---|---|---|
| A | 7306 | 162 | 2.217356% |
| B | 7312 | 167 | 2.283917% |
| C | 7304 | 172 | 2.354874% |
| D | 7318 | 118 | 1.612462% |
Noise dominated data is calculated using 1-second bins in cleaned event files. If a bin has >2000 counts, and if more than 50% of those come from <1% of pixels, then it is considered to be noise-dominated and hence unusable.
| Quadrant | # 1 sec bins | Bins with >0 counts | Bins with >2000 counts | High rate bins dominated by noise | Noise dominated (total time) | Noise dominated (detector-on time) | Marked lightcurve |
|---|---|---|---|---|---|---|---|
| A | 7528 | 7348 | 23 | 23 | 0.31% | 0.31% | 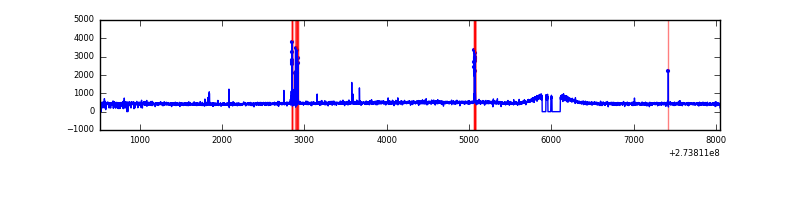 |
| B | 7528 | 7350 | 2 | 2 | 0.03% | 0.03% | 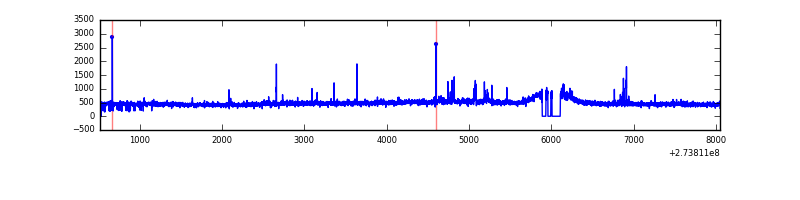 |
| C | 7528 | 7344 | 0 | 0 | 0.00% | 0.00% | 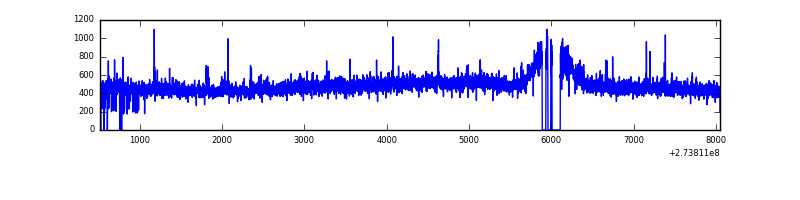 |
| D | 7528 | 7349 | 3 | 3 | 0.04% | 0.04% | 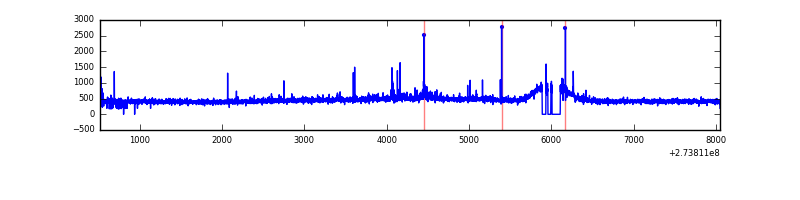 |
Top three noisy pixels from each quadrant. If the there are fewer than three noisy pixels in the level2.evt file, extra rows are filled as -1
| Pixel properties | Quadrant properties | ||||||
|---|---|---|---|---|---|---|---|
| Quadrant | DetID | PixID | Counts | Sigma | Mean | Median | Sigma |
| A | 15 | 239 | 51020 | 277.67 | 879 | 858 | 180.7 |
| A | 15 | 69 | 32128 | 173.09 | 879 | 858 | 180.7 |
| A | 9 | 143 | 8165 | 40.45 | 879 | 858 | 180.7 |
| B | 4 | 173 | 29362 | 168.17 | 881 | 857 | 169.5 |
| B | 3 | 209 | 23422 | 133.12 | 881 | 857 | 169.5 |
| B | 12 | 111 | 20245 | 114.38 | 881 | 857 | 169.5 |
| C | 14 | 238 | 129840 | 647.12 | 848 | 855 | 199.3 |
| C | 0 | 207 | 42950 | 211.19 | 848 | 855 | 199.3 |
| C | 3 | 233 | 25107 | 121.67 | 848 | 855 | 199.3 |
| D | 1 | 52 | 90238 | 418.77 | 865 | 837 | 213.5 |
| D | 2 | 234 | 26952 | 122.33 | 865 | 837 | 213.5 |
| D | 5 | 51 | 14938 | 66.05 | 865 | 837 | 213.5 |
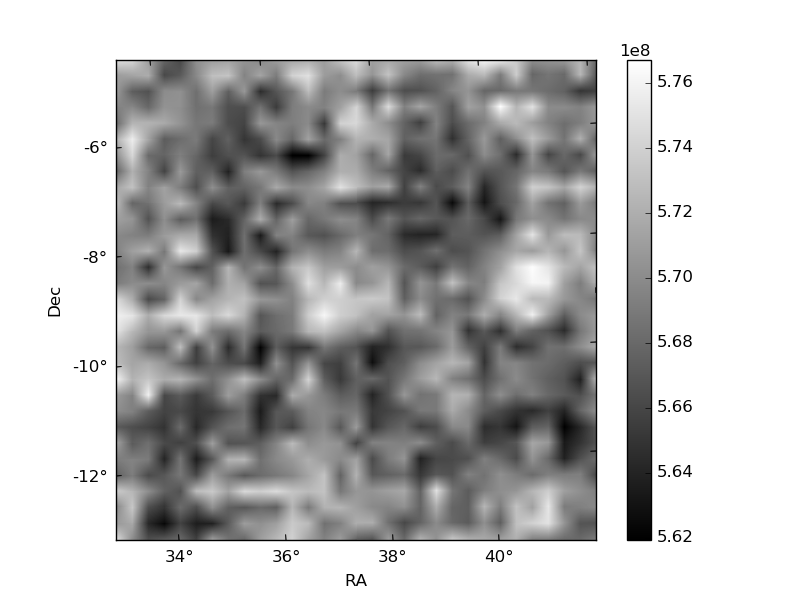
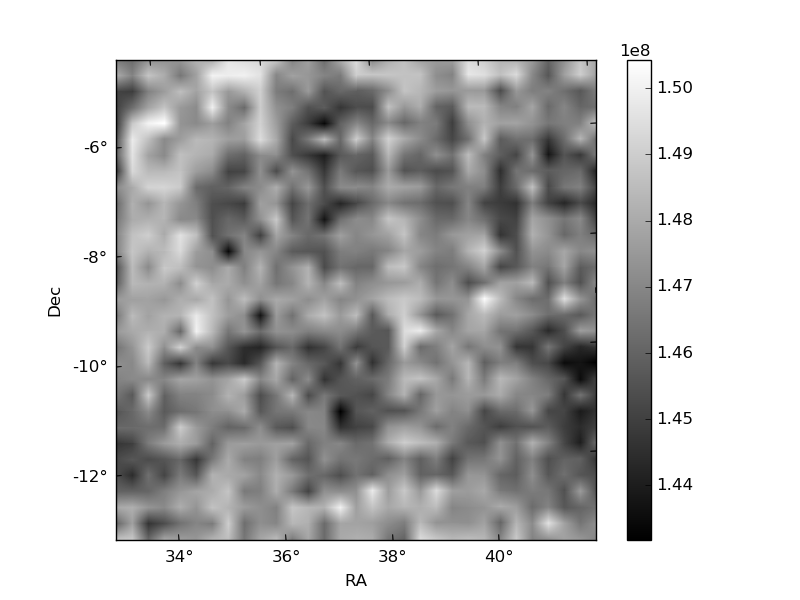
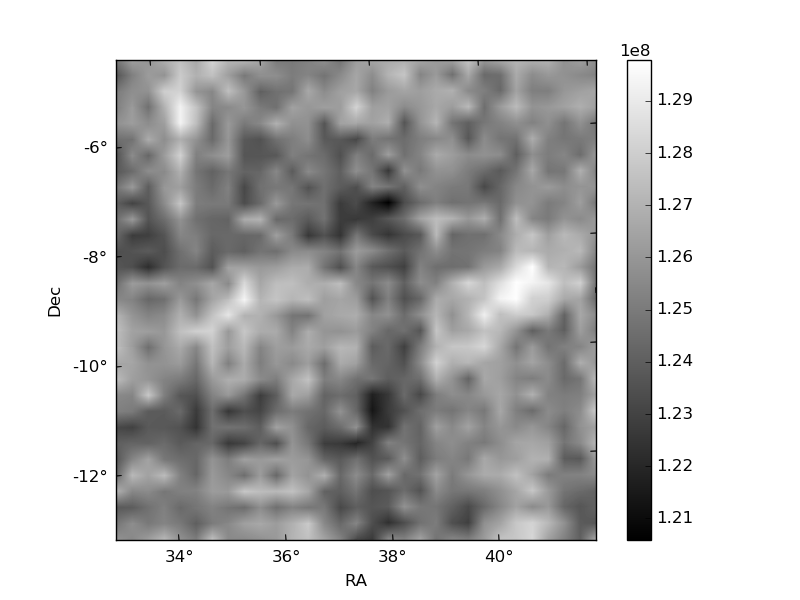
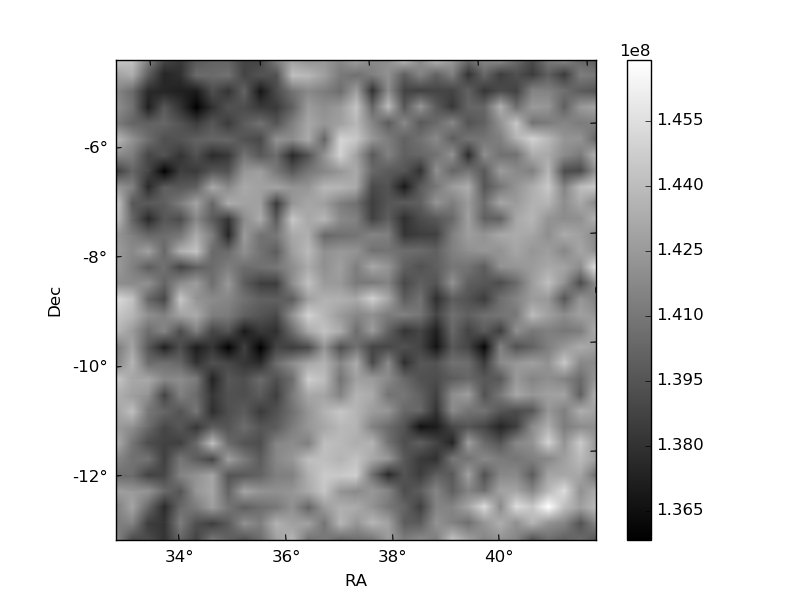
Histogram calculated using DETX and DETY for each event in the final _common_clean file
| Quadrant A | 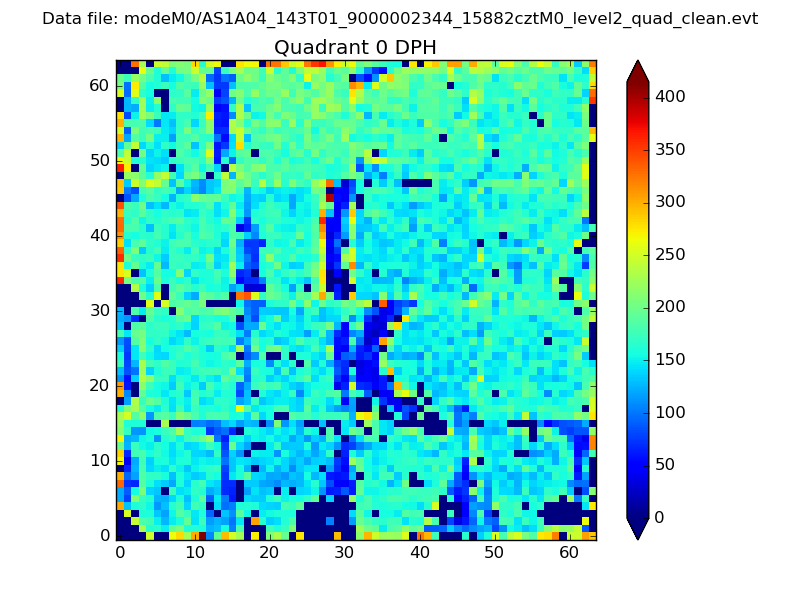 |
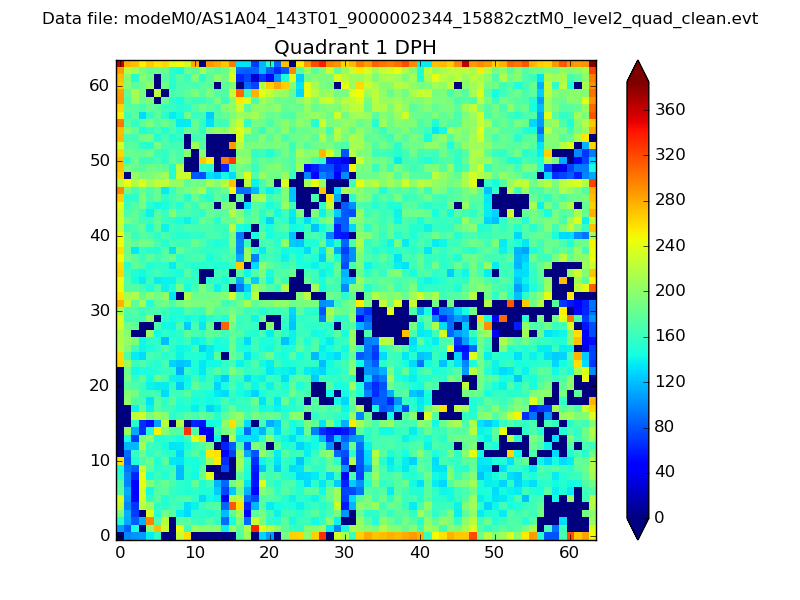 |
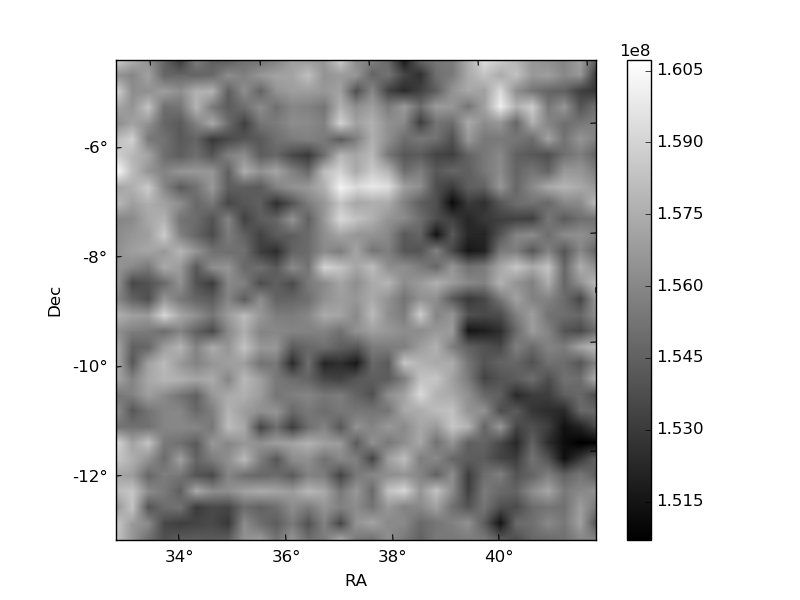
Quadrant B |
|---|---|---|---|
| Quadrant D | 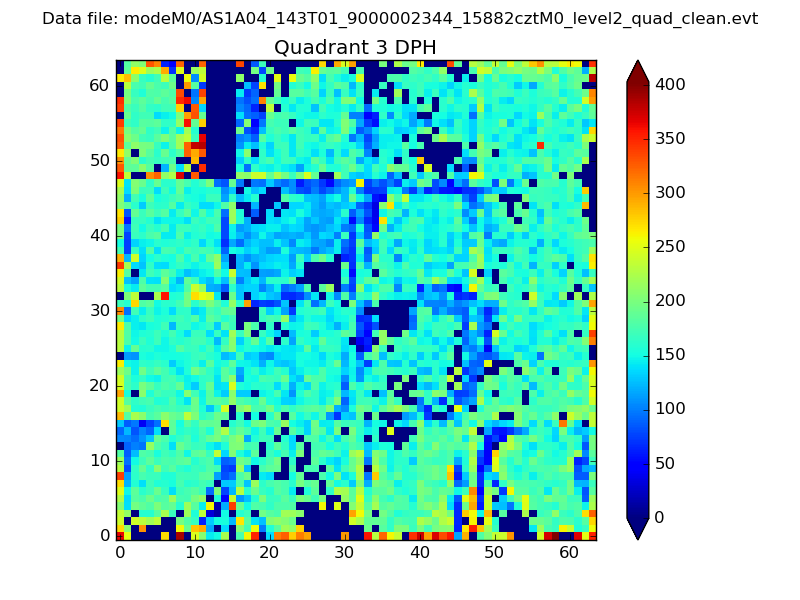 |
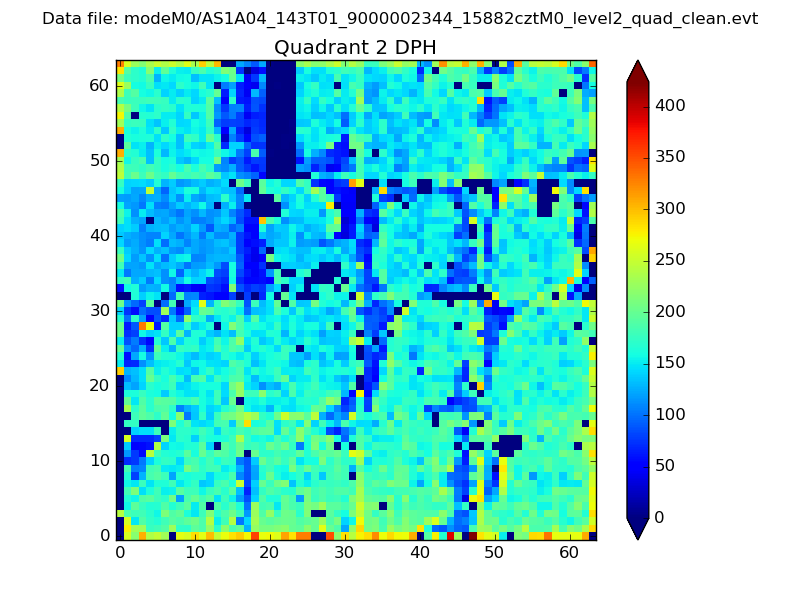 |
Quadrant C |
| Plot type | Count rate plots | Images |
|---|---|---|
| Comparison with Poisson distribution Blue bars denote a histogram of data divided into 1 sec bins. Red curve is a Poisson curve with rate = median count rate of data. |
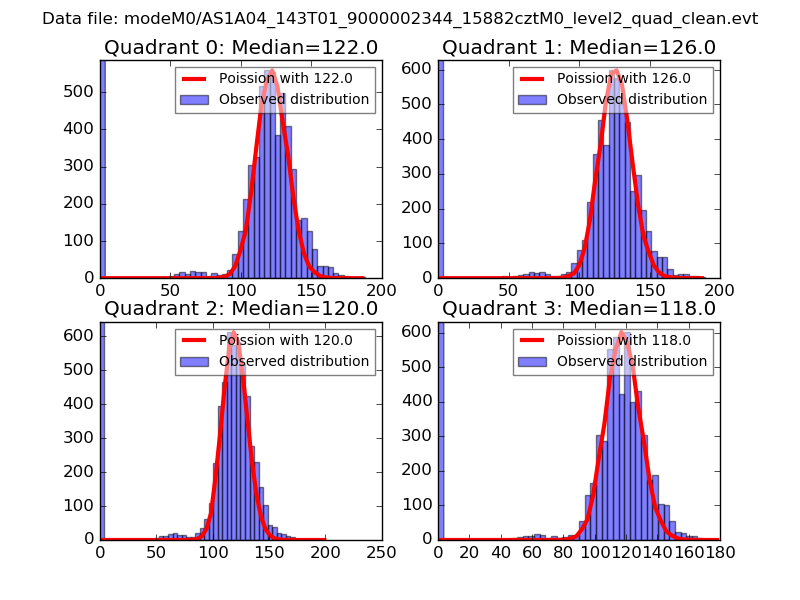 |
 |
| Quadrant-wise count rates Data is divided into 100 sec bins |
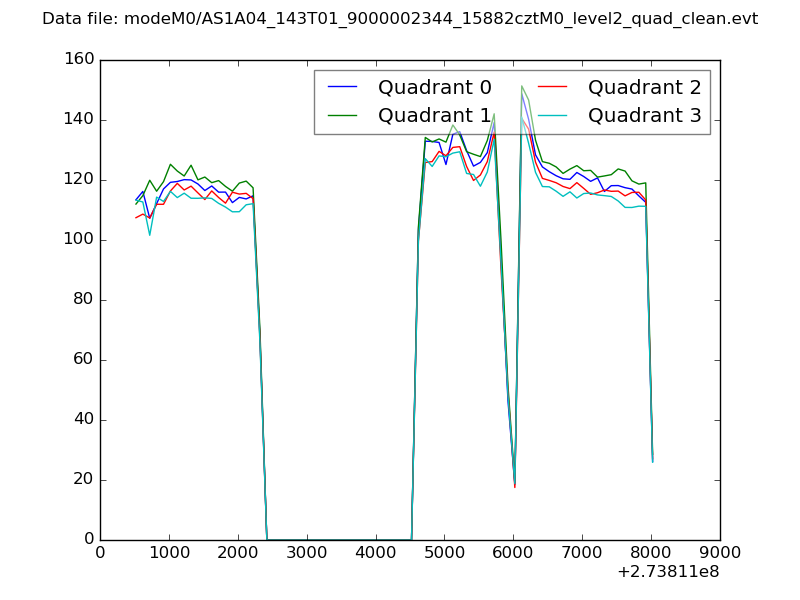 |
|
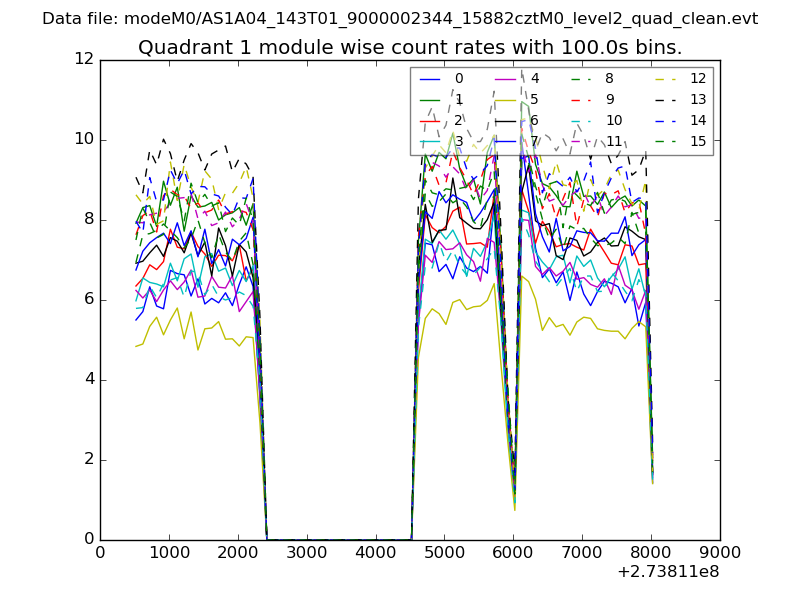
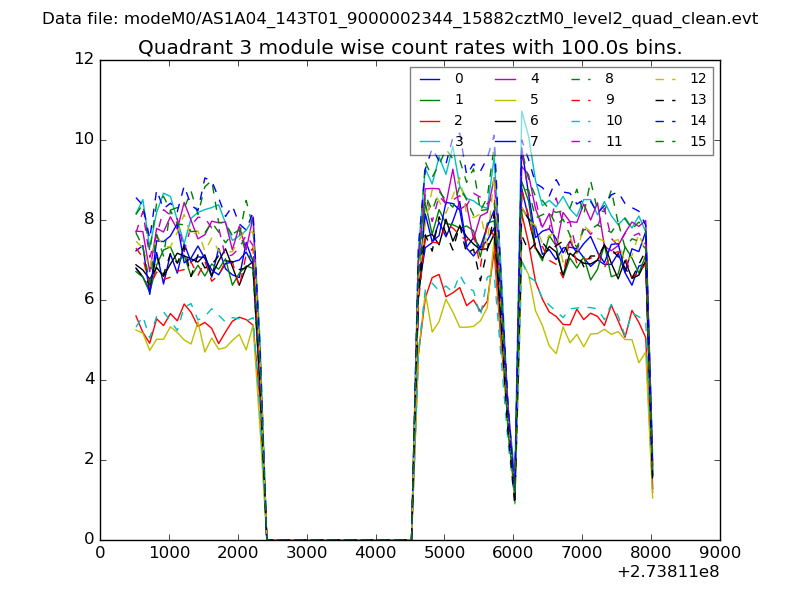
| Module-wise count rates for Quadrant A Data is divided into 100 sec bins |
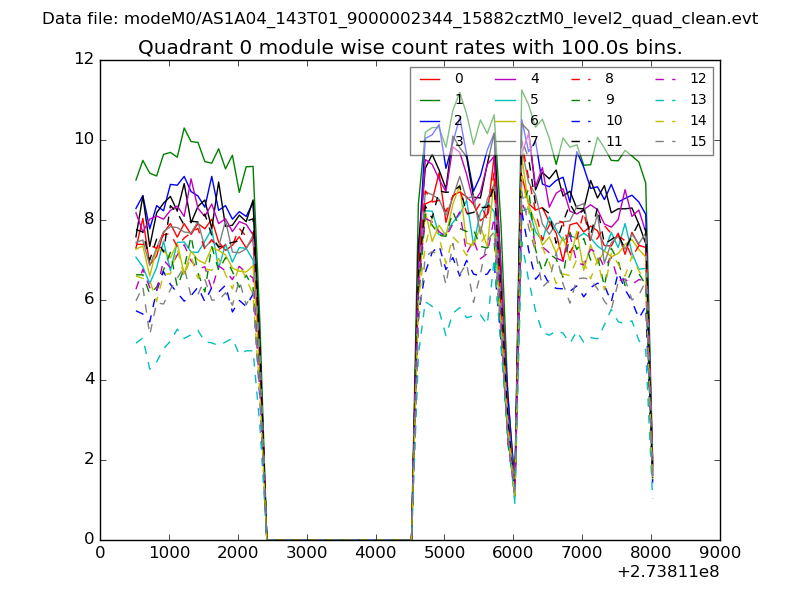 |
 |
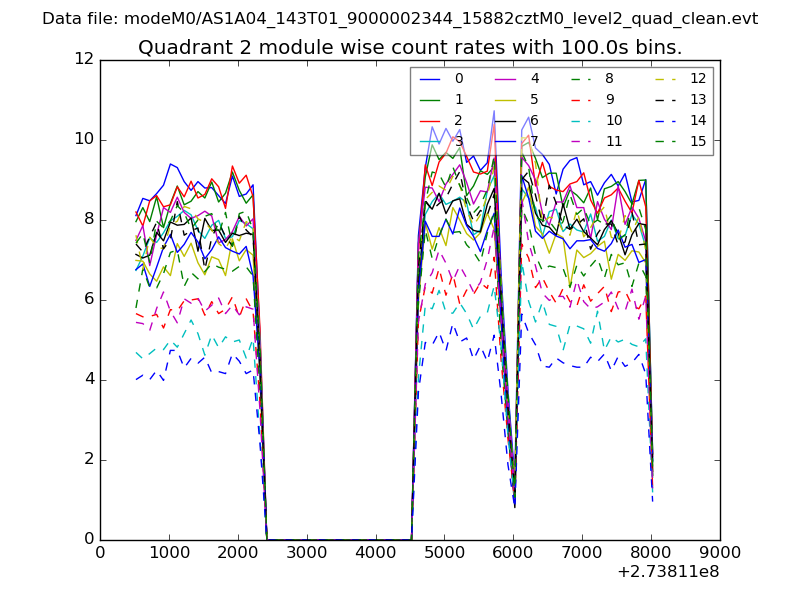
| Module-wise count rates for Quadrant B Data is divided into 100 sec bins |
 |
 |
| Module-wise count rates for Quadrant C Data is divided into 100 sec bins |
 |
 |
| Module-wise count rates for Quadrant D Data is divided into 100 sec bins |
 |
 |
| Parameter | Plot |
|---|---|
| CZT HV Monitor | 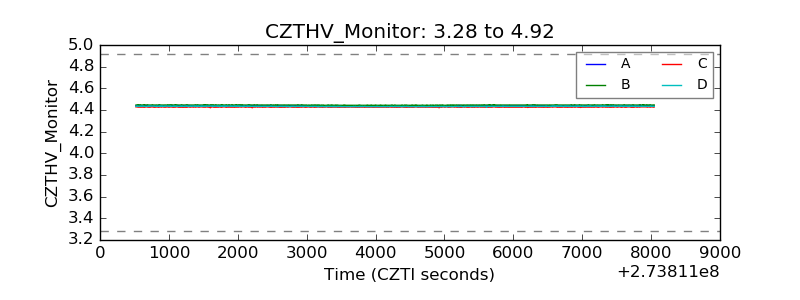 |
| D_VDD |  |
| Temperature 1 | 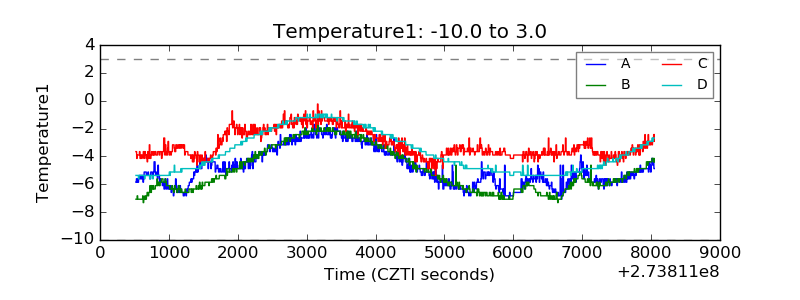 |
| Veto HV Monitor | 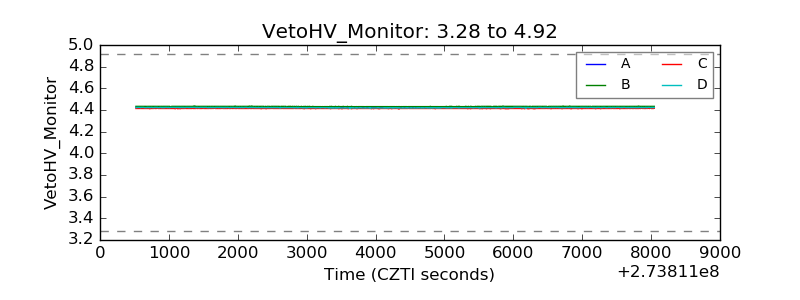 |
| Veto LLD |  |
| Alpha Counter | 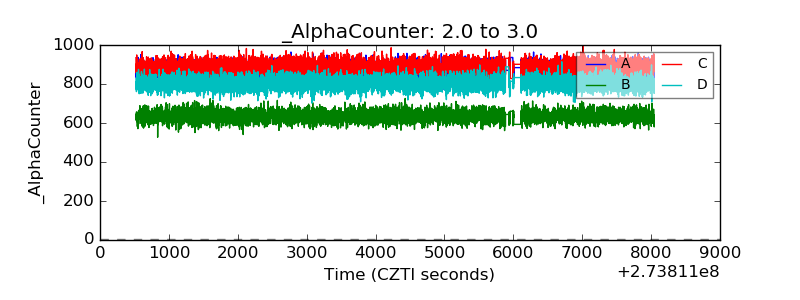 |
| _CPM_Rate | 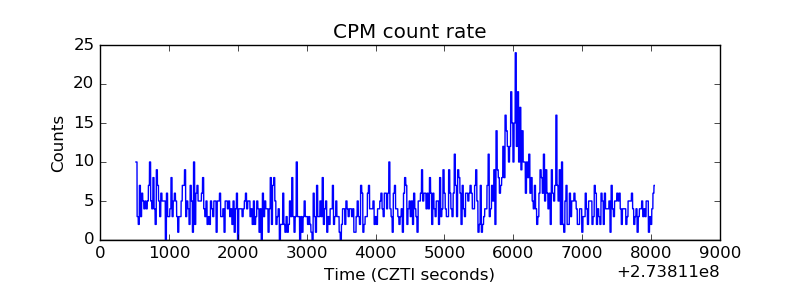 |
| CZT Counter | 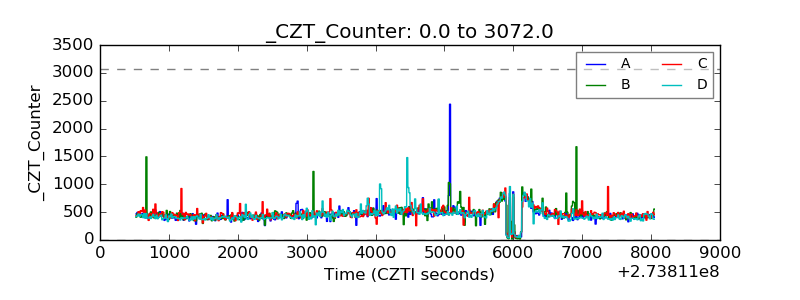 |
| +2.5 Volts monitor |  |
| +5 Volts monitor |  |
| _ROLL_ROT |  |
| _Roll_DEC | 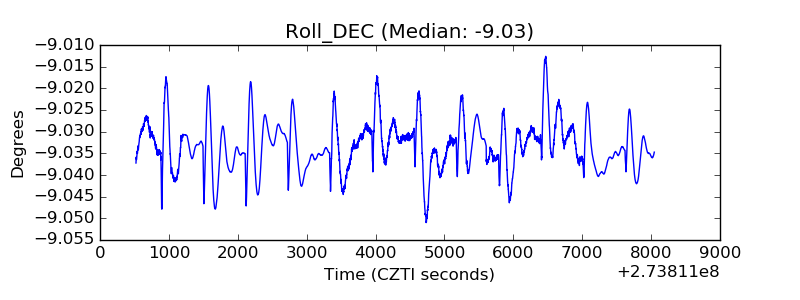 |
| _Roll_RA | 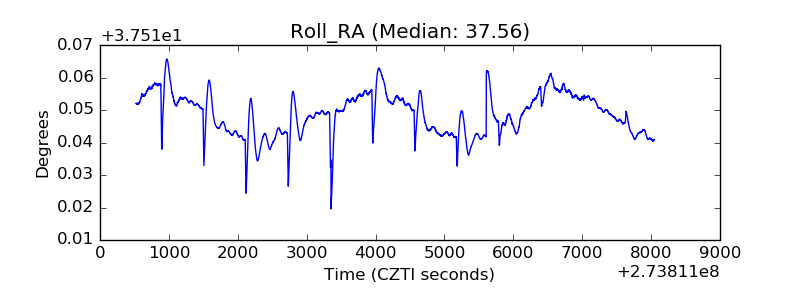 |
| Veto Counter |  |