| Param | Original file | Final file |
|---|---|---|
| Filename | modeM0/AS1A04_143T01_9000002344_15884cztM0_level2.evt | modeM0/AS1A04_143T01_9000002344_15884cztM0_level2_quad_clean.evt |
| Size (bytes) | 89,928,000 | 18,034,560 |
| Size | 85.8 MB | 17.2 MB |
| Events in quadrant A | 657,729 | 110,512 |
| Events in quadrant B | 657,962 | 110,210 |
| Events in quadrant C | 674,466 | 108,831 |
| Events in quadrant D | 629,888 | 106,923 |
| Mode SS | |||
|---|---|---|---|
| Quadrant | BADHDUFLAG | Total packets | Discarded packets |
| A | 0 | 105 | 77 |
| B | 0 | 107 | 73 |
| C | 0 | 104 | 72 |
| D | 0 | 106 | 76 |
| Mode M0 | |||
|---|---|---|---|
| Quadrant | BADHDUFLAG | Total packets | Discarded packets |
| A | 0 | 11292 | 8335 |
| B | 0 | 11454 | 8562 |
| C | 0 | 11074 | 8113 |
| D | 0 | 10919 | 7964 |
| Quadrant | Total seconds | Saturated seconds | Saturation percentage |
|---|---|---|---|
| A | 1465 | 1 | 0.068259% |
| B | 1425 | 1 | 0.070175% |
| C | 1469 | 4 | 0.272294% |
| D | 1471 | 0 | 0.000000% |
Noise dominated data is calculated using 1-second bins in cleaned event files. If a bin has >2000 counts, and if more than 50% of those come from <1% of pixels, then it is considered to be noise-dominated and hence unusable.
| Quadrant | # 1 sec bins | Bins with >0 counts | Bins with >2000 counts | High rate bins dominated by noise | Noise dominated (total time) | Noise dominated (detector-on time) | Marked lightcurve |
|---|---|---|---|---|---|---|---|
| A | 4896 | 1987 | 0 | 0 | 0.00% | 0.00% | 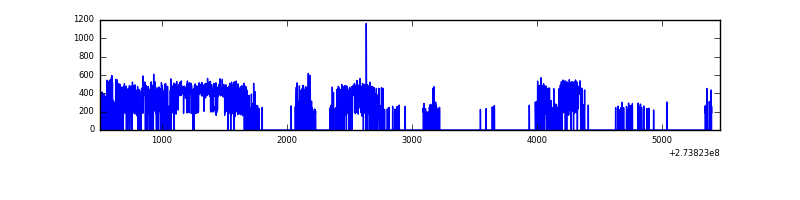 |
| B | 4955 | 1889 | 0 | 0 | 0.00% | 0.00% |  |
| C | 4948 | 1903 | 0 | 0 | 0.00% | 0.00% | 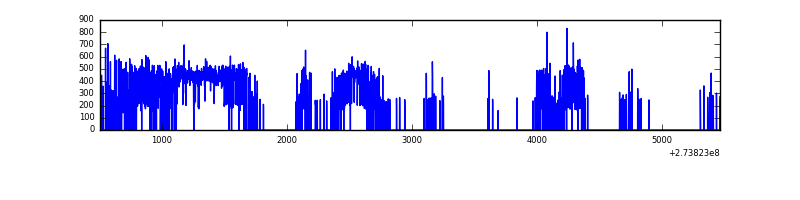 |
| D | 4913 | 1950 | 0 | 0 | 0.00% | 0.00% | 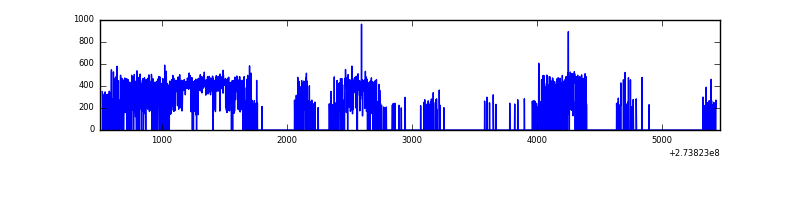 |
Top three noisy pixels from each quadrant. If the there are fewer than three noisy pixels in the level2.evt file, extra rows are filled as -1
| Pixel properties | Quadrant properties | ||||||
|---|---|---|---|---|---|---|---|
| Quadrant | DetID | PixID | Counts | Sigma | Mean | Median | Sigma |
| A | 15 | 239 | 2661 | 69.21 | 169 | 165 | 36.1 |
| A | 7 | 16 | 2312 | 59.53 | 169 | 165 | 36.1 |
| A | 0 | 226 | 1488 | 36.68 | 169 | 165 | 36.1 |
| B | 5 | 65 | 6875 | 197.76 | 163 | 159 | 34.0 |
| B | 4 | 216 | 5079 | 144.88 | 163 | 159 | 34.0 |
| B | 12 | 111 | 3792 | 106.98 | 163 | 159 | 34.0 |
| C | 14 | 238 | 25564 | 640.88 | 162 | 162 | 39.6 |
| C | 3 | 233 | 8375 | 207.21 | 162 | 162 | 39.6 |
| C | 8 | 128 | 2478 | 58.43 | 162 | 162 | 39.6 |
| D | 2 | 234 | 5758 | 131.07 | 165 | 160 | 42.7 |
| D | 1 | 52 | 1794 | 38.26 | 165 | 160 | 42.7 |
| D | 14 | 226 | 1557 | 32.71 | 165 | 160 | 42.7 |
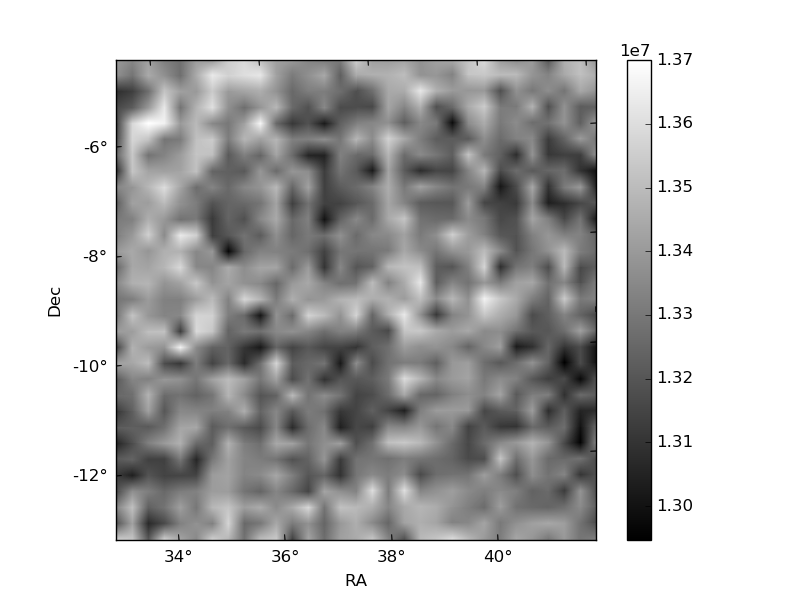
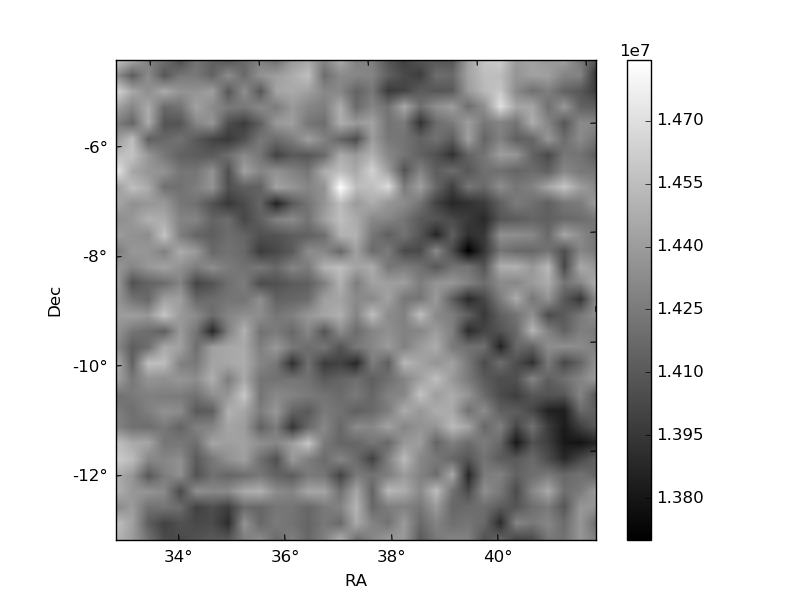
Histogram calculated using DETX and DETY for each event in the final _common_clean file
| Quadrant A |  |
 |
Quadrant B |
|---|---|---|---|
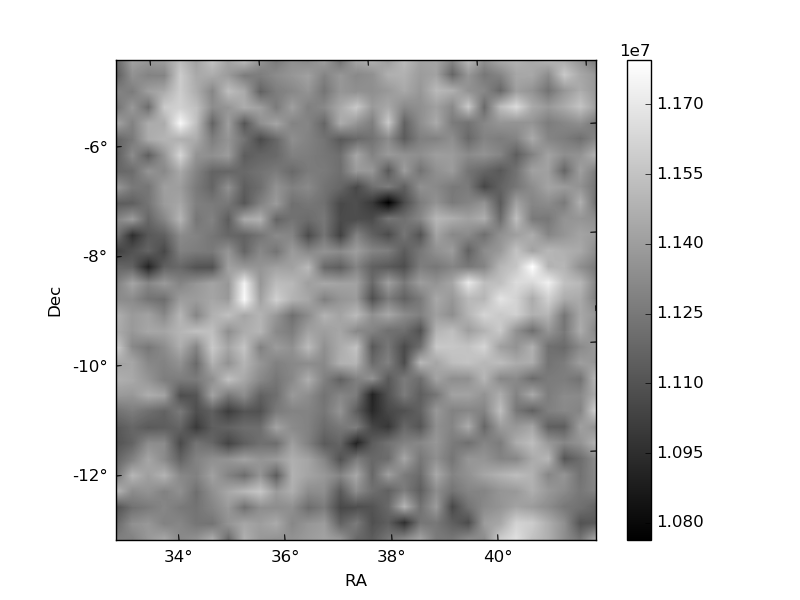
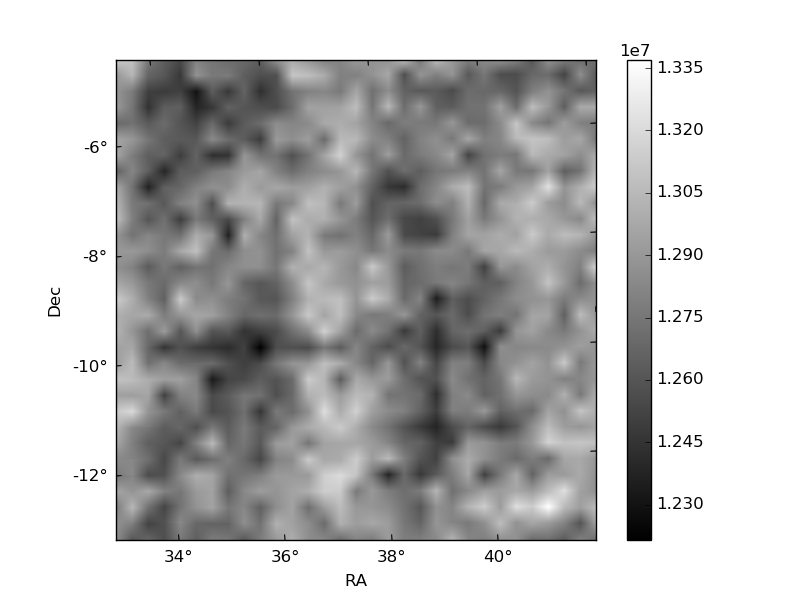
| Quadrant D | 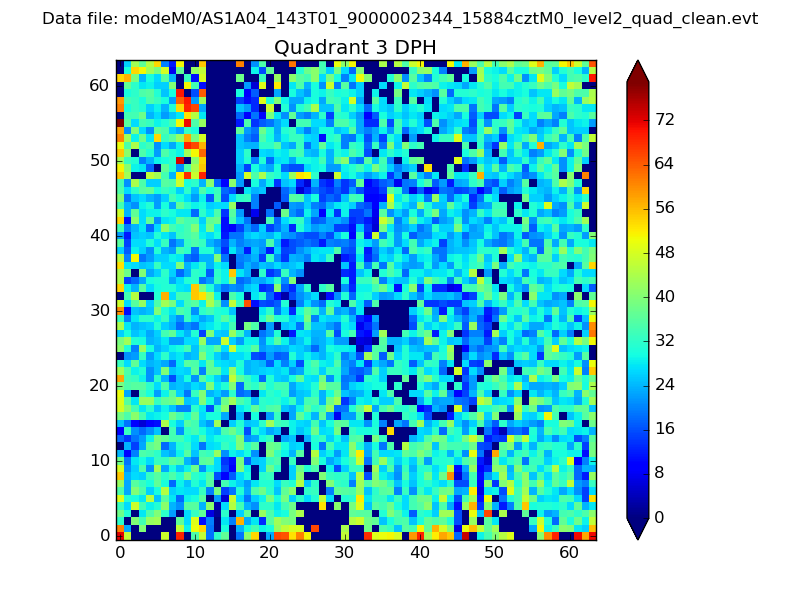 |
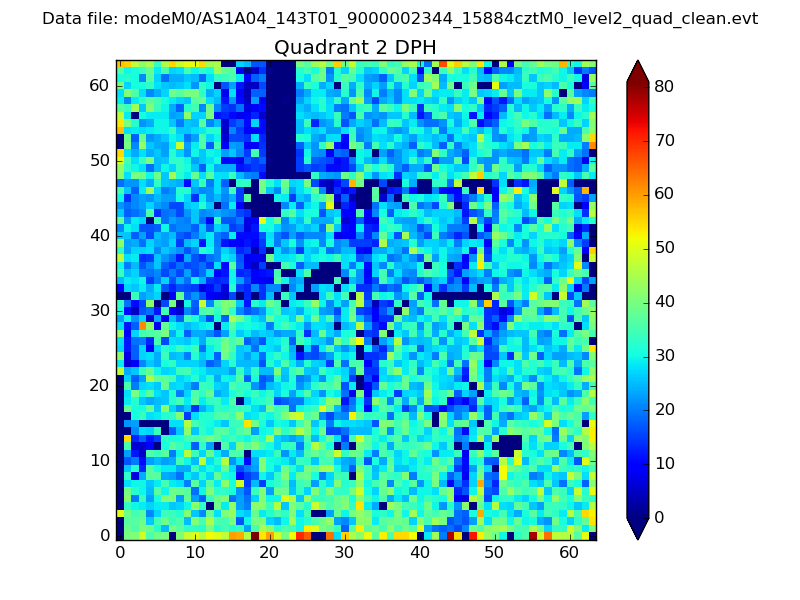 |
Quadrant C |
| Plot type | Count rate plots | Images |
|---|---|---|
| Comparison with Poisson distribution Blue bars denote a histogram of data divided into 1 sec bins. Red curve is a Poisson curve with rate = median count rate of data. |
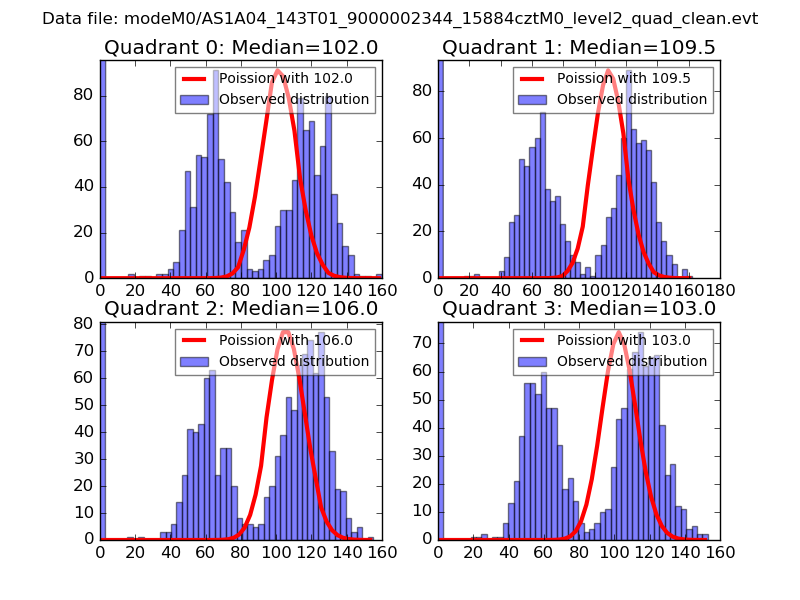 |
 |
| Quadrant-wise count rates Data is divided into 100 sec bins |
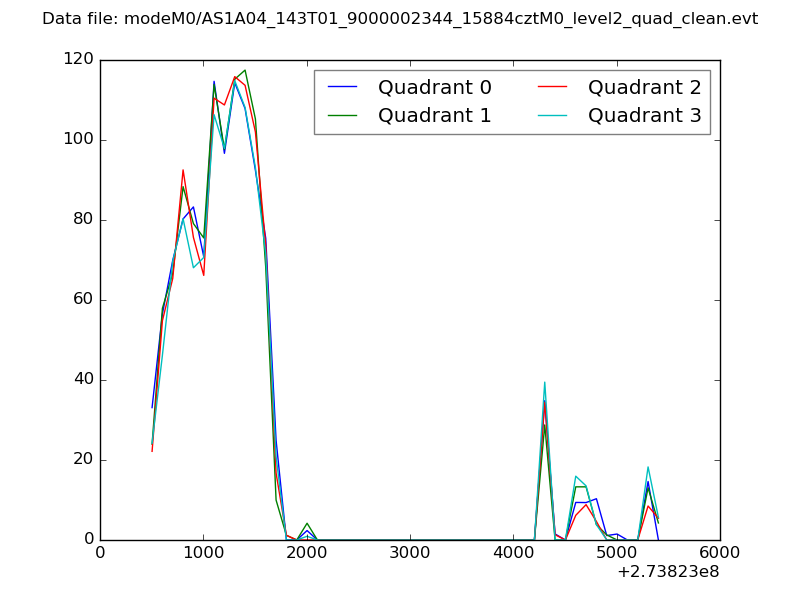 |
|
| Module-wise count rates for Quadrant A Data is divided into 100 sec bins |
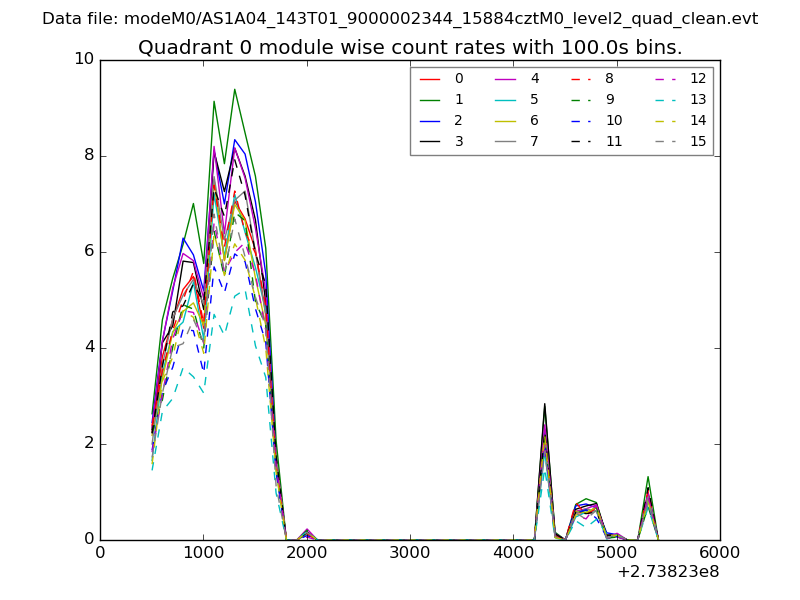 |
 |
| Module-wise count rates for Quadrant B Data is divided into 100 sec bins |
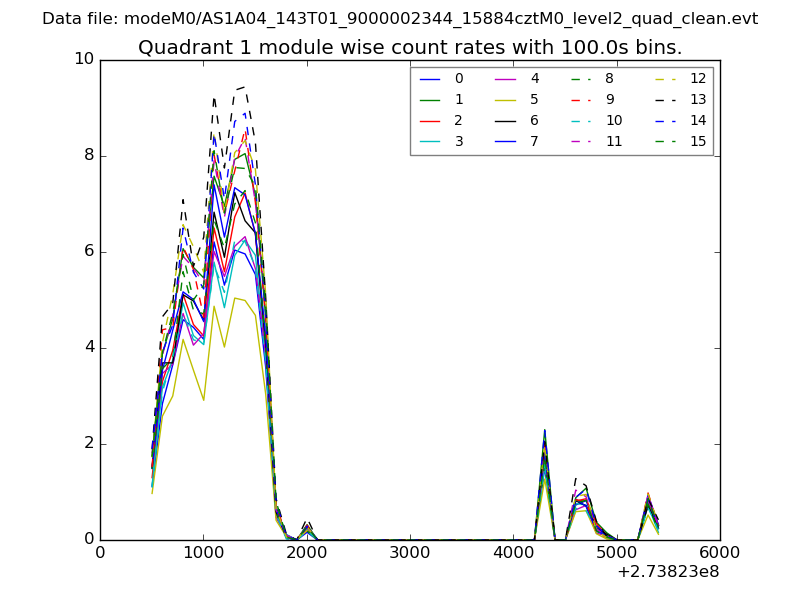 |
 |
| Module-wise count rates for Quadrant C Data is divided into 100 sec bins |
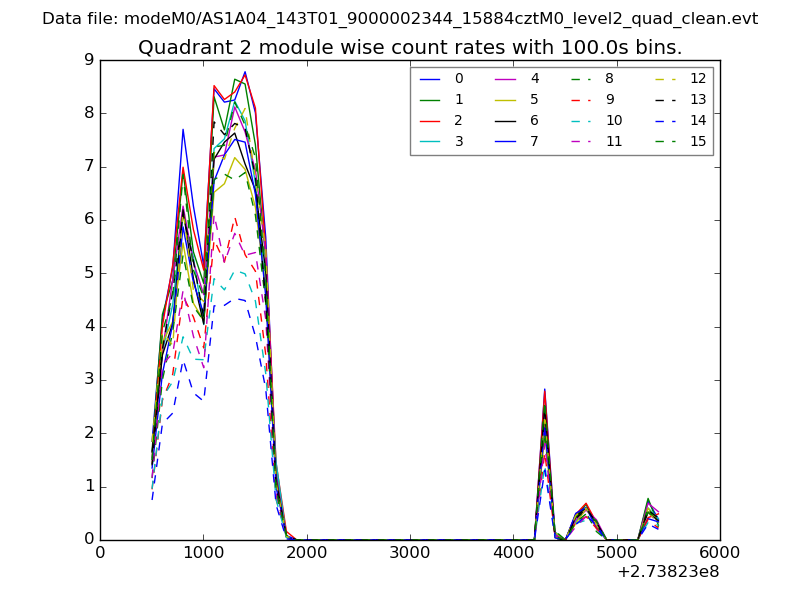 |
 |
| Module-wise count rates for Quadrant D Data is divided into 100 sec bins |
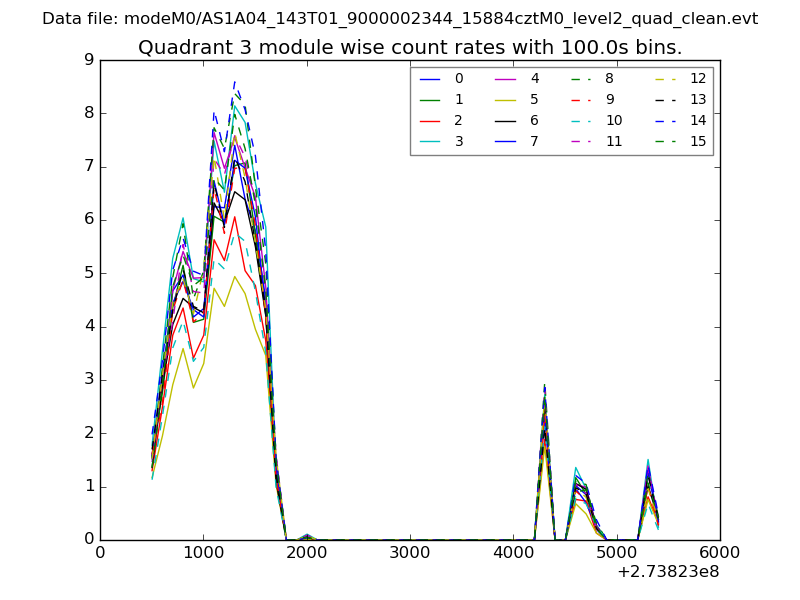 |
 |
| Parameter | Plot |
|---|---|
| CZT HV Monitor | 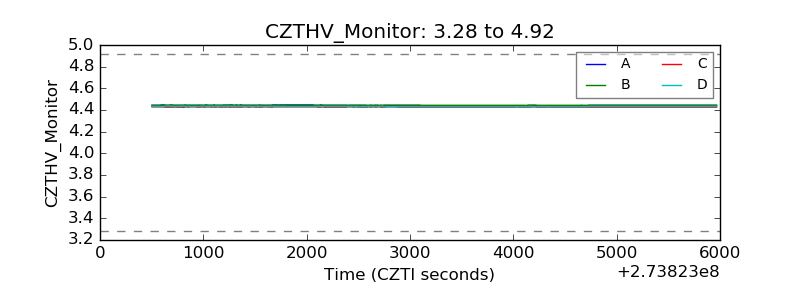 |
| D_VDD | 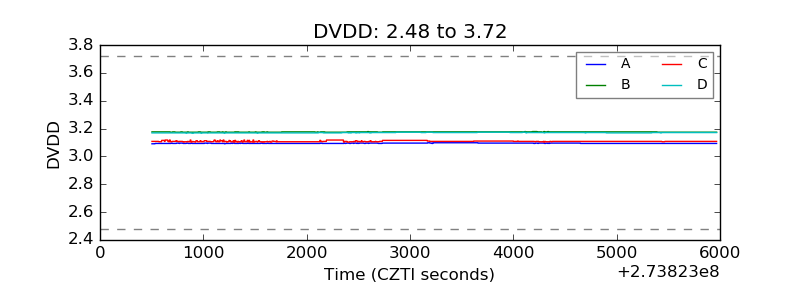 |
| Temperature 1 | 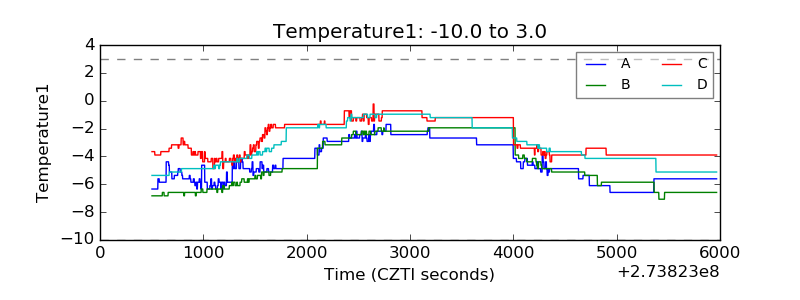 |
| Veto HV Monitor |  |
| Veto LLD | 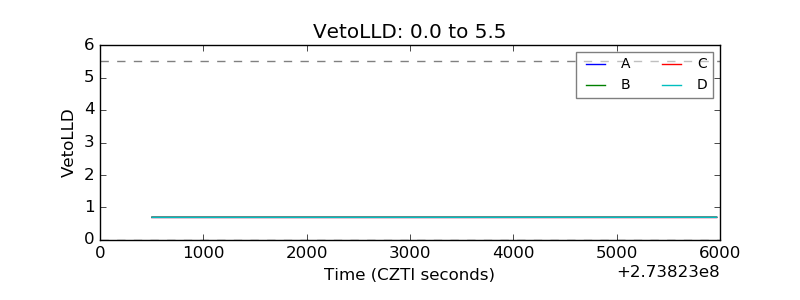 |
| Alpha Counter | 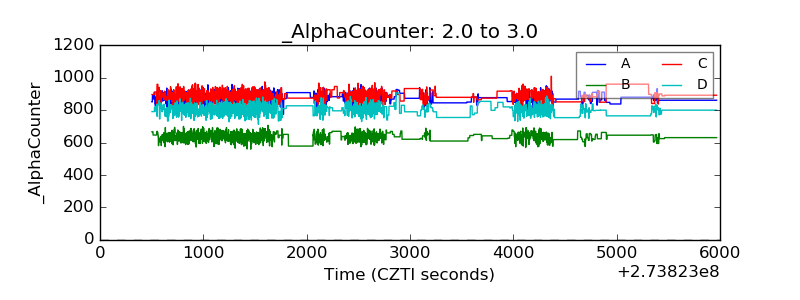 |
| _CPM_Rate | 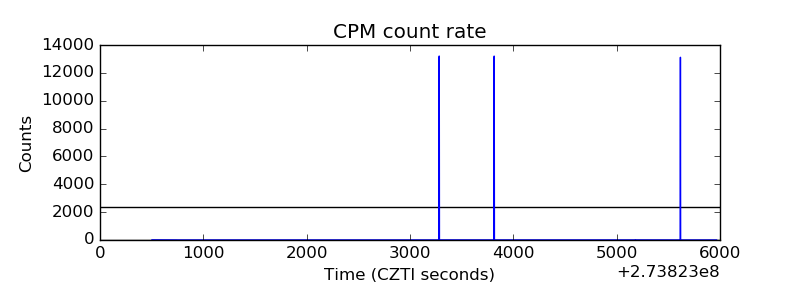 |
| CZT Counter | 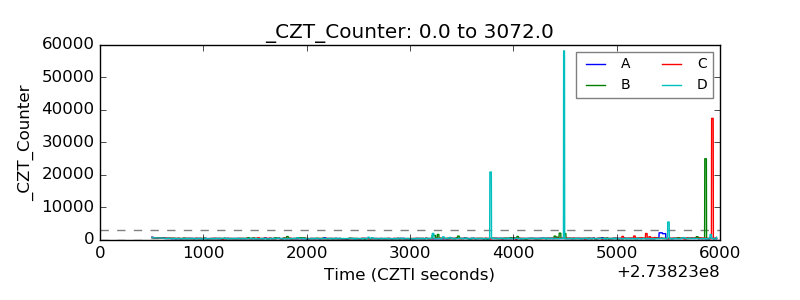 |
| +2.5 Volts monitor |  |
| +5 Volts monitor |  |
| _ROLL_ROT | 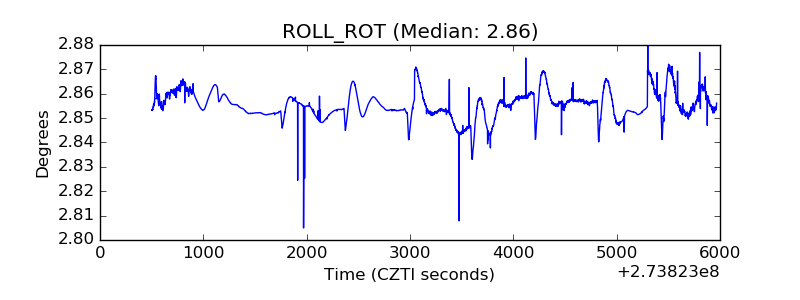 |
| _Roll_DEC |  |
| _Roll_RA | 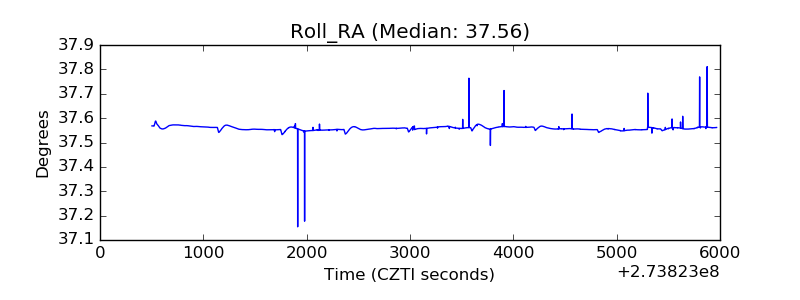 |
| Veto Counter | 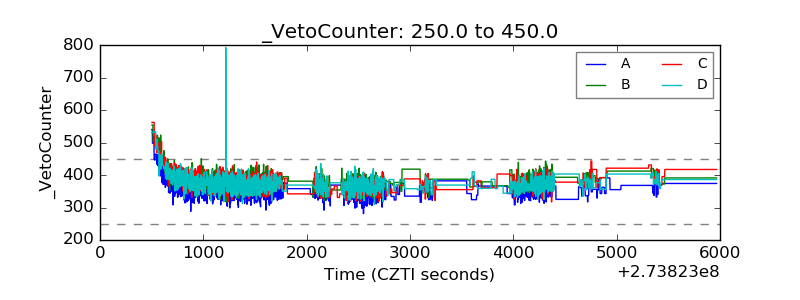 |