| Param | Original file | Final file |
|---|---|---|
| Filename | modeM0/AS1A04_143T01_9000002344_15886cztM0_level2.evt | modeM0/AS1A04_143T01_9000002344_15886cztM0_level2_quad_clean.evt |
| Size (bytes) | 914,253,120 | 135,682,560 |
| Size | 871.9 MB | 129.4 MB |
| Events in quadrant A | 6,227,834 | 819,482 |
| Events in quadrant B | 6,306,583 | 839,217 |
| Events in quadrant C | 8,401,417 | 781,654 |
| Events in quadrant D | 5,897,197 | 794,817 |
| Mode SS | |||
|---|---|---|---|
| Quadrant | BADHDUFLAG | Total packets | Discarded packets |
| A | 0 | 258 | 0 |
| B | 0 | 258 | 0 |
| C | 0 | 258 | 0 |
| D | 0 | 258 | 0 |
| Mode M0 | |||
|---|---|---|---|
| Quadrant | BADHDUFLAG | Total packets | Discarded packets |
| A | 0 | 26770 | 3 |
| B | 0 | 26586 | 2 |
| C | 0 | 33066 | 2 |
| D | 0 | 26374 | 2 |
| Mode M9 | |||
|---|---|---|---|
| Quadrant | BADHDUFLAG | Total packets | Discarded packets |
| A | 0 | 12 | 0 |
| B | 0 | 12 | 0 |
| C | 0 | 12 | 0 |
| D | 0 | 12 | 0 |
| Quadrant | Total seconds | Saturated seconds | Saturation percentage |
|---|---|---|---|
| A | 12631 | 221 | 1.749664% |
| B | 12631 | 158 | 1.250891% |
| C | 12631 | 749 | 5.929855% |
| D | 12631 | 130 | 1.029214% |
Noise dominated data is calculated using 1-second bins in cleaned event files. If a bin has >2000 counts, and if more than 50% of those come from <1% of pixels, then it is considered to be noise-dominated and hence unusable.
| Quadrant | # 1 sec bins | Bins with >0 counts | Bins with >2000 counts | High rate bins dominated by noise | Noise dominated (total time) | Noise dominated (detector-on time) | Marked lightcurve |
|---|---|---|---|---|---|---|---|
| A | 13897 | 12632 | 62 | 62 | 0.45% | 0.49% | 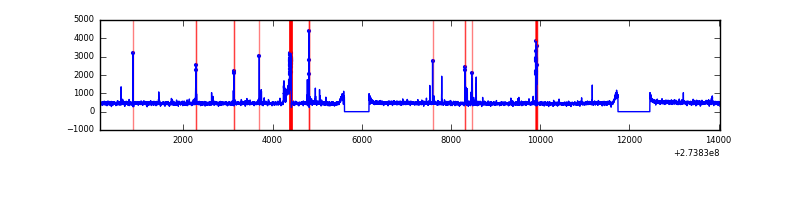 |
| B | 13897 | 12632 | 8 | 8 | 0.06% | 0.06% | 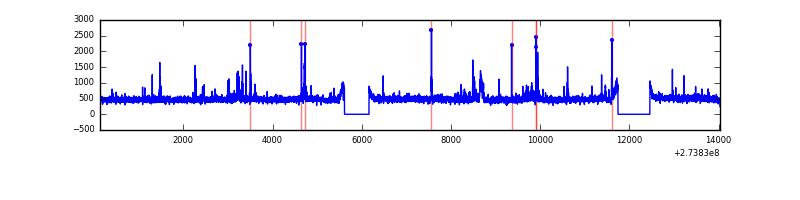 |
| C | 13897 | 12632 | 382 | 382 | 2.75% | 3.02% | 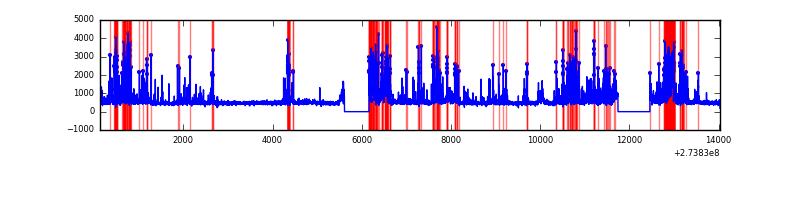 |
| D | 13897 | 12632 | 17 | 17 | 0.12% | 0.13% | 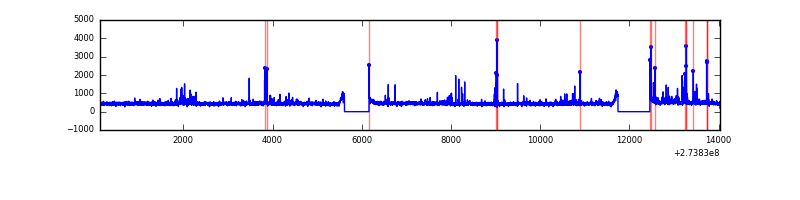 |
Top three noisy pixels from each quadrant. If the there are fewer than three noisy pixels in the level2.evt file, extra rows are filled as -1
| Pixel properties | Quadrant properties | ||||||
|---|---|---|---|---|---|---|---|
| Quadrant | DetID | PixID | Counts | Sigma | Mean | Median | Sigma |
| A | 15 | 239 | 381698 | 1236.14 | 1508 | 1470 | 307.6 |
| A | 7 | 16 | 44488 | 139.85 | 1508 | 1470 | 307.6 |
| A | 0 | 226 | 13288 | 38.42 | 1508 | 1470 | 307.6 |
| B | 4 | 173 | 83144 | 281.26 | 1511 | 1468 | 290.4 |
| B | 4 | 216 | 77958 | 263.4 | 1511 | 1468 | 290.4 |
| B | 3 | 209 | 40621 | 134.83 | 1511 | 1468 | 290.4 |
| C | 9 | 236 | 2476746 | 7377.08 | 1427 | 1432 | 335.5 |
| C | 14 | 238 | 219446 | 649.74 | 1427 | 1432 | 335.5 |
| C | 3 | 233 | 75299 | 220.14 | 1427 | 1432 | 335.5 |
| D | 12 | 218 | 231466 | 639.25 | 1476 | 1432 | 359.8 |
| D | 2 | 234 | 48232 | 130.05 | 1476 | 1432 | 359.8 |
| D | 10 | 70 | 33551 | 89.26 | 1476 | 1432 | 359.8 |
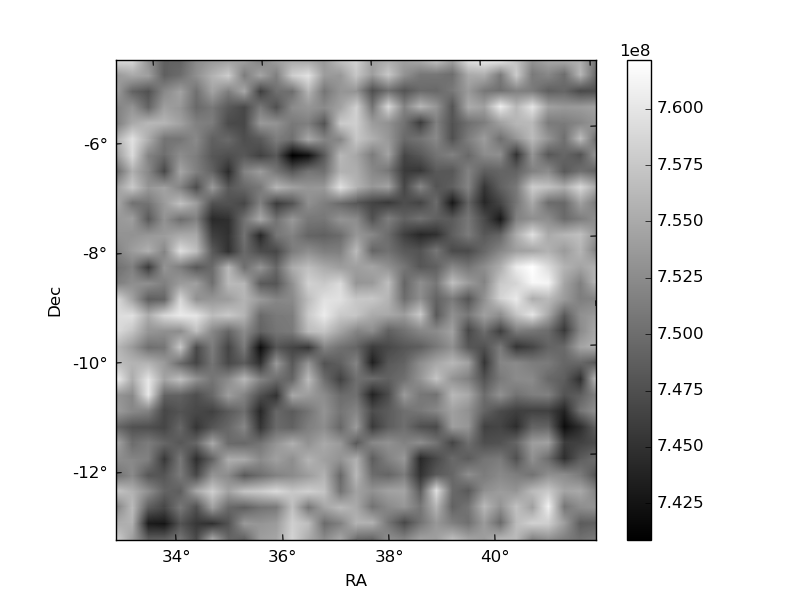
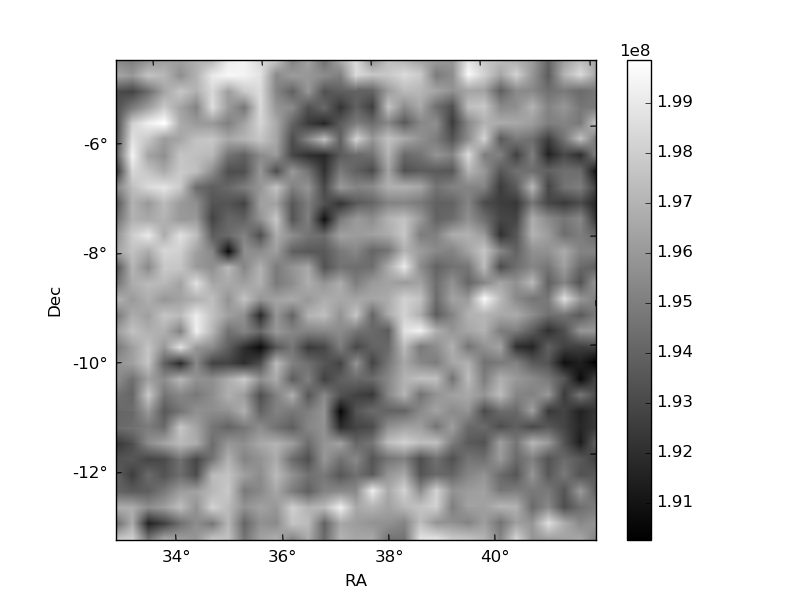
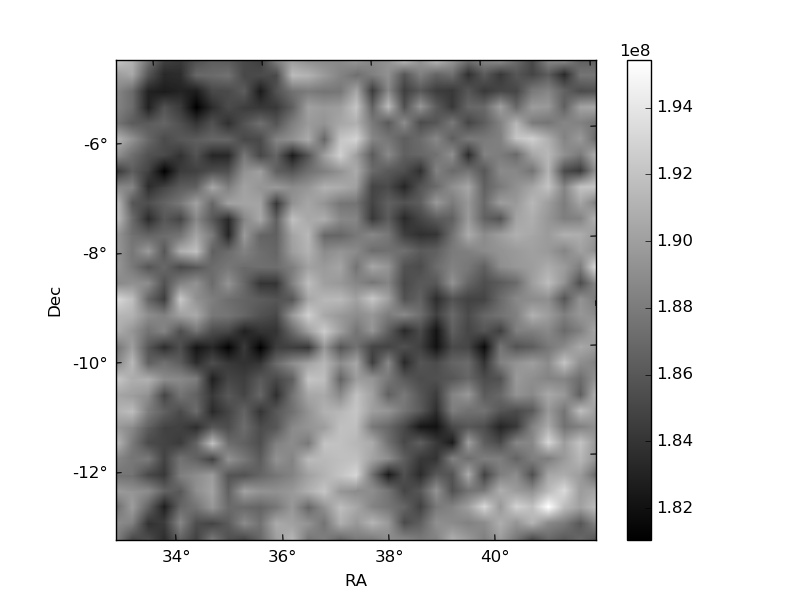
Histogram calculated using DETX and DETY for each event in the final _common_clean file
| Quadrant A | 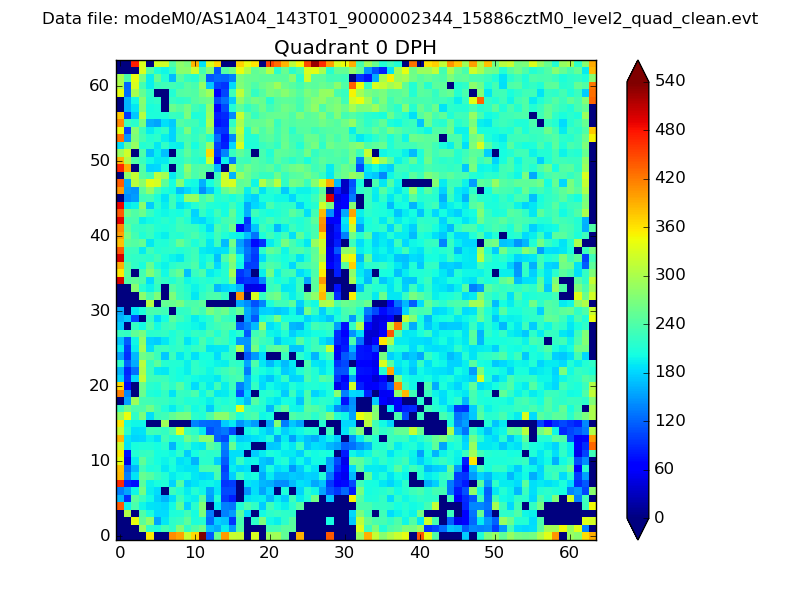 |
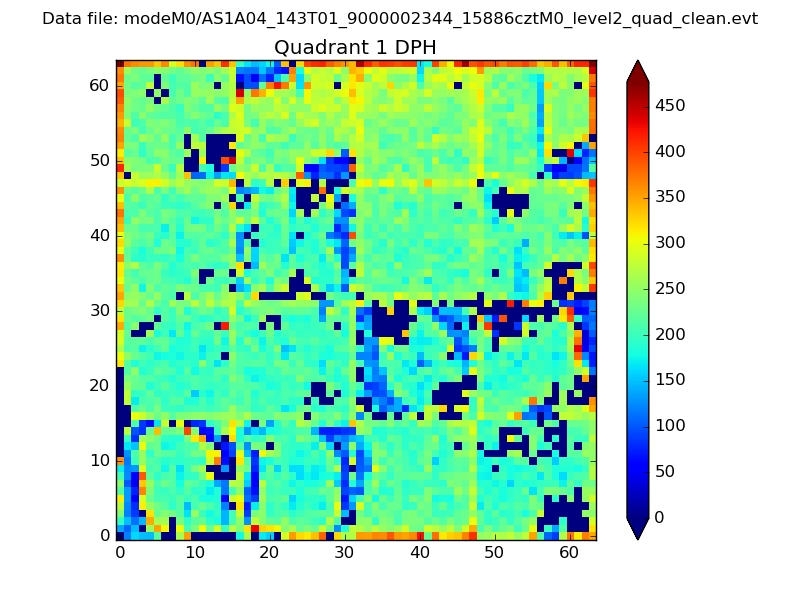 |
Quadrant B |
|---|---|---|---|
| Quadrant D | 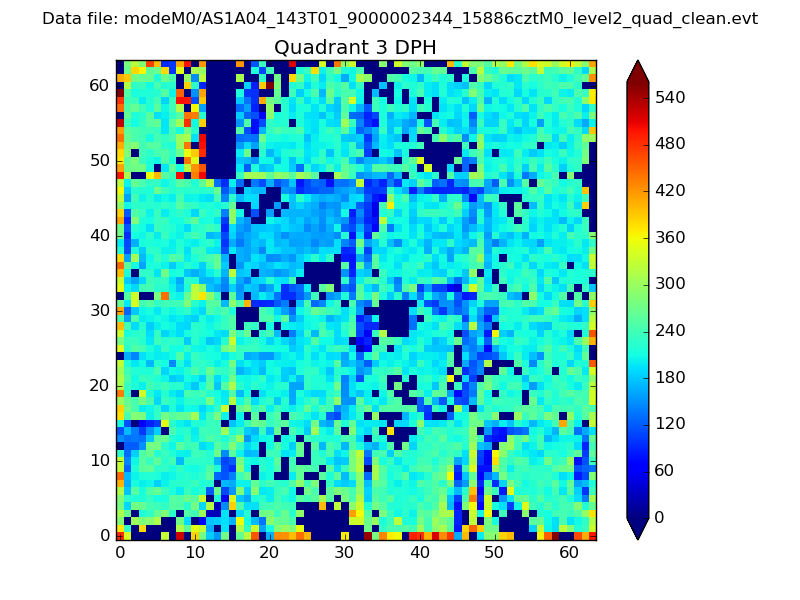 |
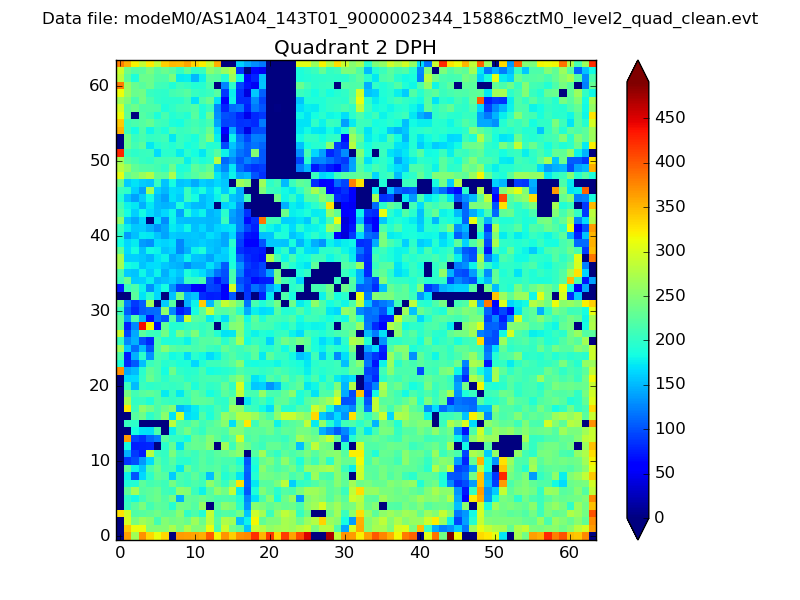 |
Quadrant C |
| Plot type | Count rate plots | Images |
|---|---|---|
| Comparison with Poisson distribution Blue bars denote a histogram of data divided into 1 sec bins. Red curve is a Poisson curve with rate = median count rate of data. |
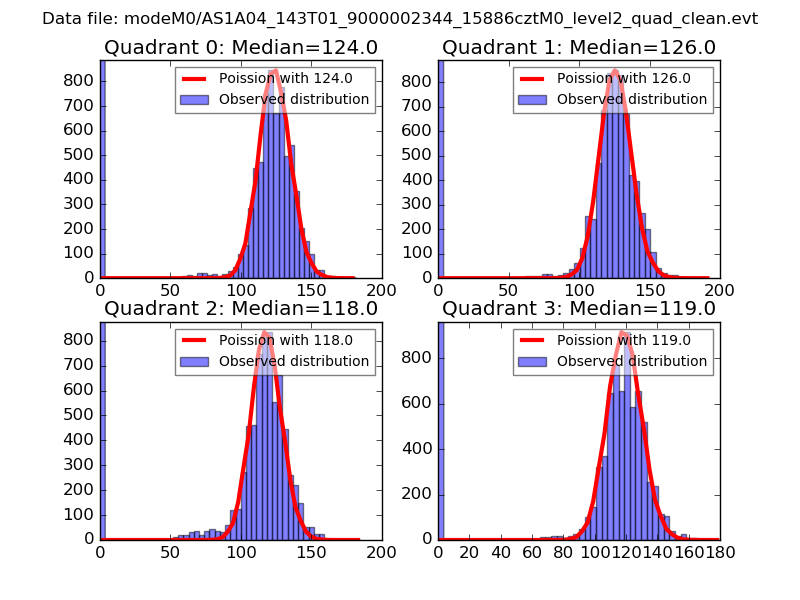 |
 |
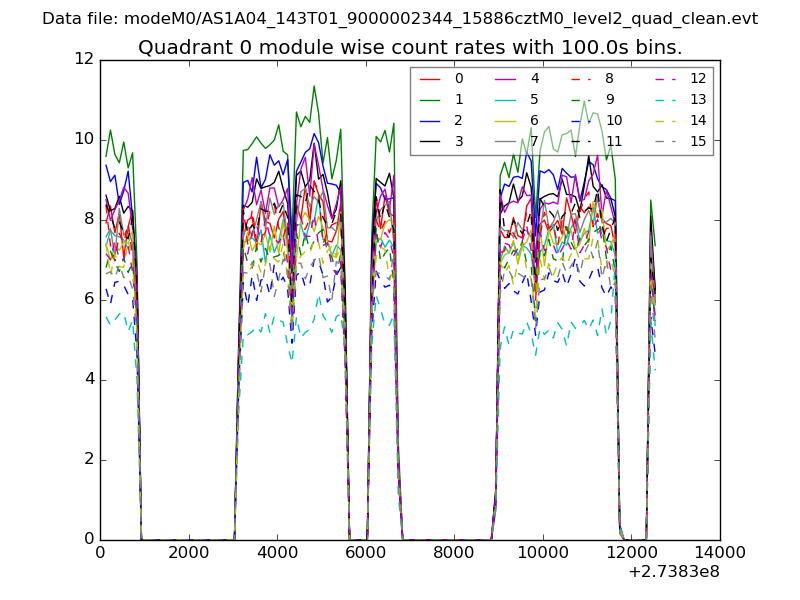
| Quadrant-wise count rates Data is divided into 100 sec bins |
 |
|
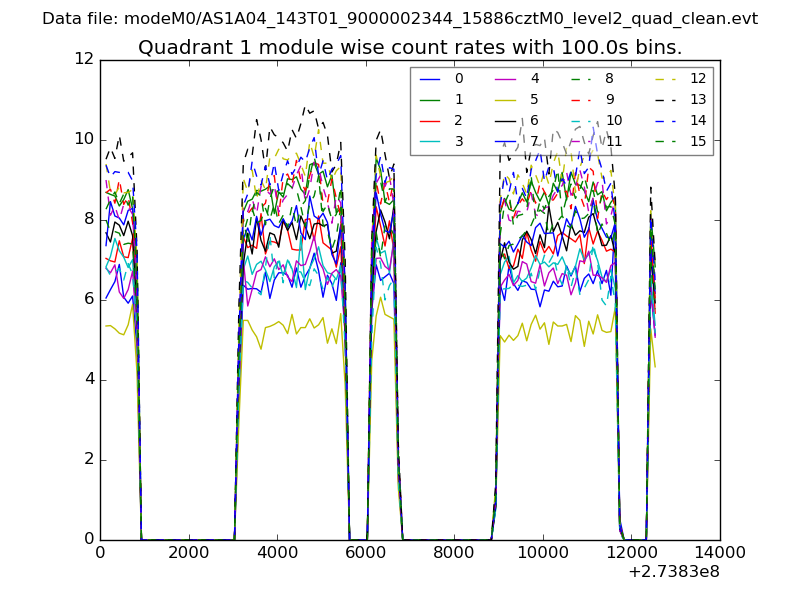
| Module-wise count rates for Quadrant A Data is divided into 100 sec bins |
 |
 |
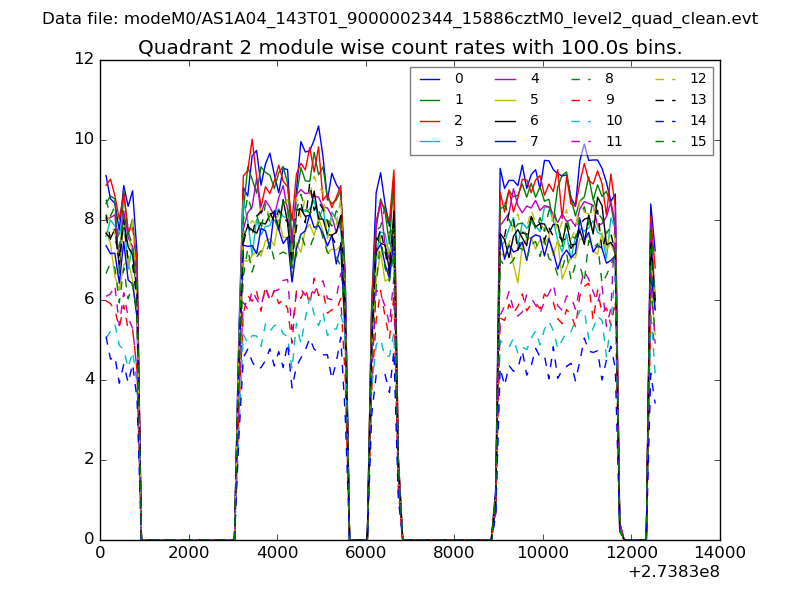
| Module-wise count rates for Quadrant B Data is divided into 100 sec bins |
 |
 |
| Module-wise count rates for Quadrant C Data is divided into 100 sec bins |
 |
 |
| Module-wise count rates for Quadrant D Data is divided into 100 sec bins |
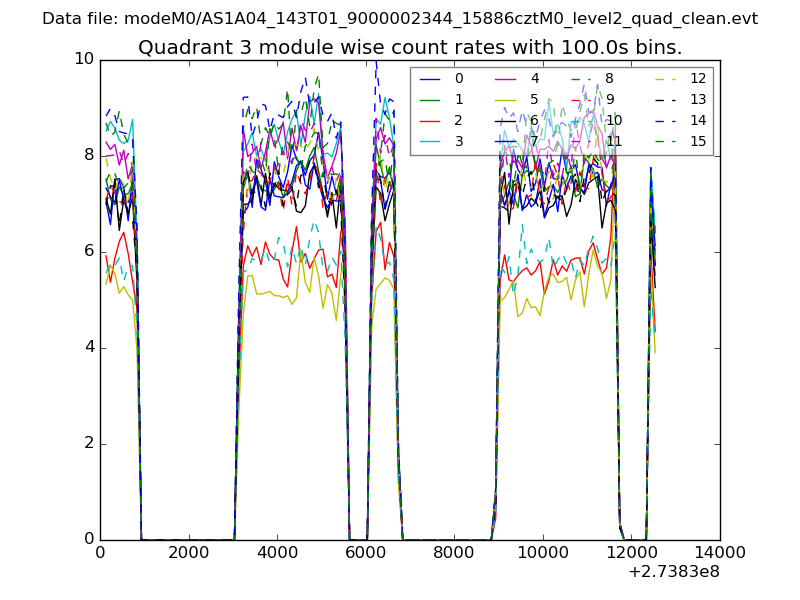 |
 |
| Parameter | Plot |
|---|---|
| CZT HV Monitor | 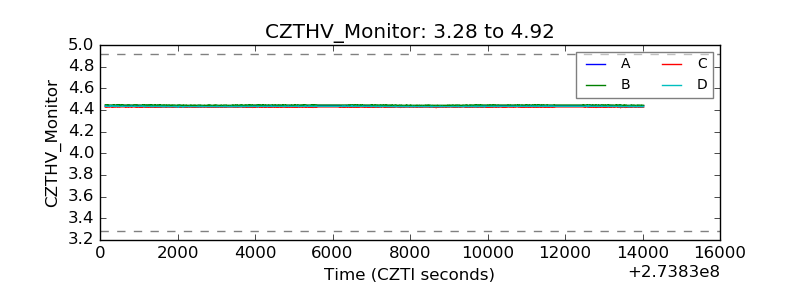 |
| D_VDD | 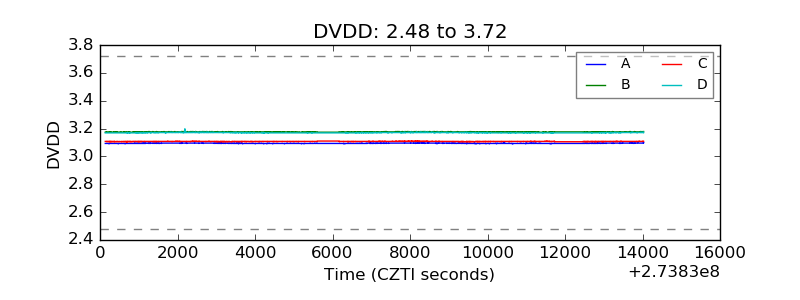 |
| Temperature 1 | 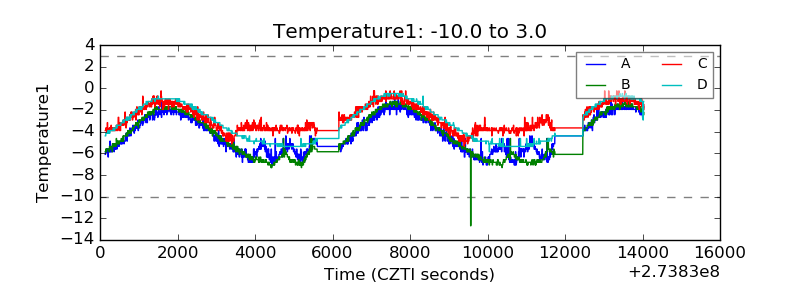 |
| Veto HV Monitor |  |
| Veto LLD | 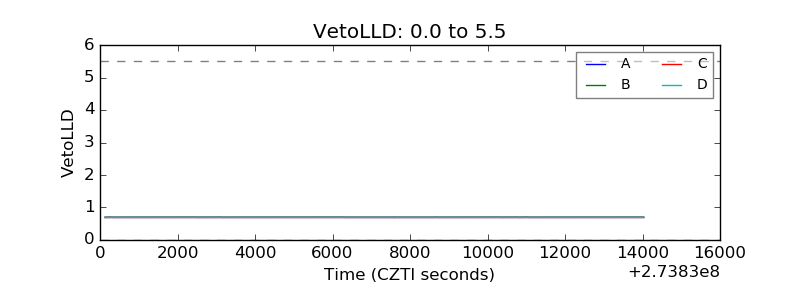 |
| Alpha Counter | 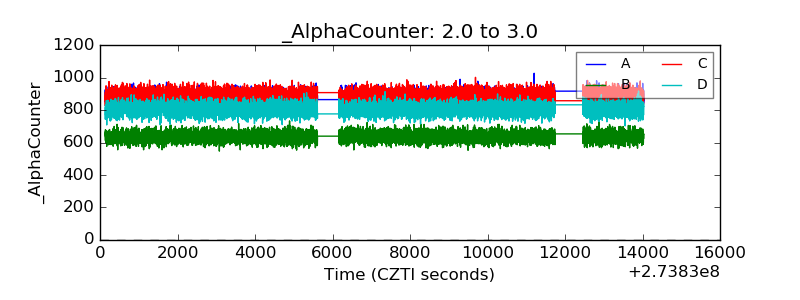 |
| _CPM_Rate | 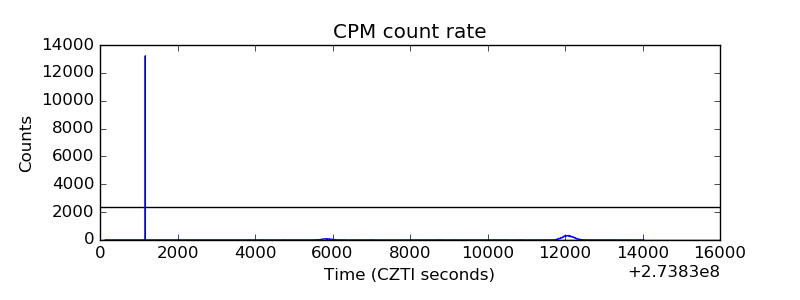 |
| CZT Counter | 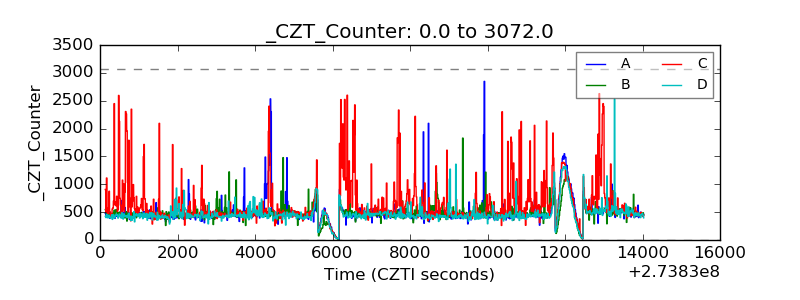 |
| +2.5 Volts monitor | 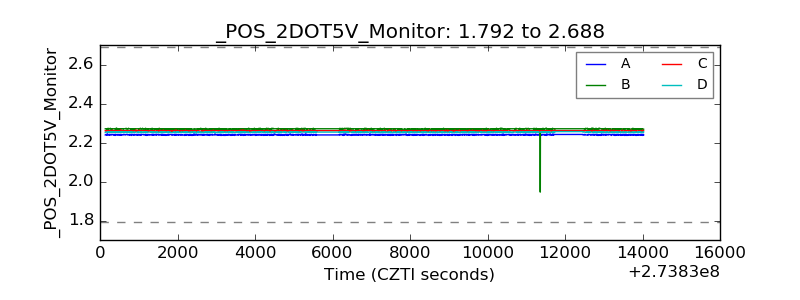 |
| +5 Volts monitor |  |
| _ROLL_ROT | 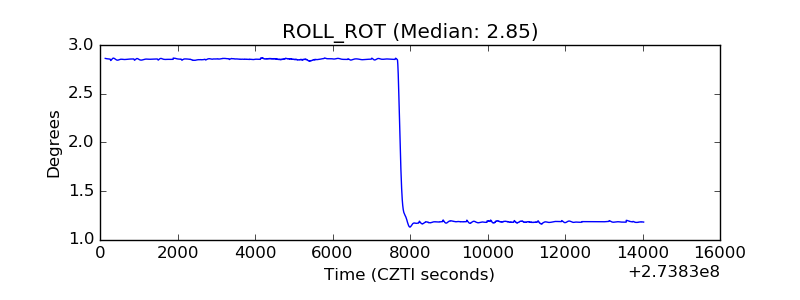 |
| _Roll_DEC | 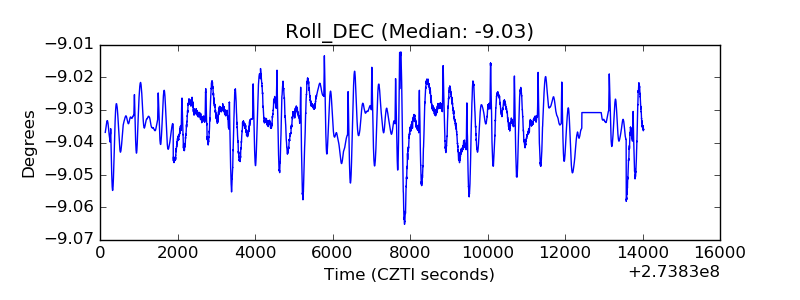 |
| _Roll_RA | 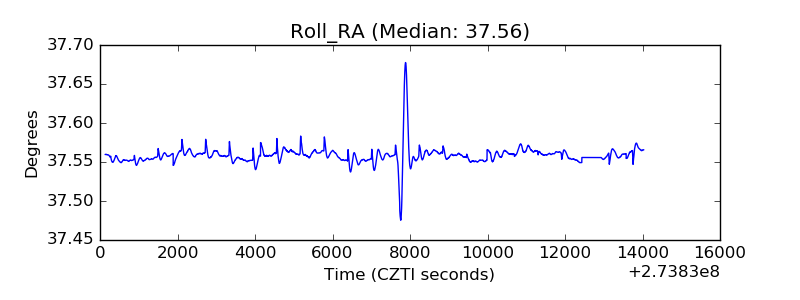 |
| Veto Counter | 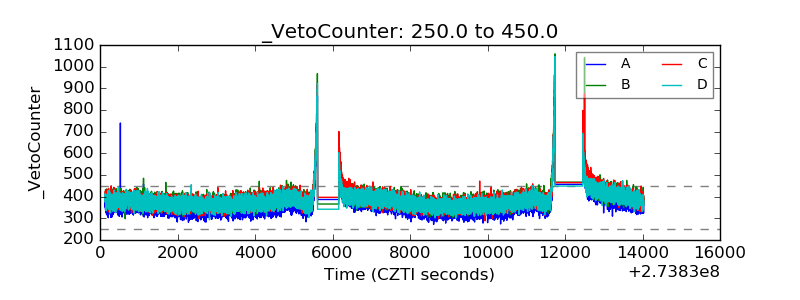 |