| Param | Original file | Final file |
|---|---|---|
| Filename | modeM0/AS1A04_143T01_9000002344_15891cztM0_level2.evt | modeM0/AS1A04_143T01_9000002344_15891cztM0_level2_quad_clean.evt |
| Size (bytes) | 2,533,464,000 | 464,509,440 |
| Size | 2.4 GB | 443.0 MB |
| Events in quadrant A | 18,261,449 | 2,928,836 |
| Events in quadrant B | 18,630,131 | 3,010,483 |
| Events in quadrant C | 20,355,839 | 2,831,460 |
| Events in quadrant D | 17,059,141 | 2,836,615 |
| Mode SS | |||
|---|---|---|---|
| Quadrant | BADHDUFLAG | Total packets | Discarded packets |
| A | 0 | 736 | 0 |
| B | 0 | 736 | 0 |
| C | 0 | 736 | 0 |
| D | 0 | 736 | 0 |
| Mode M0 | |||
|---|---|---|---|
| Quadrant | BADHDUFLAG | Total packets | Discarded packets |
| A | 0 | 77941 | 8 |
| B | 0 | 78138 | 7 |
| C | 0 | 83364 | 7 |
| D | 0 | 75726 | 7 |
| Mode M9 | |||
|---|---|---|---|
| Quadrant | BADHDUFLAG | Total packets | Discarded packets |
| A | 0 | 58 | 0 |
| B | 0 | 58 | 0 |
| C | 0 | 58 | 0 |
| D | 0 | 58 | 0 |
| Quadrant | Total seconds | Saturated seconds | Saturation percentage |
|---|---|---|---|
| A | 35823 | 801 | 2.235994% |
| B | 35823 | 556 | 1.552075% |
| C | 35823 | 1277 | 3.564749% |
| D | 35823 | 415 | 1.158474% |
Noise dominated data is calculated using 1-second bins in cleaned event files. If a bin has >2000 counts, and if more than 50% of those come from <1% of pixels, then it is considered to be noise-dominated and hence unusable.
| Quadrant | # 1 sec bins | Bins with >0 counts | Bins with >2000 counts | High rate bins dominated by noise | Noise dominated (total time) | Noise dominated (detector-on time) | Marked lightcurve |
|---|---|---|---|---|---|---|---|
| A | 41829 | 35826 | 229 | 229 | 0.55% | 0.64% | 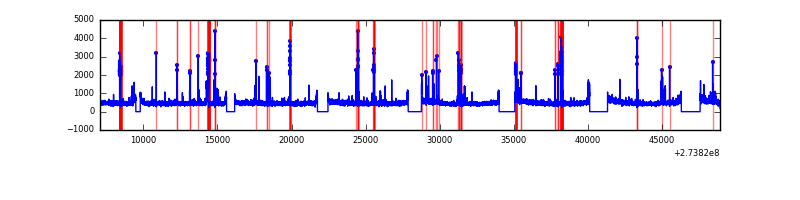 |
| B | 41829 | 35825 | 19 | 19 | 0.05% | 0.05% | 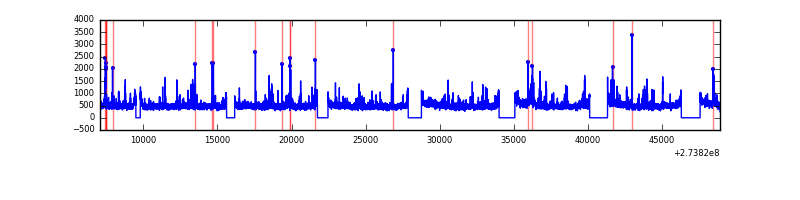 |
| C | 41829 | 35826 | 443 | 443 | 1.06% | 1.24% | 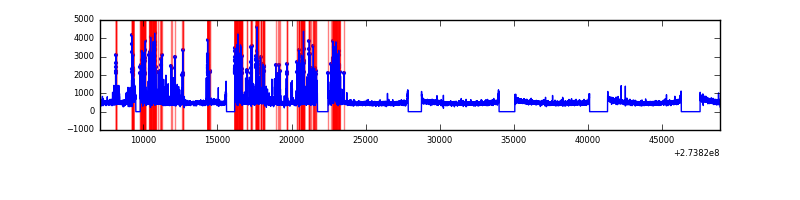 |
| D | 41829 | 35827 | 51 | 51 | 0.12% | 0.14% | 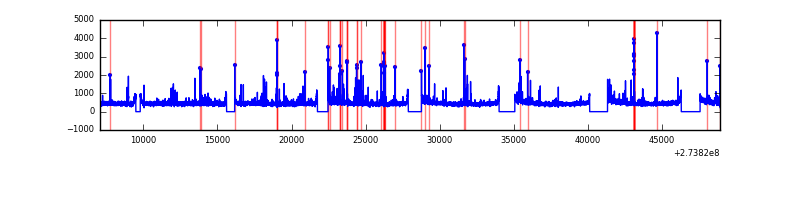 |
Top three noisy pixels from each quadrant. If the there are fewer than three noisy pixels in the level2.evt file, extra rows are filled as -1
| Pixel properties | Quadrant properties | ||||||
|---|---|---|---|---|---|---|---|
| Quadrant | DetID | PixID | Counts | Sigma | Mean | Median | Sigma |
| A | 15 | 239 | 1151664 | 1304.53 | 4390 | 4291 | 879.5 |
| A | 15 | 157 | 96290 | 104.6 | 4390 | 4291 | 879.5 |
| A | 7 | 16 | 66367 | 70.58 | 4390 | 4291 | 879.5 |
| B | 4 | 173 | 282909 | 335.65 | 4429 | 4313 | 830.0 |
| B | 4 | 216 | 271439 | 321.83 | 4429 | 4313 | 830.0 |
| B | 5 | 65 | 244178 | 288.99 | 4429 | 4313 | 830.0 |
| C | 9 | 236 | 2881034 | 2931.34 | 4222 | 4251 | 981.4 |
| C | 14 | 238 | 649542 | 657.53 | 4222 | 4251 | 981.4 |
| C | 3 | 233 | 265592 | 266.3 | 4222 | 4251 | 981.4 |
| D | 12 | 218 | 352394 | 333.89 | 4307 | 4194 | 1042.9 |
| D | 2 | 234 | 146554 | 136.51 | 4307 | 4194 | 1042.9 |
| D | 13 | 172 | 102505 | 94.27 | 4307 | 4194 | 1042.9 |
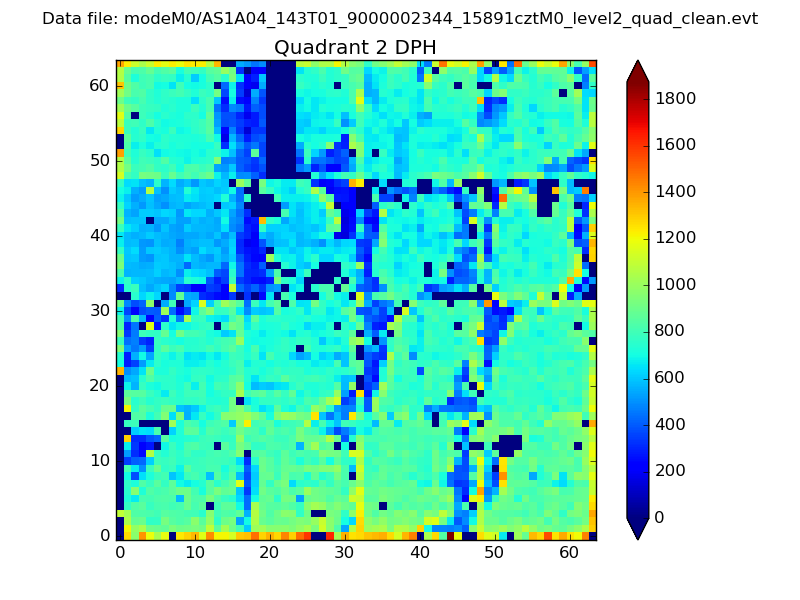
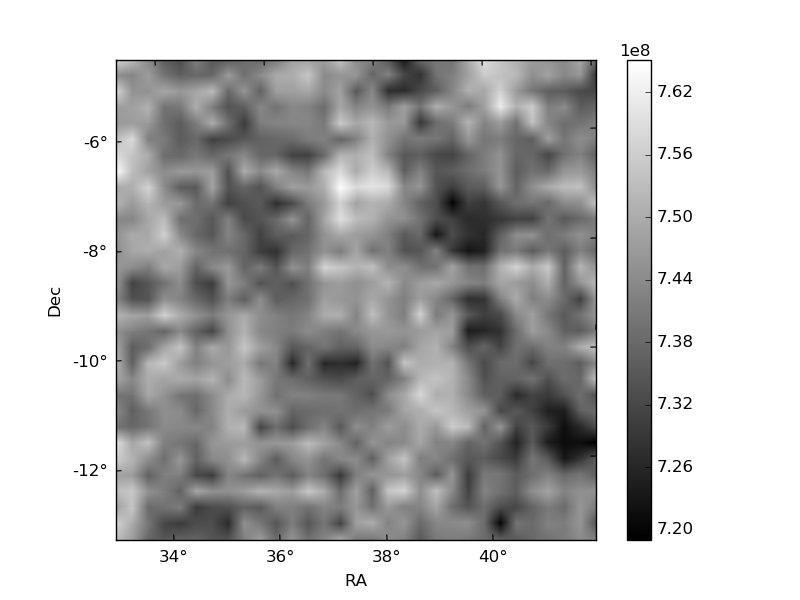
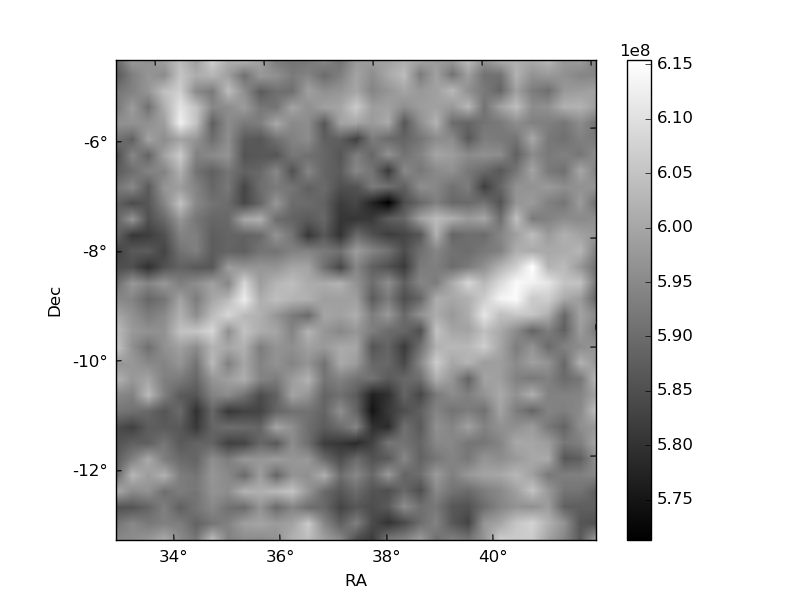
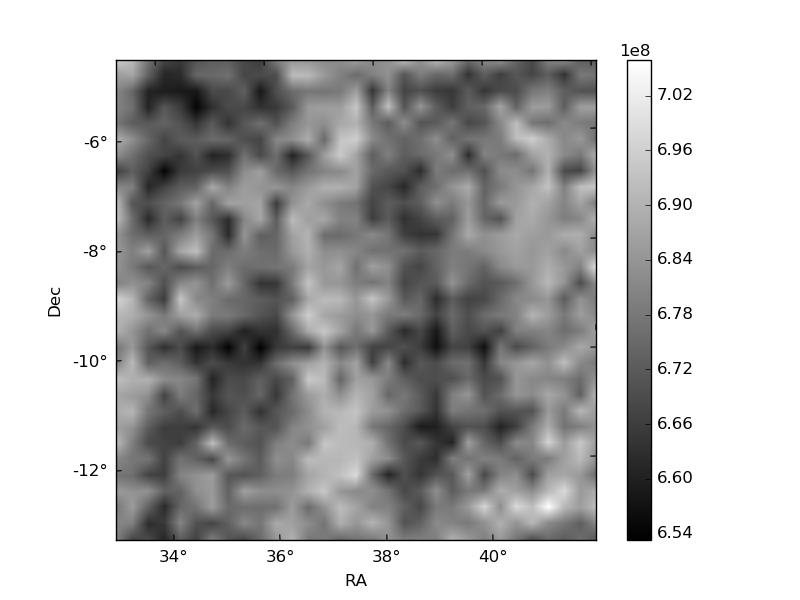
Histogram calculated using DETX and DETY for each event in the final _common_clean file
| Quadrant A | 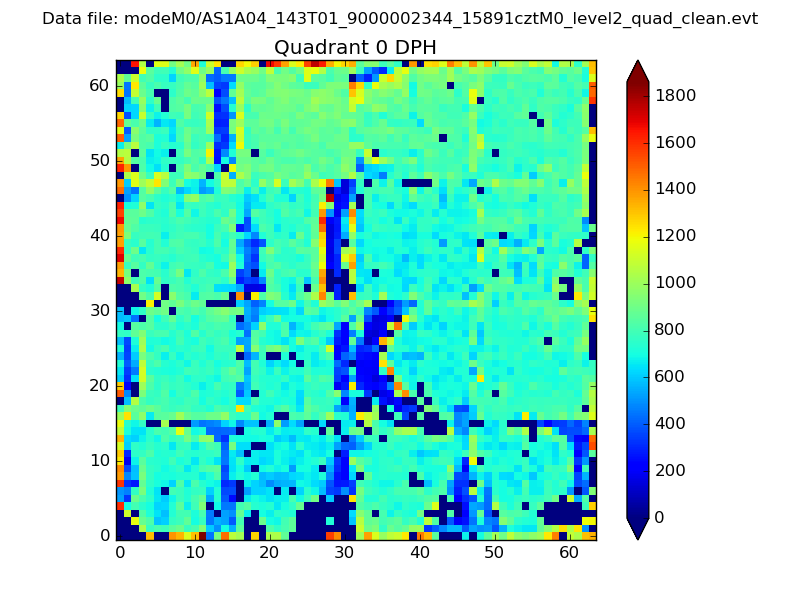 |
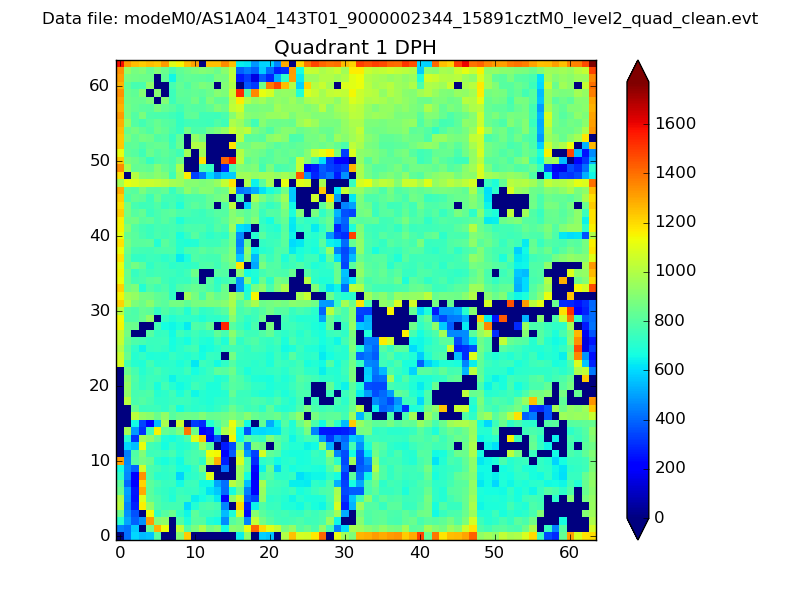 |
Quadrant B |
|---|---|---|---|
| Quadrant D | 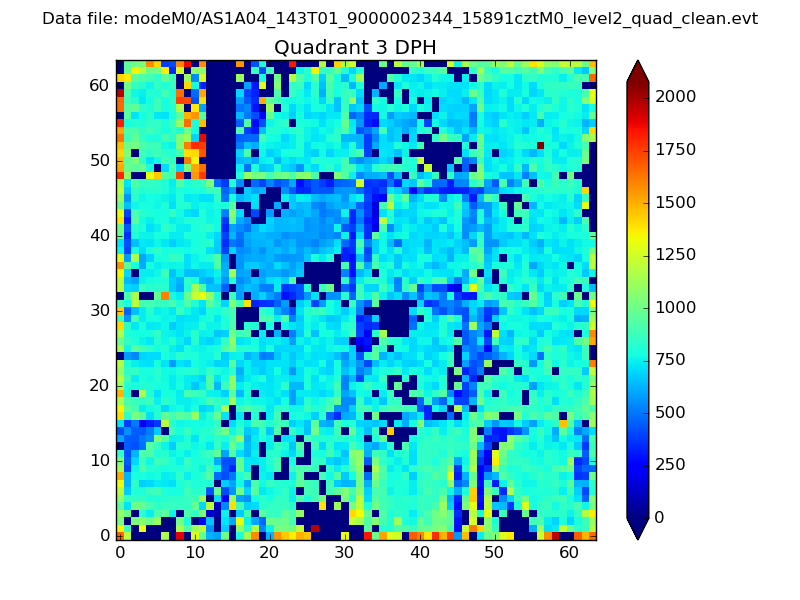 |
 |
Quadrant C |
| Plot type | Count rate plots | Images |
|---|---|---|
| Comparison with Poisson distribution Blue bars denote a histogram of data divided into 1 sec bins. Red curve is a Poisson curve with rate = median count rate of data. |
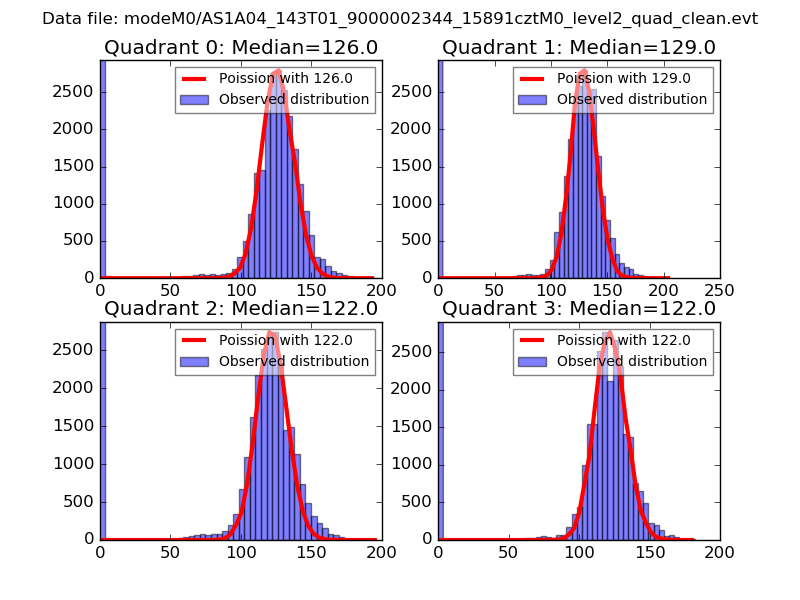 |
 |
| Quadrant-wise count rates Data is divided into 100 sec bins |
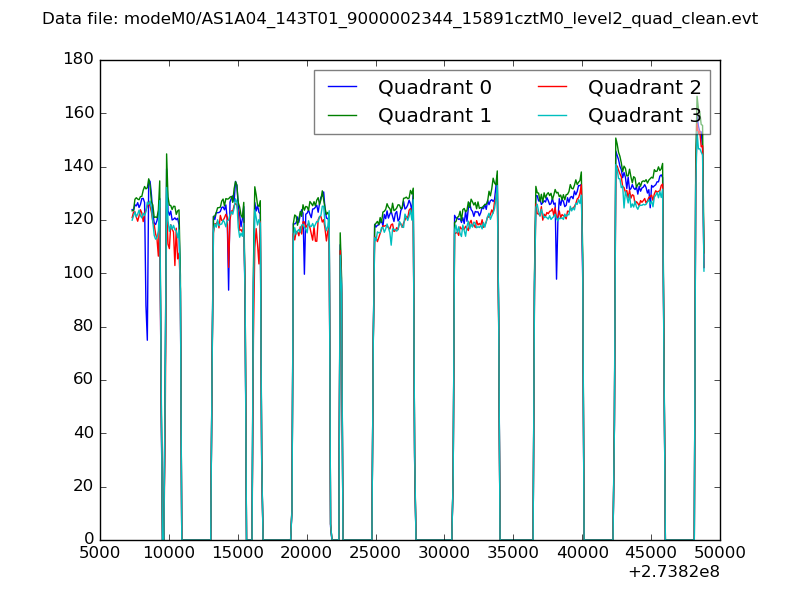 |
|
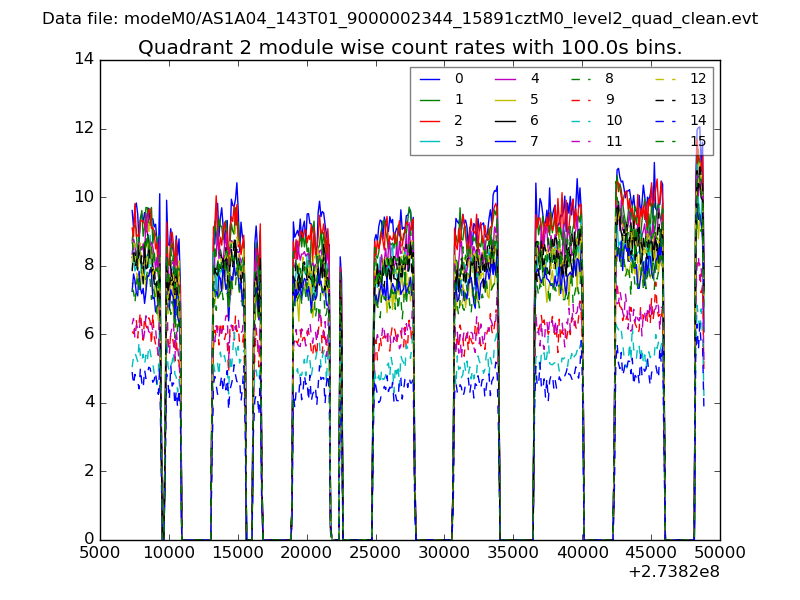
| Module-wise count rates for Quadrant A Data is divided into 100 sec bins |
 |
 |
| Module-wise count rates for Quadrant B Data is divided into 100 sec bins |
 |
 |
| Module-wise count rates for Quadrant C Data is divided into 100 sec bins |
 |
 |
| Module-wise count rates for Quadrant D Data is divided into 100 sec bins |
 |
 |
| Parameter | Plot |
|---|---|
| CZT HV Monitor |  |
| D_VDD |  |
| Temperature 1 | 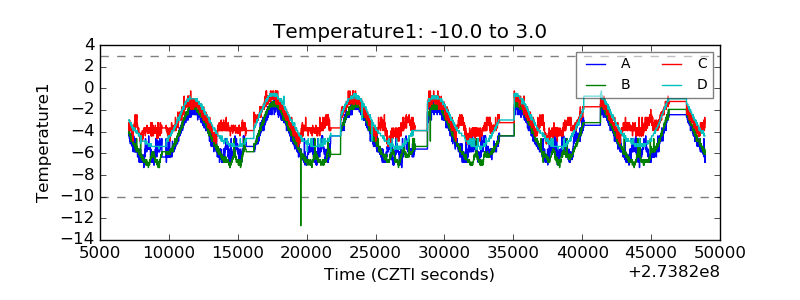 |
| Veto HV Monitor | 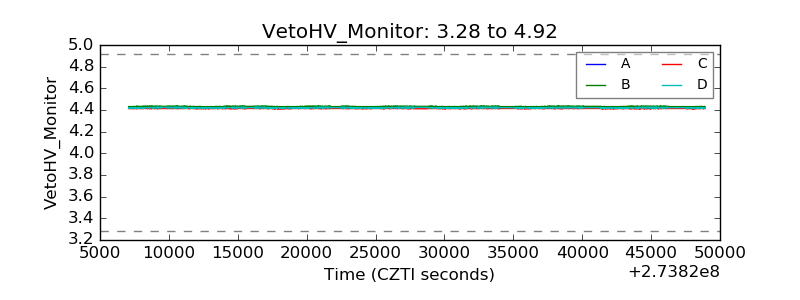 |
| Veto LLD |  |
| Alpha Counter | 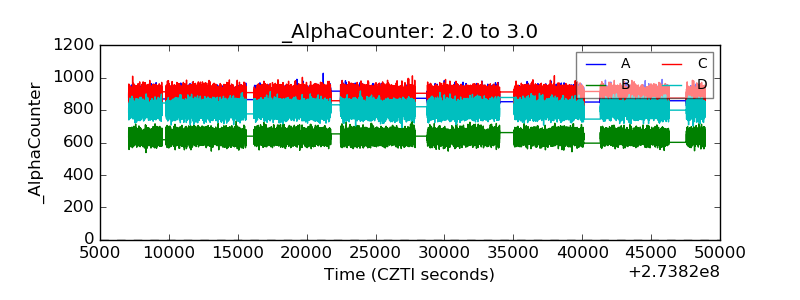 |
| _CPM_Rate | 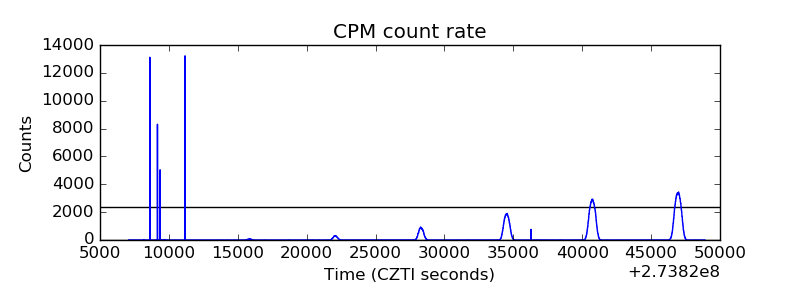 |
| CZT Counter | 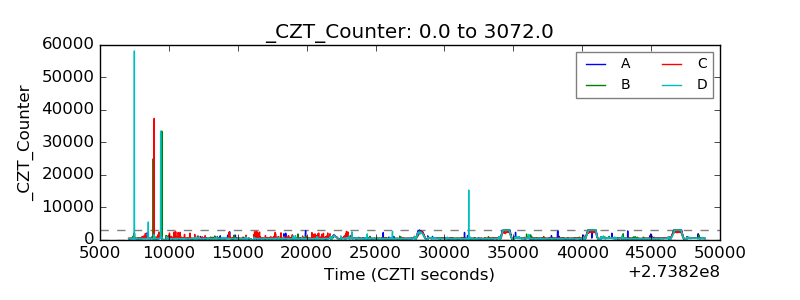 |
| +2.5 Volts monitor | 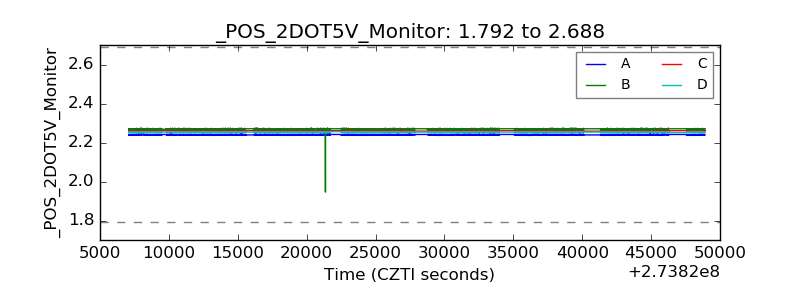 |
| +5 Volts monitor |  |
| _ROLL_ROT |  |
| _Roll_DEC | 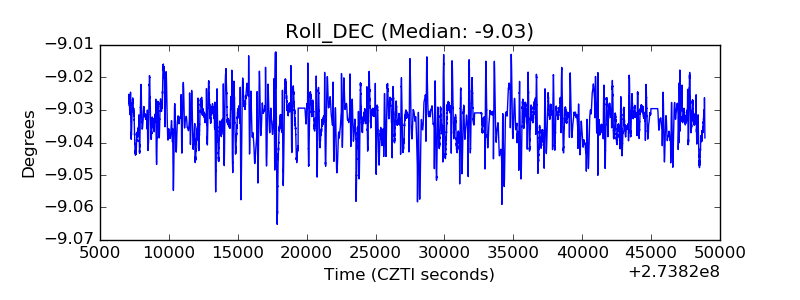 |
| _Roll_RA | 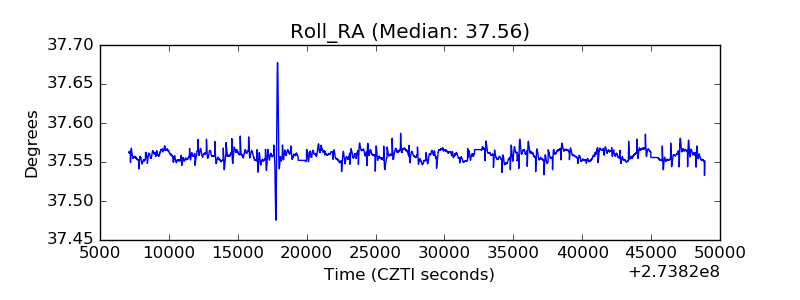 |
| Veto Counter |  |