| Param | Original file | Final file |
|---|---|---|
| Filename | modeM0/AS1A04_143T01_9000002344_15893cztM0_level2.evt | modeM0/AS1A04_143T01_9000002344_15893cztM0_level2_quad_clean.evt |
| Size (bytes) | 450,532,800 | 104,794,560 |
| Size | 429.7 MB | 99.9 MB |
| Events in quadrant A | 3,300,442 | 686,539 |
| Events in quadrant B | 3,434,547 | 717,270 |
| Events in quadrant C | 3,381,028 | 674,823 |
| Events in quadrant D | 3,101,789 | 657,048 |
| Mode SS | |||
|---|---|---|---|
| Quadrant | BADHDUFLAG | Total packets | Discarded packets |
| A | 0 | 130 | 0 |
| B | 0 | 130 | 0 |
| C | 0 | 130 | 0 |
| D | 0 | 130 | 0 |
| Mode M0 | |||
|---|---|---|---|
| Quadrant | BADHDUFLAG | Total packets | Discarded packets |
| A | 0 | 13834 | 3 |
| B | 0 | 14200 | 2 |
| C | 0 | 13871 | 2 |
| D | 0 | 13345 | 2 |
| Mode M9 | |||
|---|---|---|---|
| Quadrant | BADHDUFLAG | Total packets | Discarded packets |
| A | 0 | 28 | 0 |
| B | 0 | 28 | 0 |
| C | 0 | 28 | 0 |
| D | 0 | 28 | 0 |
| Quadrant | Total seconds | Saturated seconds | Saturation percentage |
|---|---|---|---|
| A | 6277 | 102 | 1.624980% |
| B | 6277 | 129 | 2.055122% |
| C | 6277 | 116 | 1.848017% |
| D | 6277 | 45 | 0.716903% |
Noise dominated data is calculated using 1-second bins in cleaned event files. If a bin has >2000 counts, and if more than 50% of those come from <1% of pixels, then it is considered to be noise-dominated and hence unusable.
| Quadrant | # 1 sec bins | Bins with >0 counts | Bins with >2000 counts | High rate bins dominated by noise | Noise dominated (total time) | Noise dominated (detector-on time) | Marked lightcurve |
|---|---|---|---|---|---|---|---|
| A | 9023 | 6280 | 6 | 6 | 0.07% | 0.10% | 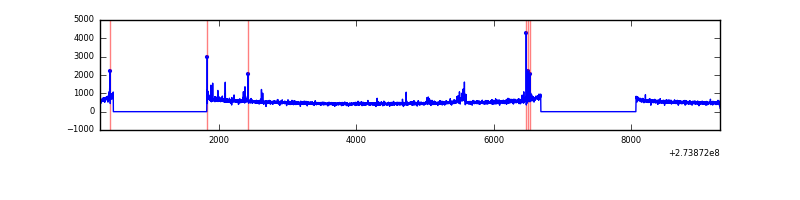 |
| B | 9023 | 6280 | 5 | 5 | 0.06% | 0.08% | 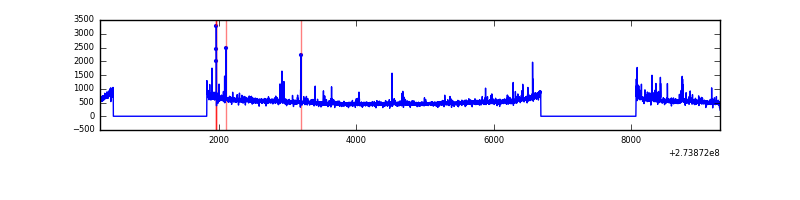 |
| C | 9023 | 6280 | 0 | 0 | 0.00% | 0.00% | 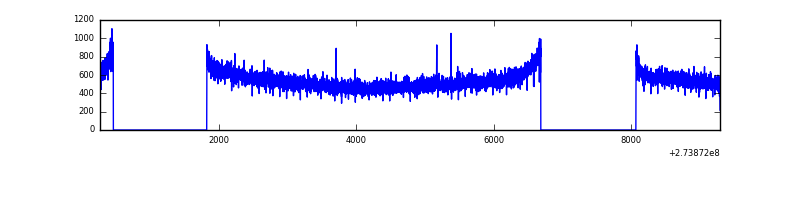 |
| D | 9023 | 6280 | 2 | 2 | 0.02% | 0.03% | 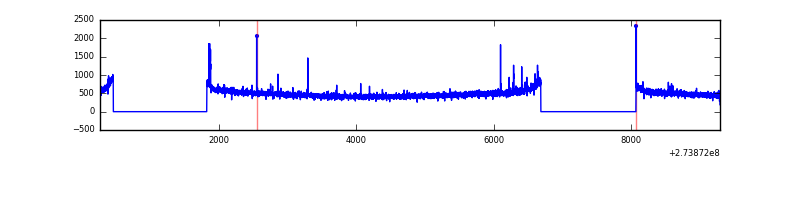 |
Top three noisy pixels from each quadrant. If the there are fewer than three noisy pixels in the level2.evt file, extra rows are filled as -1
| Pixel properties | Quadrant properties | ||||||
|---|---|---|---|---|---|---|---|
| Quadrant | DetID | PixID | Counts | Sigma | Mean | Median | Sigma |
| A | 15 | 239 | 107981 | 638.16 | 829 | 813 | 167.9 |
| A | 0 | 226 | 7308 | 38.68 | 829 | 813 | 167.9 |
| A | 12 | 194 | 6079 | 31.36 | 829 | 813 | 167.9 |
| B | 4 | 173 | 39910 | 247.13 | 841 | 822 | 158.2 |
| B | 0 | 189 | 29241 | 179.68 | 841 | 822 | 158.2 |
| B | 0 | 230 | 21478 | 130.6 | 841 | 822 | 158.2 |
| C | 14 | 238 | 124975 | 660.15 | 805 | 813 | 188.1 |
| C | 3 | 233 | 105869 | 558.57 | 805 | 813 | 188.1 |
| C | 0 | 207 | 7113 | 33.5 | 805 | 813 | 188.1 |
| D | 2 | 234 | 27595 | 135.88 | 810 | 786 | 197.3 |
| D | 13 | 172 | 16926 | 81.8 | 810 | 786 | 197.3 |
| D | 2 | 120 | 12882 | 61.31 | 810 | 786 | 197.3 |
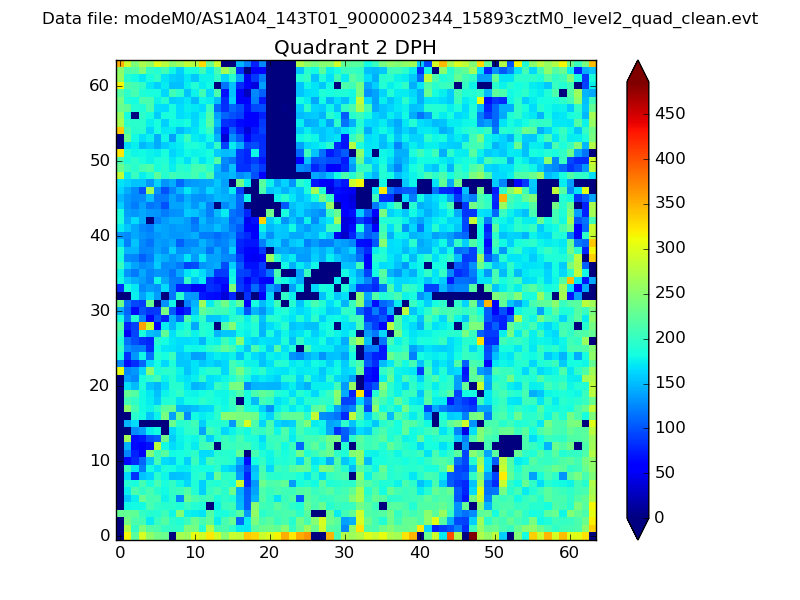
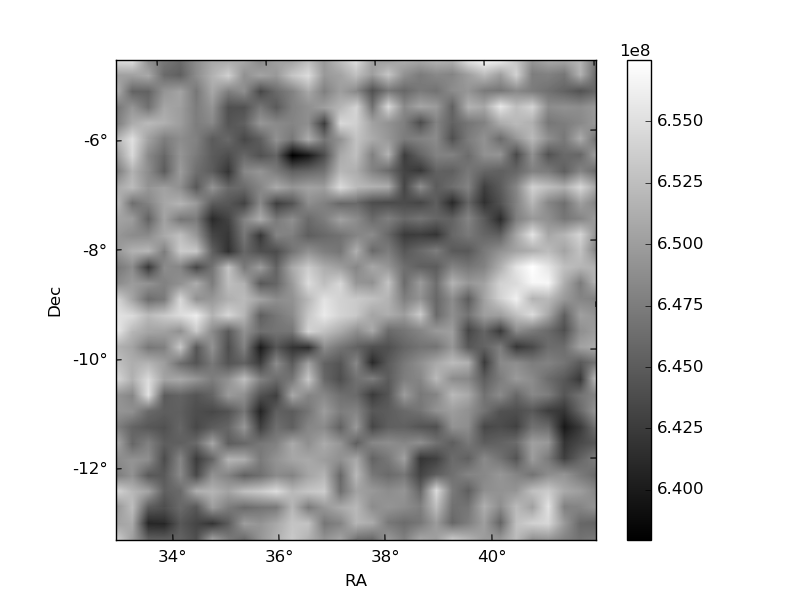
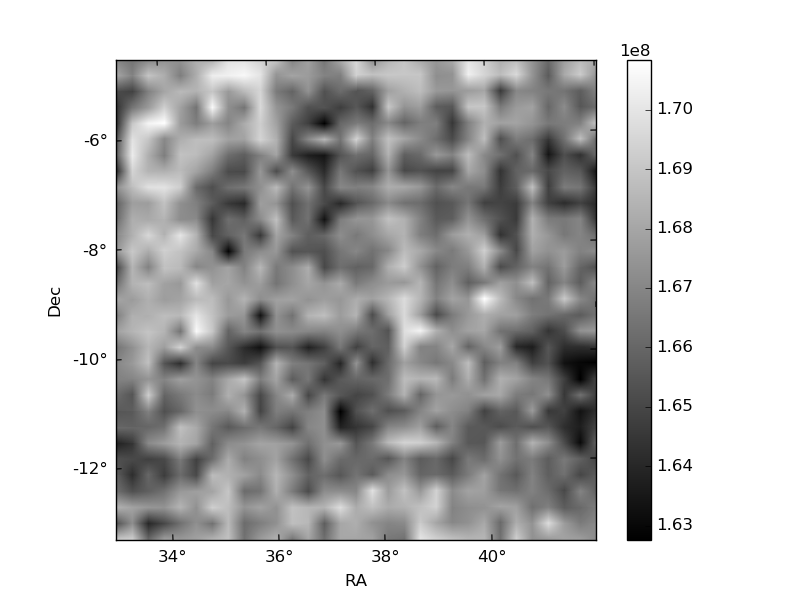
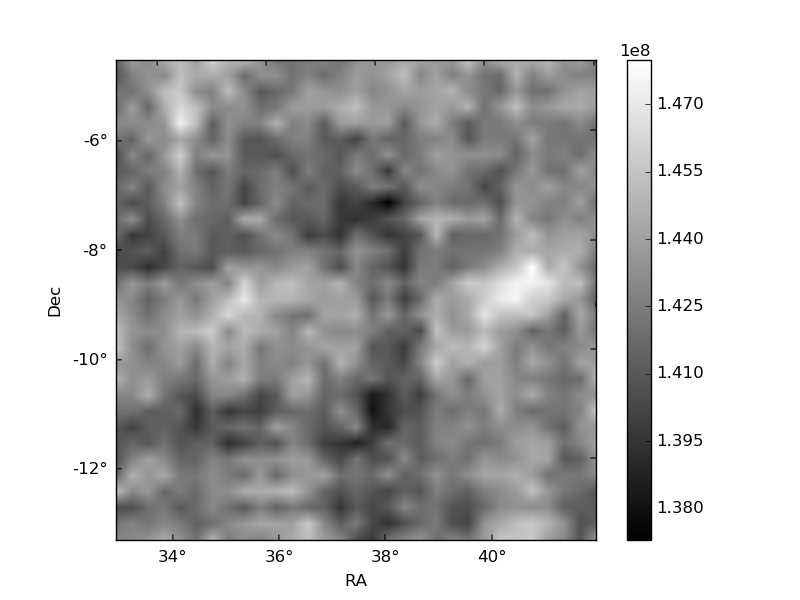
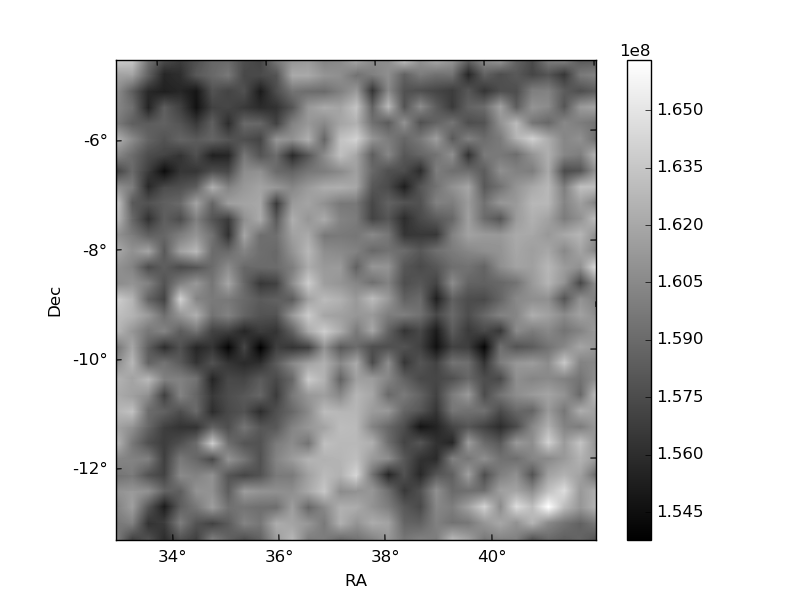
Histogram calculated using DETX and DETY for each event in the final _common_clean file
| Quadrant A | 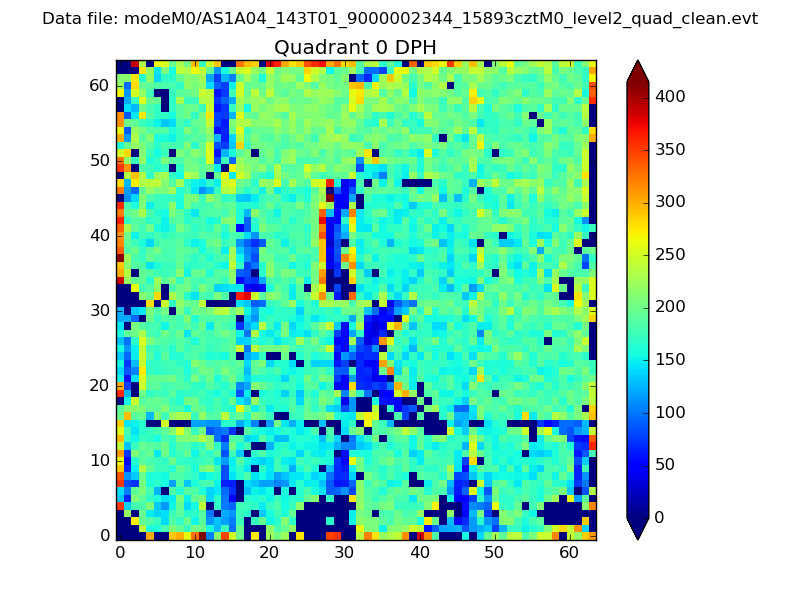 |
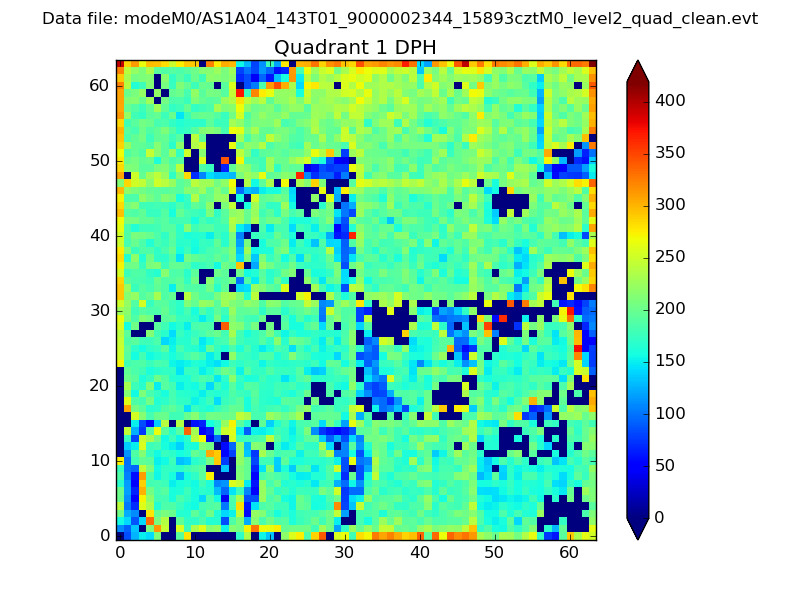 |
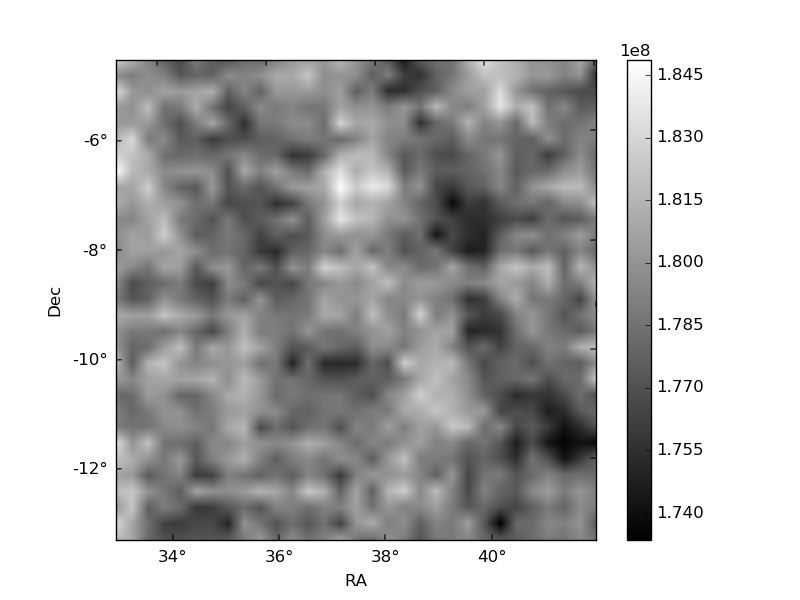
Quadrant B |
|---|---|---|---|
| Quadrant D | 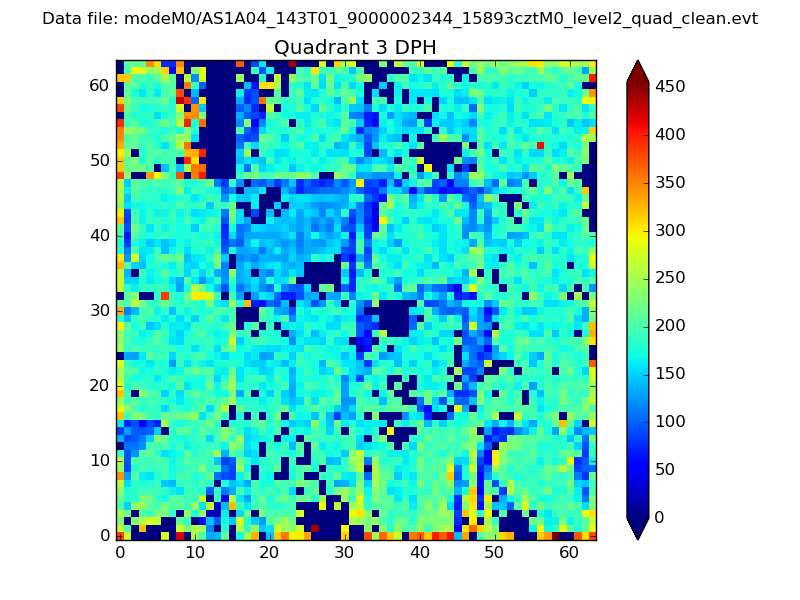 |
 |
Quadrant C |
| Plot type | Count rate plots | Images |
|---|---|---|
| Comparison with Poisson distribution Blue bars denote a histogram of data divided into 1 sec bins. Red curve is a Poisson curve with rate = median count rate of data. |
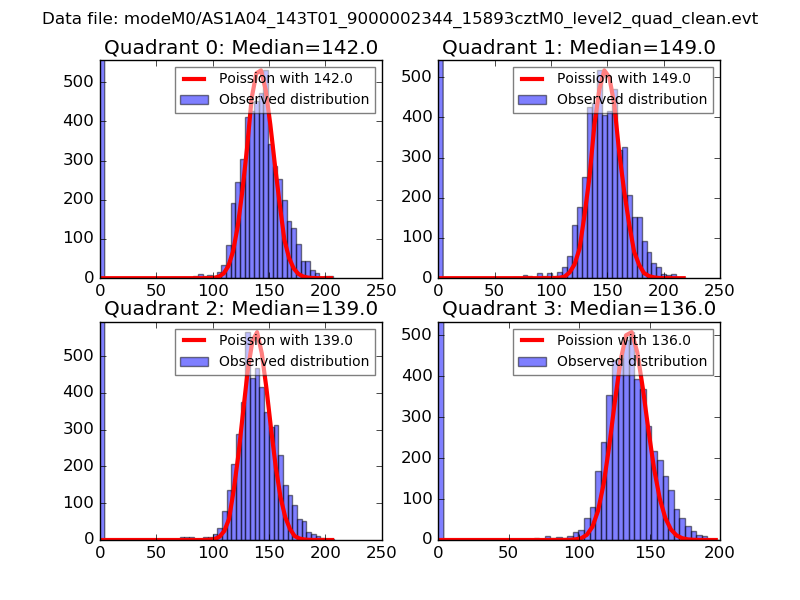 |
 |
| Quadrant-wise count rates Data is divided into 100 sec bins |
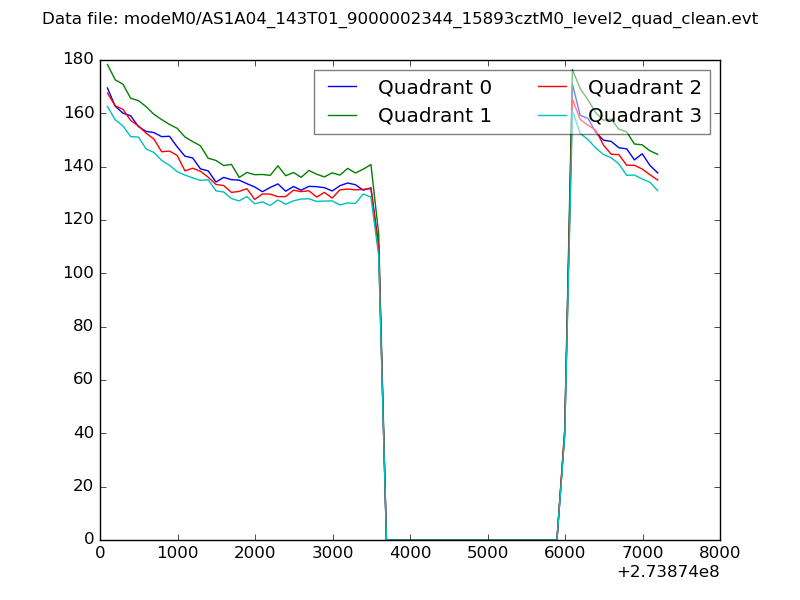 |
|
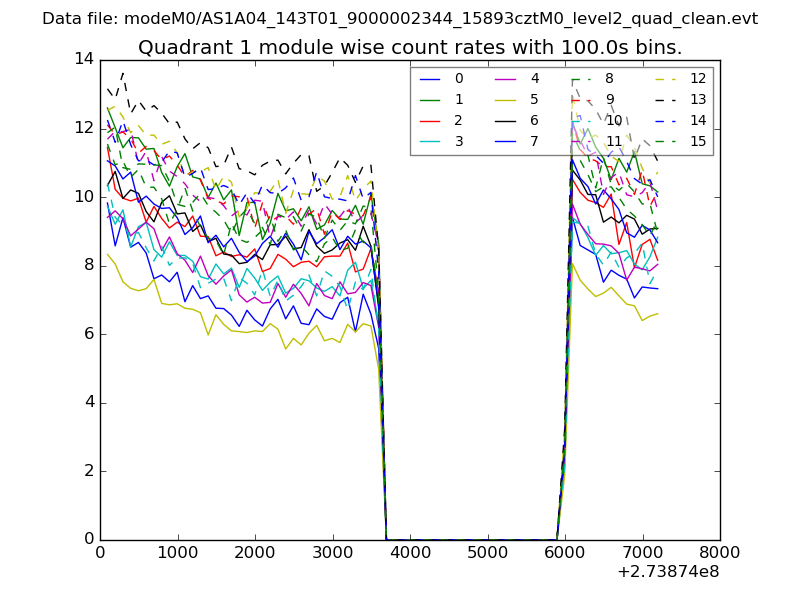
| Module-wise count rates for Quadrant A Data is divided into 100 sec bins |
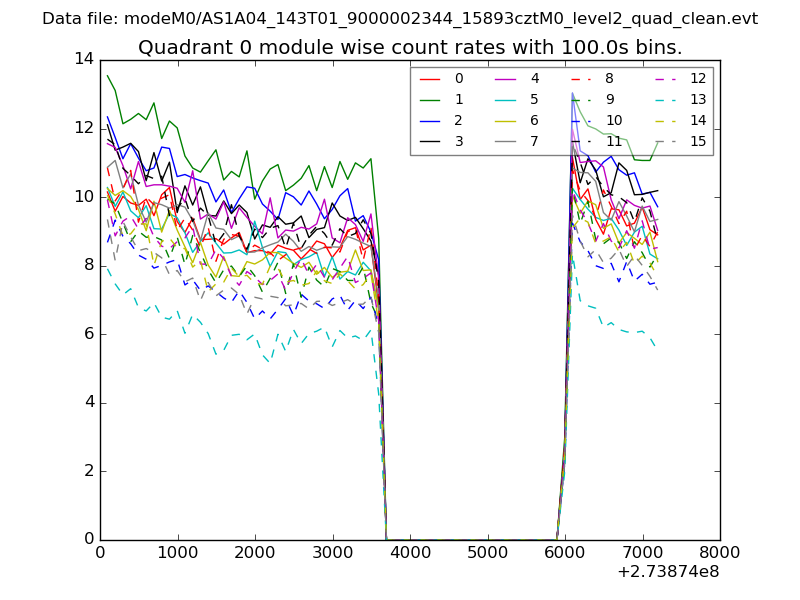 |
 |
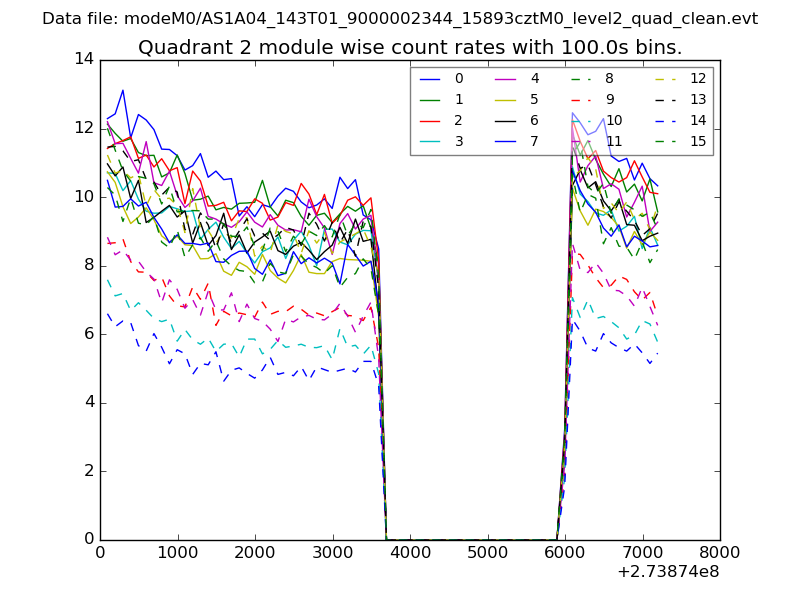
| Module-wise count rates for Quadrant B Data is divided into 100 sec bins |
 |
 |
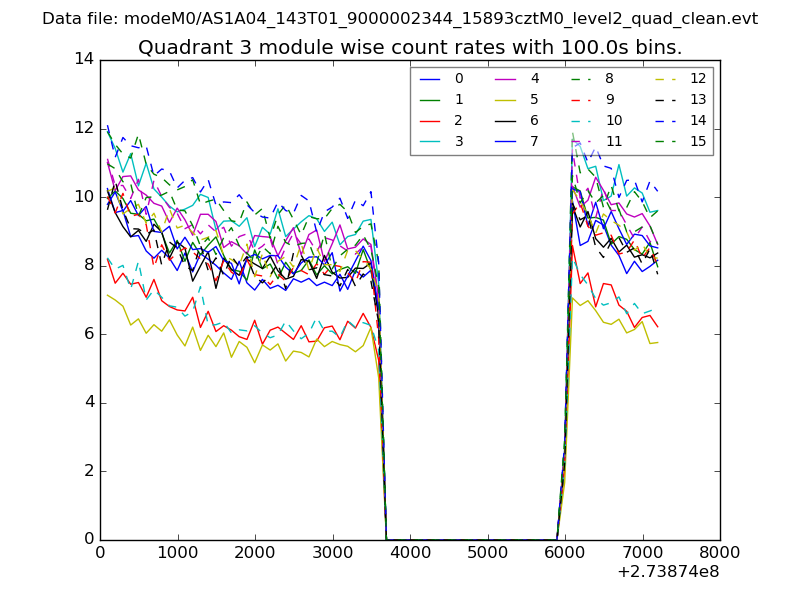
| Module-wise count rates for Quadrant C Data is divided into 100 sec bins |
 |
 |
| Module-wise count rates for Quadrant D Data is divided into 100 sec bins |
 |
 |
| Parameter | Plot |
|---|---|
| CZT HV Monitor | 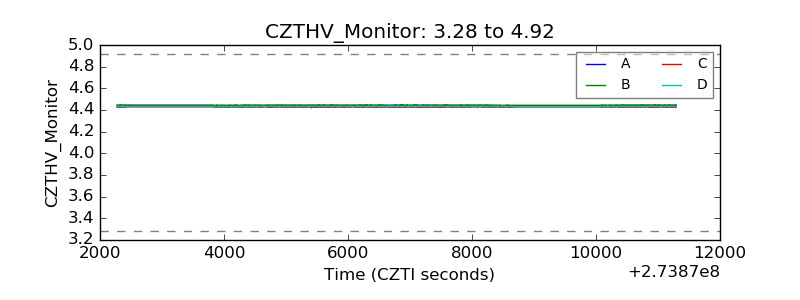 |
| D_VDD | 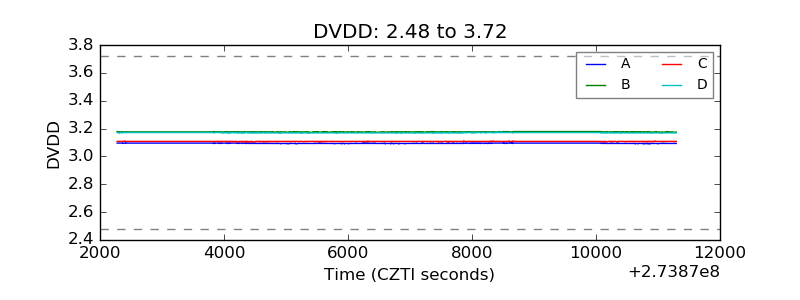 |
| Temperature 1 | 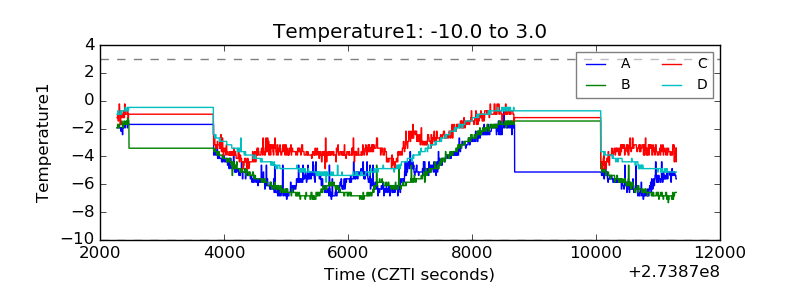 |
| Veto HV Monitor | 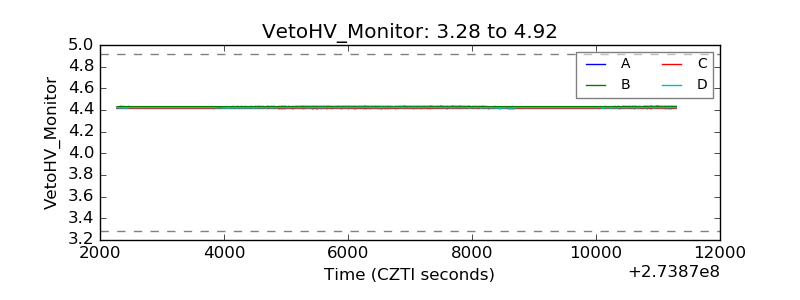 |
| Veto LLD | 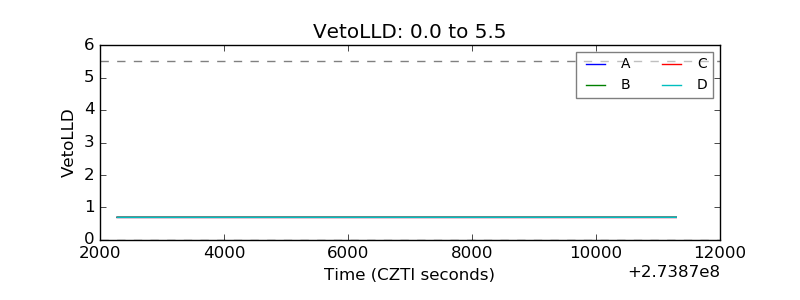 |
| Alpha Counter | 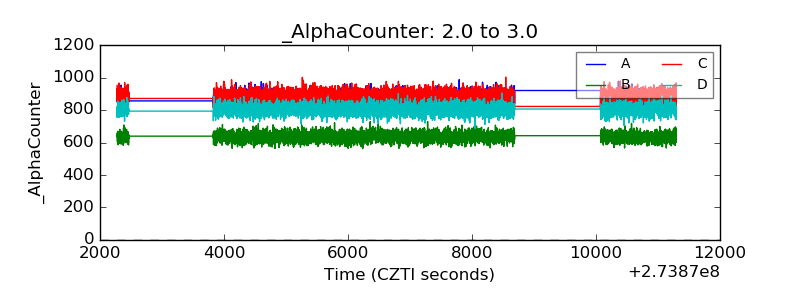 |
| _CPM_Rate | 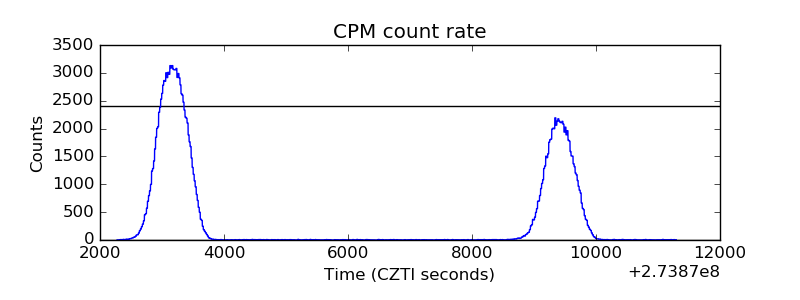 |
| CZT Counter | 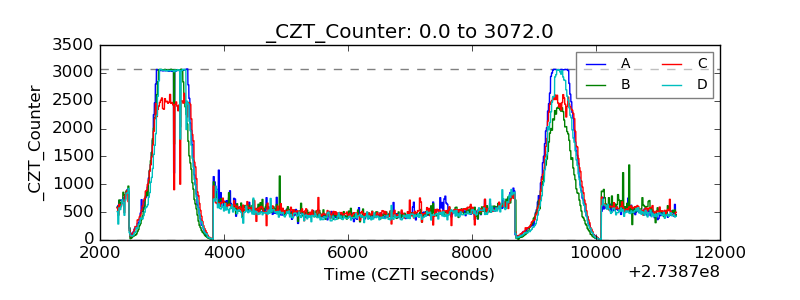 |
| +2.5 Volts monitor | 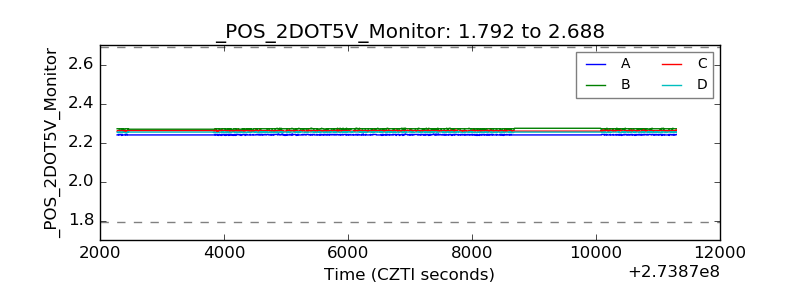 |
| +5 Volts monitor |  |
| _ROLL_ROT | 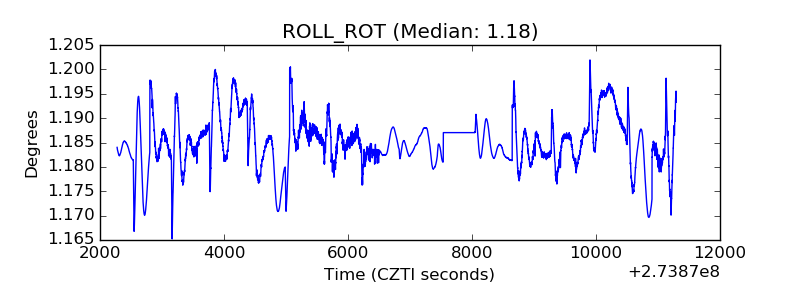 |
| _Roll_DEC | 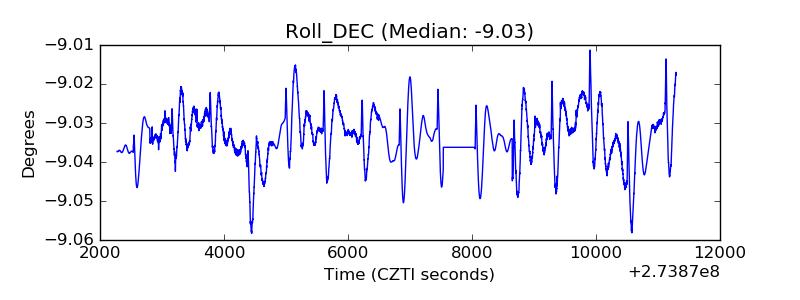 |
| _Roll_RA | 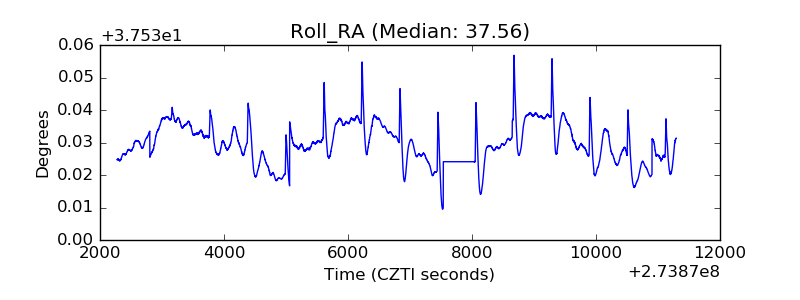 |
| Veto Counter | 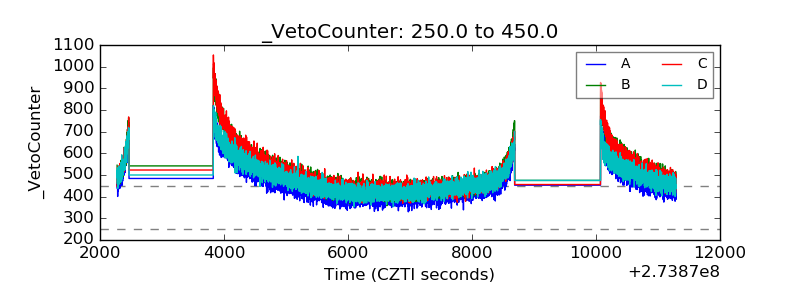 |