| Param | Original file | Final file |
|---|---|---|
| Filename | modeM0/AS1A04_143T01_9000002344_15894cztM0_level2.evt | modeM0/AS1A04_143T01_9000002344_15894cztM0_level2_quad_clean.evt |
| Size (bytes) | 487,005,120 | 99,843,840 |
| Size | 464.4 MB | 95.2 MB |
| Events in quadrant A | 3,686,959 | 639,310 |
| Events in quadrant B | 3,666,009 | 665,518 |
| Events in quadrant C | 3,581,331 | 628,690 |
| Events in quadrant D | 3,349,523 | 613,242 |
| Mode SS | |||
|---|---|---|---|
| Quadrant | BADHDUFLAG | Total packets | Discarded packets |
| A | 0 | 142 | 0 |
| B | 0 | 142 | 0 |
| C | 0 | 142 | 0 |
| D | 0 | 142 | 0 |
| Mode M0 | |||
|---|---|---|---|
| Quadrant | BADHDUFLAG | Total packets | Discarded packets |
| A | 0 | 15386 | 3 |
| B | 0 | 15237 | 2 |
| C | 0 | 14872 | 2 |
| D | 0 | 14600 | 2 |
| Mode M9 | |||
|---|---|---|---|
| Quadrant | BADHDUFLAG | Total packets | Discarded packets |
| A | 0 | 26 | 0 |
| B | 0 | 26 | 0 |
| C | 0 | 26 | 0 |
| D | 0 | 26 | 0 |
| Quadrant | Total seconds | Saturated seconds | Saturation percentage |
|---|---|---|---|
| A | 6843 | 204 | 2.981149% |
| B | 6843 | 139 | 2.031273% |
| C | 6843 | 117 | 1.709776% |
| D | 6843 | 33 | 0.482245% |
Noise dominated data is calculated using 1-second bins in cleaned event files. If a bin has >2000 counts, and if more than 50% of those come from <1% of pixels, then it is considered to be noise-dominated and hence unusable.
| Quadrant | # 1 sec bins | Bins with >0 counts | Bins with >2000 counts | High rate bins dominated by noise | Noise dominated (total time) | Noise dominated (detector-on time) | Marked lightcurve |
|---|---|---|---|---|---|---|---|
| A | 9464 | 6846 | 56 | 56 | 0.59% | 0.82% | 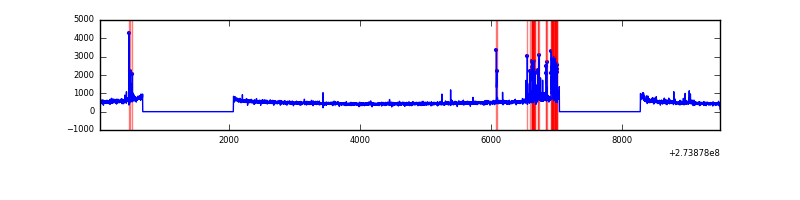 |
| B | 9464 | 6846 | 1 | 1 | 0.01% | 0.01% | 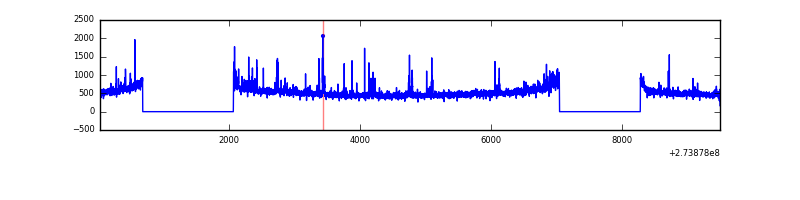 |
| C | 9464 | 6846 | 0 | 0 | 0.00% | 0.00% | 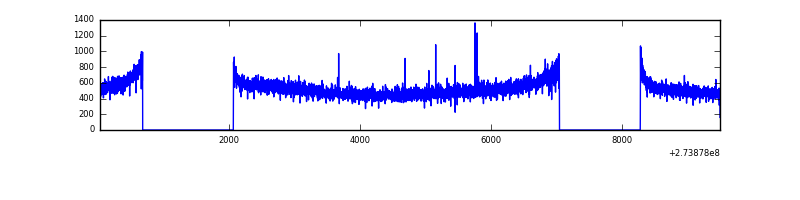 |
| D | 9464 | 6846 | 5 | 5 | 0.05% | 0.07% | 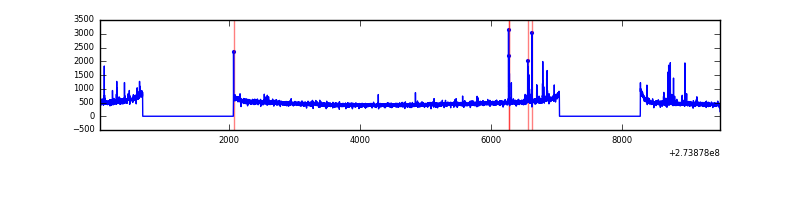 |
Top three noisy pixels from each quadrant. If the there are fewer than three noisy pixels in the level2.evt file, extra rows are filled as -1
| Pixel properties | Quadrant properties | ||||||
|---|---|---|---|---|---|---|---|
| Quadrant | DetID | PixID | Counts | Sigma | Mean | Median | Sigma |
| A | 15 | 239 | 290837 | 1640.36 | 876 | 859 | 176.8 |
| A | 13 | 248 | 10235 | 53.04 | 876 | 859 | 176.8 |
| A | 15 | 157 | 9274 | 47.6 | 876 | 859 | 176.8 |
| B | 4 | 173 | 70760 | 411.96 | 894 | 872 | 169.6 |
| B | 5 | 236 | 36978 | 212.83 | 894 | 872 | 169.6 |
| B | 0 | 189 | 27142 | 154.85 | 894 | 872 | 169.6 |
| C | 14 | 238 | 130914 | 648.83 | 856 | 863 | 200.4 |
| C | 3 | 233 | 95630 | 472.79 | 856 | 863 | 200.4 |
| C | 0 | 207 | 6516 | 28.2 | 856 | 863 | 200.4 |
| D | 12 | 218 | 53132 | 248.45 | 862 | 838 | 210.5 |
| D | 2 | 234 | 29206 | 134.78 | 862 | 838 | 210.5 |
| D | 9 | 68 | 17810 | 80.63 | 862 | 838 | 210.5 |
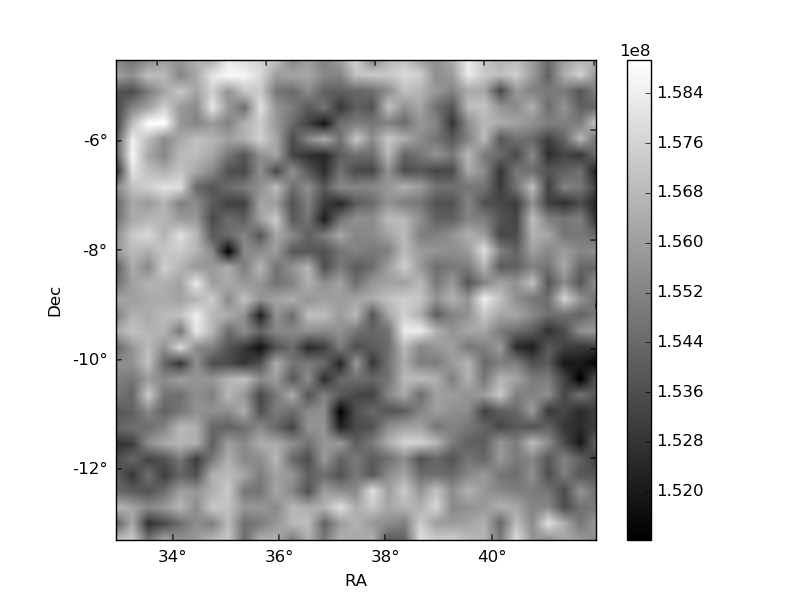
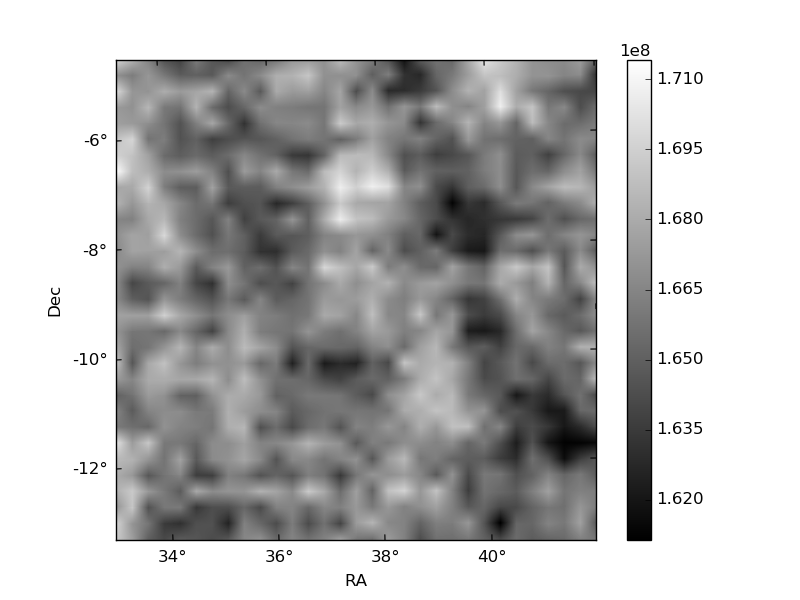
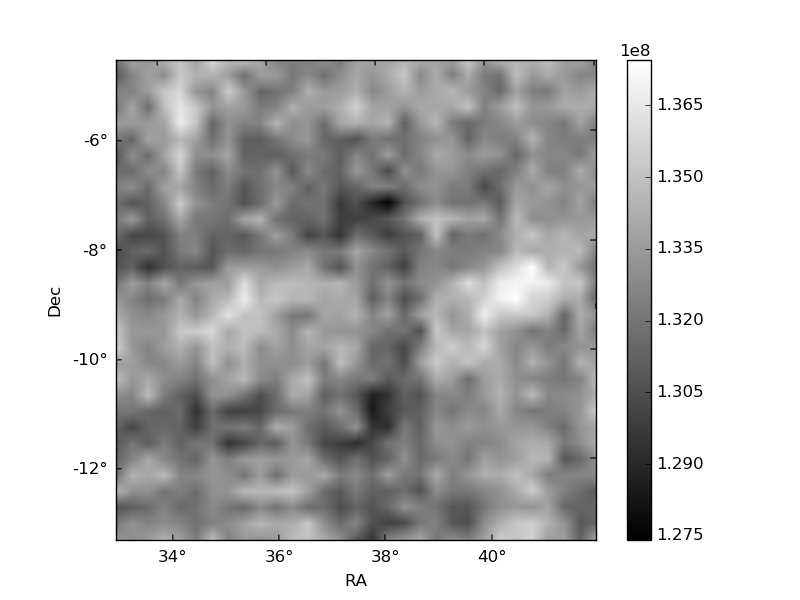
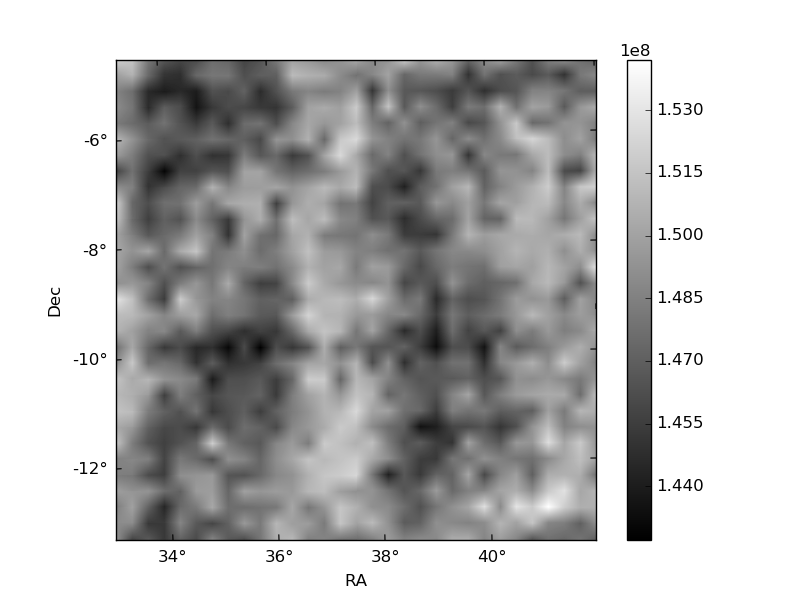
Histogram calculated using DETX and DETY for each event in the final _common_clean file
| Quadrant A | 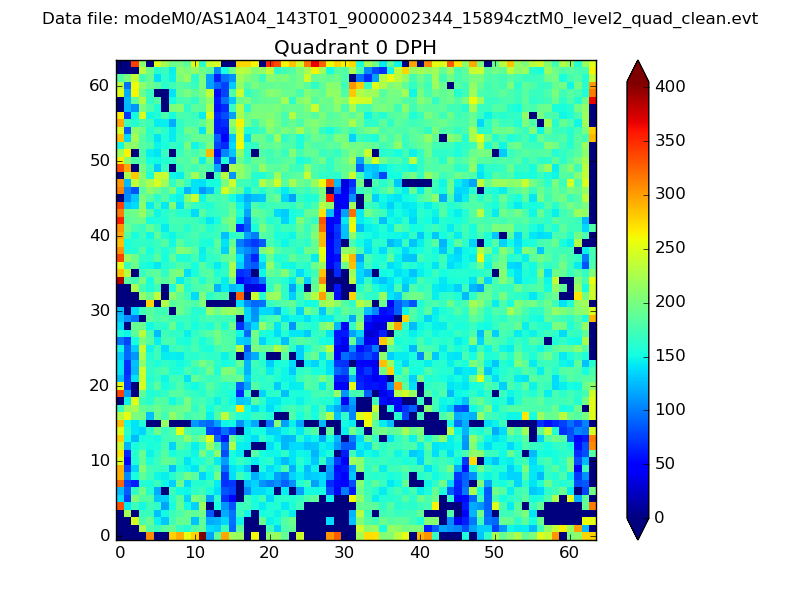 |
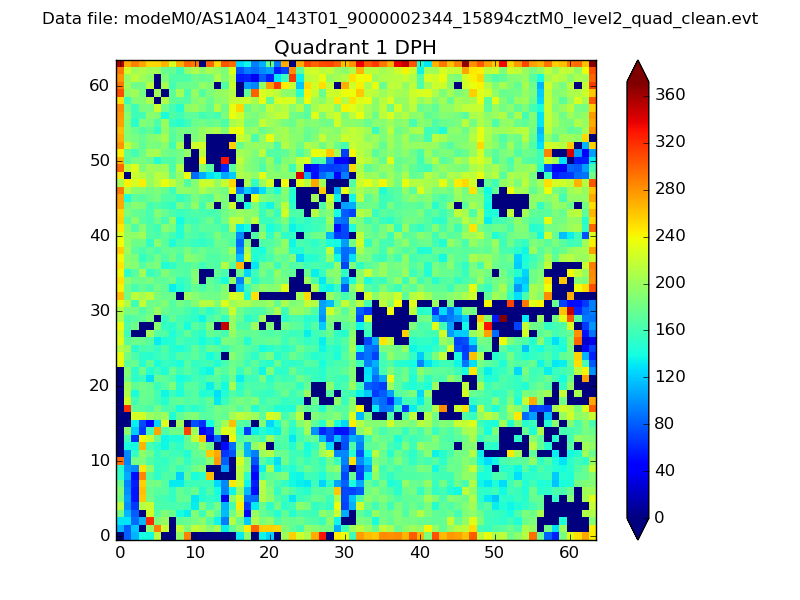 |
Quadrant B |
|---|---|---|---|
| Quadrant D | 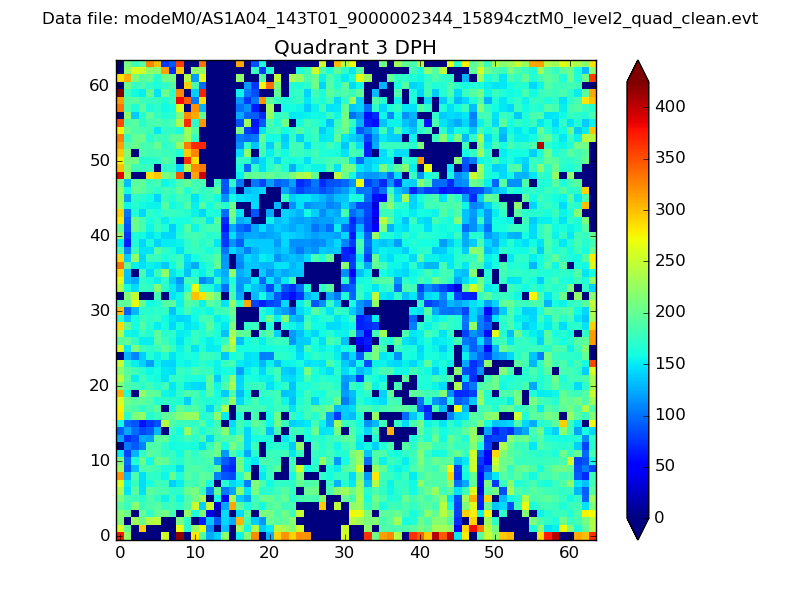 |
 |
Quadrant C |
| Plot type | Count rate plots | Images |
|---|---|---|
| Comparison with Poisson distribution Blue bars denote a histogram of data divided into 1 sec bins. Red curve is a Poisson curve with rate = median count rate of data. |
 |
 |
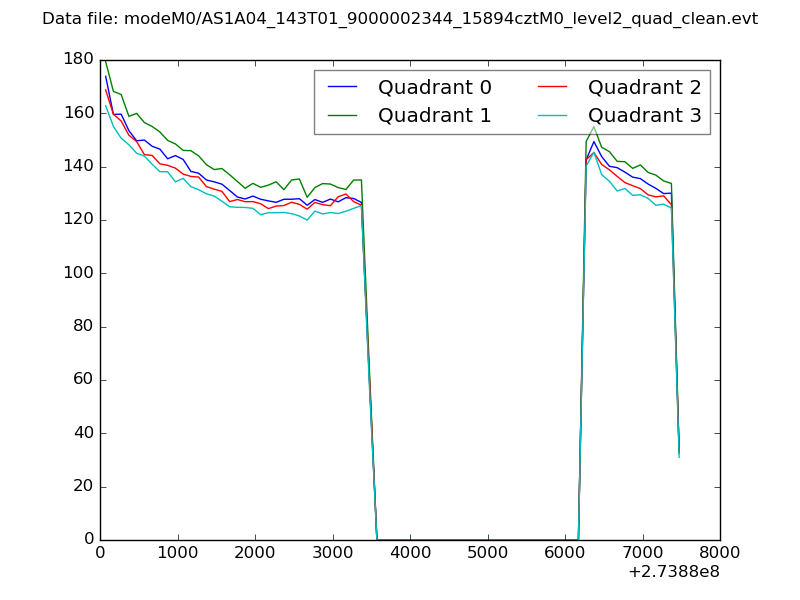
| Quadrant-wise count rates Data is divided into 100 sec bins |
 |
|
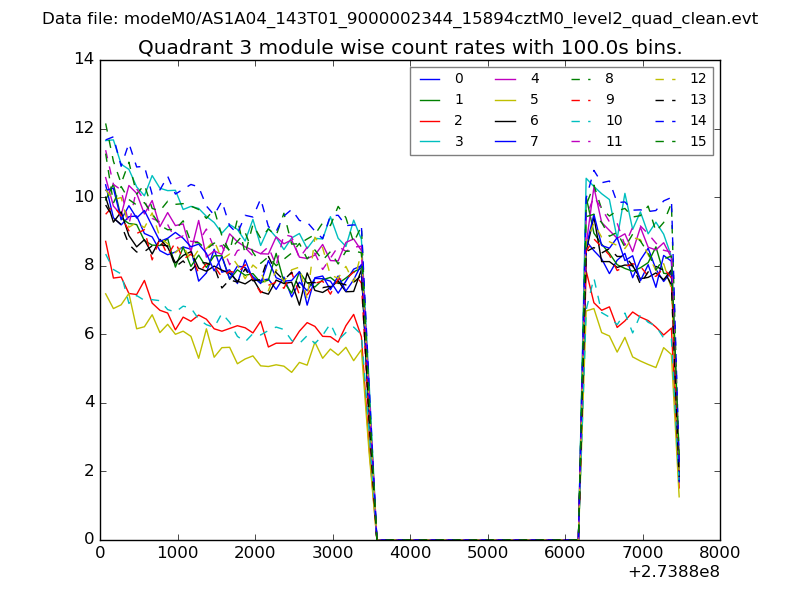
| Module-wise count rates for Quadrant A Data is divided into 100 sec bins |
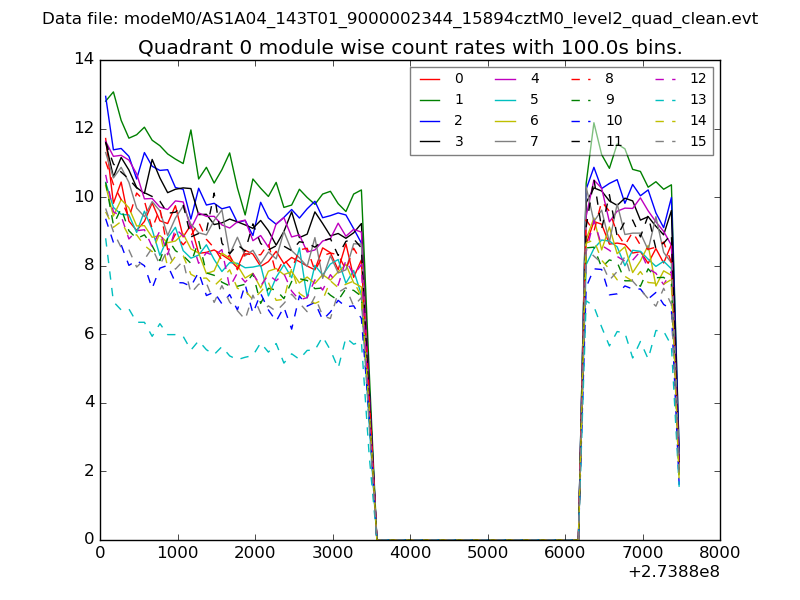 |
 |
| Module-wise count rates for Quadrant B Data is divided into 100 sec bins |
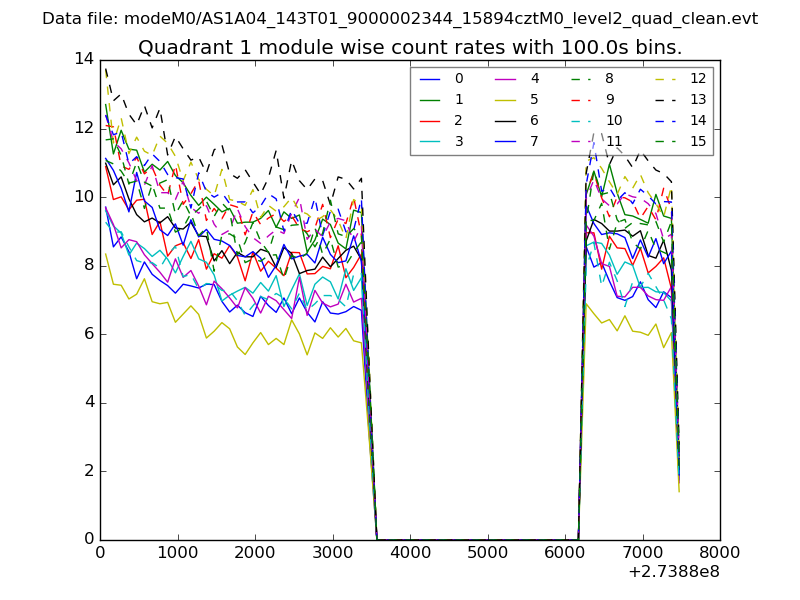 |
 |
| Module-wise count rates for Quadrant C Data is divided into 100 sec bins |
 |
 |
| Module-wise count rates for Quadrant D Data is divided into 100 sec bins |
 |
 |
| Parameter | Plot |
|---|---|
| CZT HV Monitor | 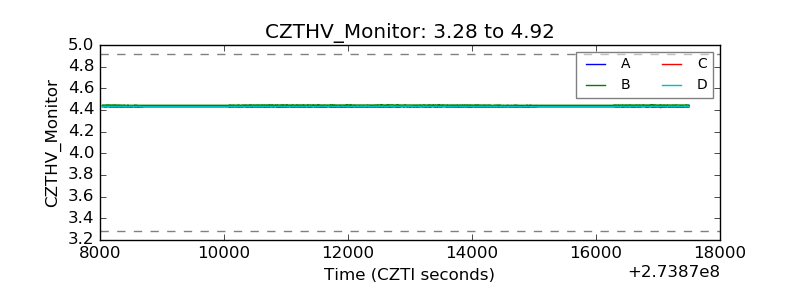 |
| D_VDD | 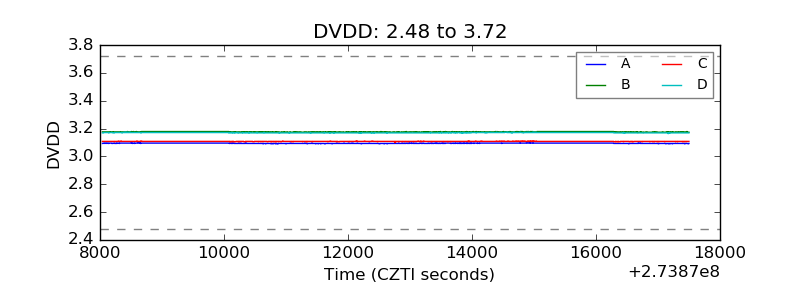 |
| Temperature 1 |  |
| Veto HV Monitor | 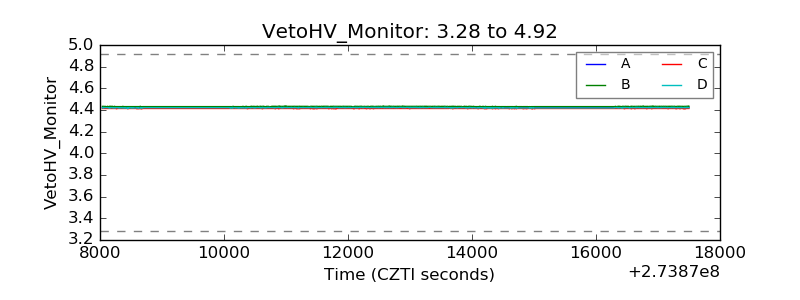 |
| Veto LLD | 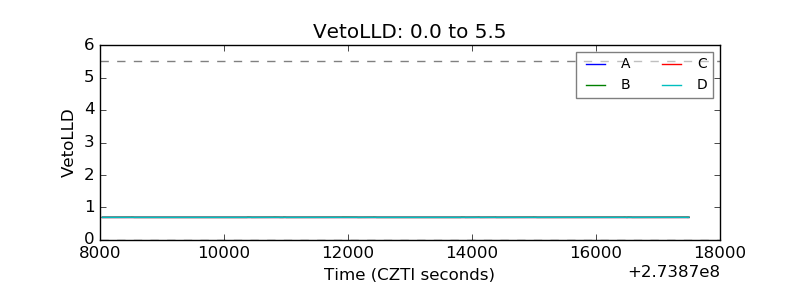 |
| Alpha Counter |  |
| _CPM_Rate | 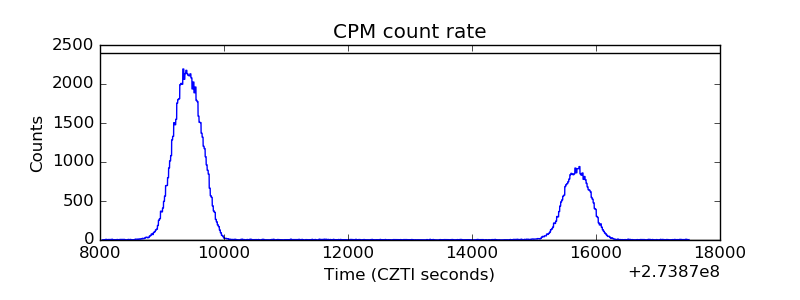 |
| CZT Counter |  |
| +2.5 Volts monitor |  |
| +5 Volts monitor |  |
| _ROLL_ROT | 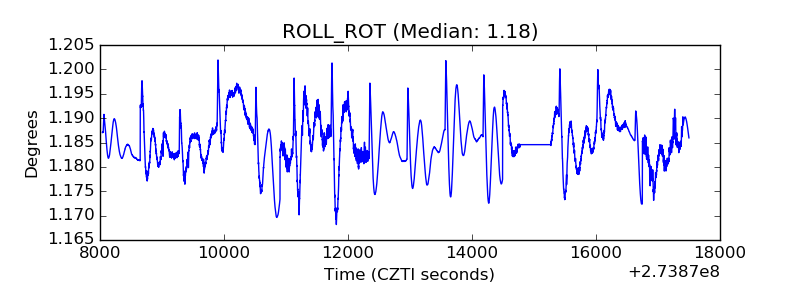 |
| _Roll_DEC | 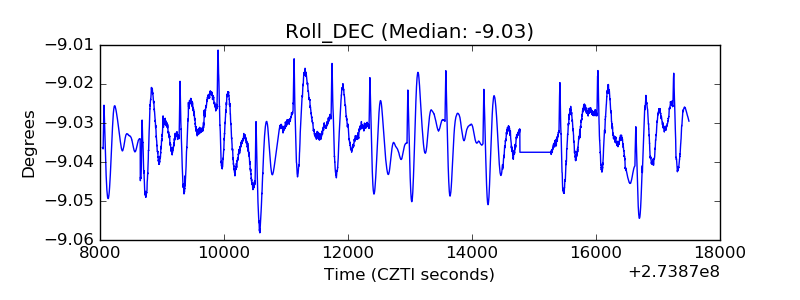 |
| _Roll_RA |  |
| Veto Counter | 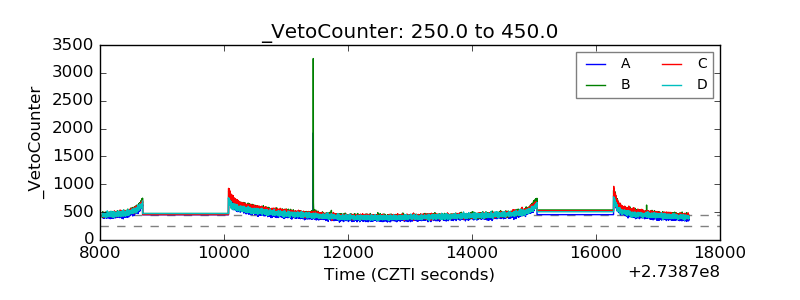 |