| Param | Original file | Final file |
|---|---|---|
| Filename | modeM0/AS1A04_143T01_9000002344_15895cztM0_level2.evt | modeM0/AS1A04_143T01_9000002344_15895cztM0_level2_quad_clean.evt |
| Size (bytes) | 474,445,440 | 91,454,400 |
| Size | 452.5 MB | 87.2 MB |
| Events in quadrant A | 3,799,098 | 579,734 |
| Events in quadrant B | 3,349,279 | 599,239 |
| Events in quadrant C | 3,379,291 | 568,672 |
| Events in quadrant D | 3,386,161 | 555,295 |
| Mode SS | |||
|---|---|---|---|
| Quadrant | BADHDUFLAG | Total packets | Discarded packets |
| A | 0 | 136 | 0 |
| B | 0 | 136 | 0 |
| C | 0 | 136 | 0 |
| D | 0 | 136 | 0 |
| Mode M0 | |||
|---|---|---|---|
| Quadrant | BADHDUFLAG | Total packets | Discarded packets |
| A | 0 | 15794 | 3 |
| B | 0 | 14258 | 2 |
| C | 0 | 14304 | 2 |
| D | 0 | 14658 | 2 |
| Mode M9 | |||
|---|---|---|---|
| Quadrant | BADHDUFLAG | Total packets | Discarded packets |
| A | 0 | 19 | 0 |
| B | 0 | 19 | 0 |
| C | 0 | 19 | 0 |
| D | 0 | 20 | 0 |
| Quadrant | Total seconds | Saturated seconds | Saturation percentage |
|---|---|---|---|
| A | 6693 | 228 | 3.406544% |
| B | 6693 | 61 | 0.911400% |
| C | 6693 | 63 | 0.941282% |
| D | 6693 | 60 | 0.896459% |
Noise dominated data is calculated using 1-second bins in cleaned event files. If a bin has >2000 counts, and if more than 50% of those come from <1% of pixels, then it is considered to be noise-dominated and hence unusable.
| Quadrant | # 1 sec bins | Bins with >0 counts | Bins with >2000 counts | High rate bins dominated by noise | Noise dominated (total time) | Noise dominated (detector-on time) | Marked lightcurve |
|---|---|---|---|---|---|---|---|
| A | 7624 | 6695 | 139 | 139 | 1.82% | 2.08% | 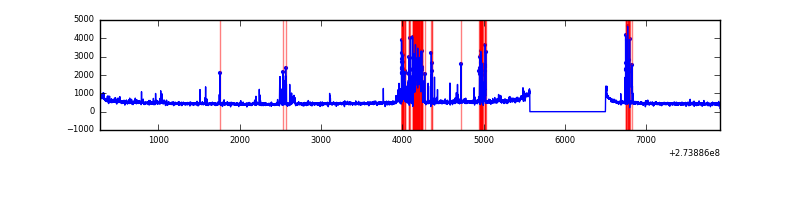 |
| B | 7624 | 6695 | 4 | 4 | 0.05% | 0.06% | 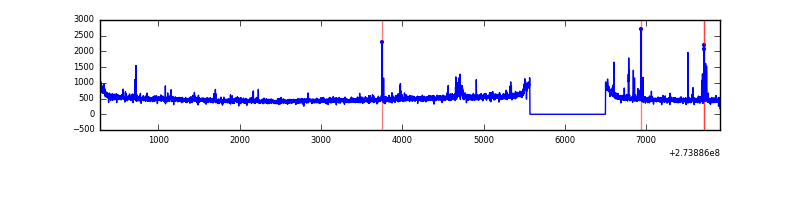 |
| C | 7624 | 6695 | 0 | 0 | 0.00% | 0.00% | 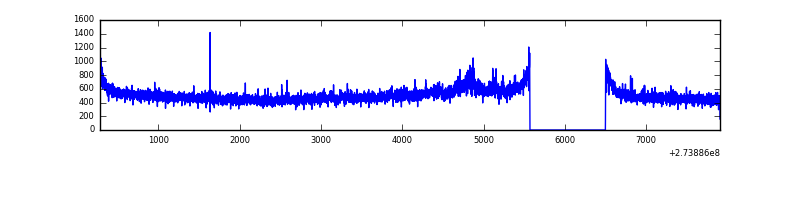 |
| D | 7624 | 6695 | 25 | 25 | 0.33% | 0.37% | 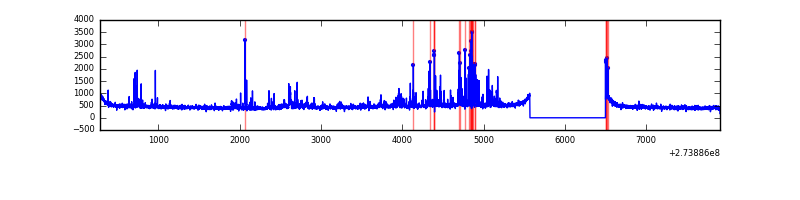 |
Top three noisy pixels from each quadrant. If the there are fewer than three noisy pixels in the level2.evt file, extra rows are filled as -1
| Pixel properties | Quadrant properties | ||||||
|---|---|---|---|---|---|---|---|
| Quadrant | DetID | PixID | Counts | Sigma | Mean | Median | Sigma |
| A | 15 | 239 | 641623 | 3928.11 | 812 | 797 | 163.1 |
| A | 9 | 143 | 11929 | 68.24 | 812 | 797 | 163.1 |
| A | 7 | 16 | 11415 | 65.09 | 812 | 797 | 163.1 |
| B | 4 | 173 | 32923 | 202.88 | 829 | 808 | 158.3 |
| B | 0 | 229 | 22495 | 137.0 | 829 | 808 | 158.3 |
| B | 0 | 190 | 20081 | 121.75 | 829 | 808 | 158.3 |
| C | 14 | 238 | 121726 | 645.48 | 796 | 802 | 187.3 |
| C | 3 | 233 | 86217 | 455.94 | 796 | 802 | 187.3 |
| C | 7 | 247 | 67186 | 354.35 | 796 | 802 | 187.3 |
| D | 12 | 218 | 284009 | 1437.99 | 801 | 779 | 197.0 |
| D | 2 | 120 | 57122 | 286.06 | 801 | 779 | 197.0 |
| D | 2 | 234 | 28562 | 141.06 | 801 | 779 | 197.0 |
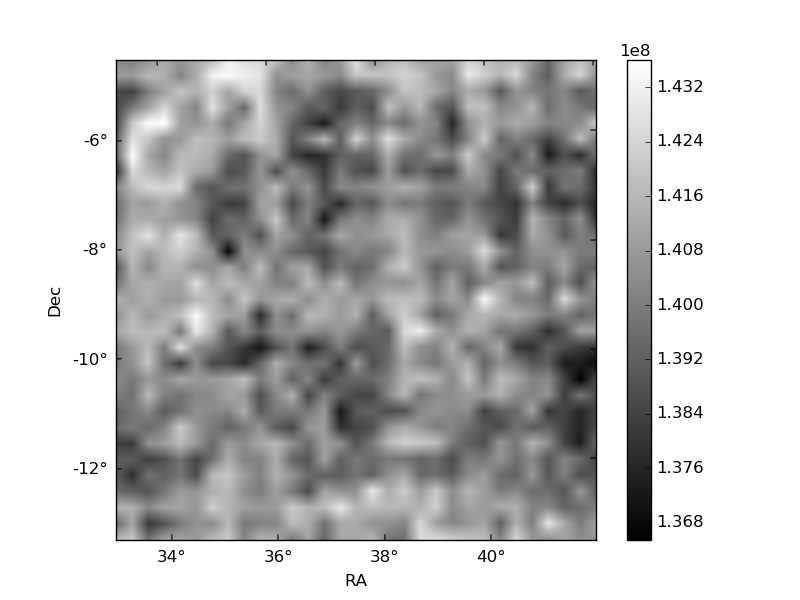
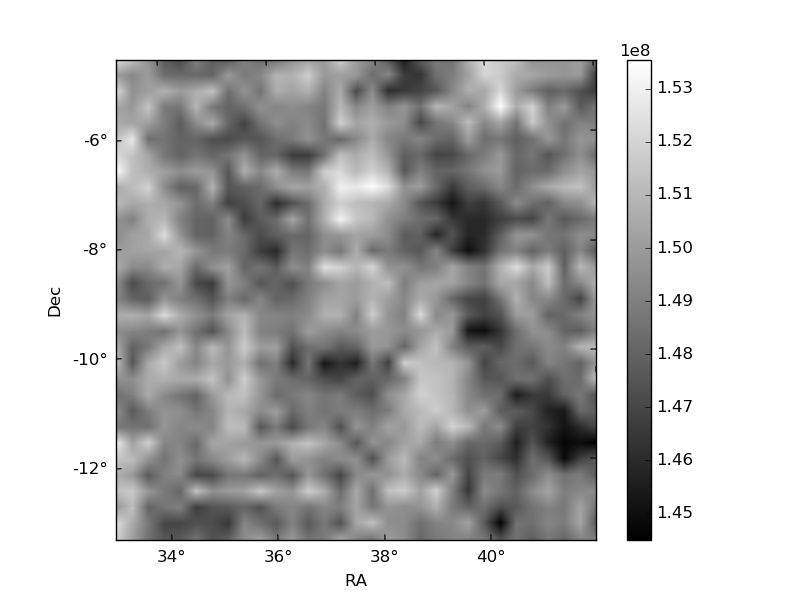
Histogram calculated using DETX and DETY for each event in the final _common_clean file
| Quadrant A |  |
 |
Quadrant B |
|---|---|---|---|
| Quadrant D |  |
 |
Quadrant C |
| Plot type | Count rate plots | Images |
|---|---|---|
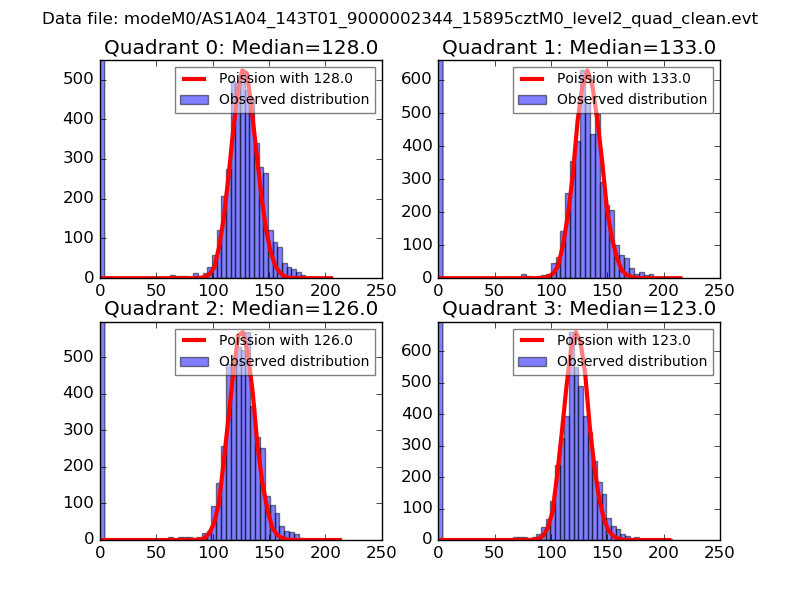
| Comparison with Poisson distribution Blue bars denote a histogram of data divided into 1 sec bins. Red curve is a Poisson curve with rate = median count rate of data. |
 |
 |
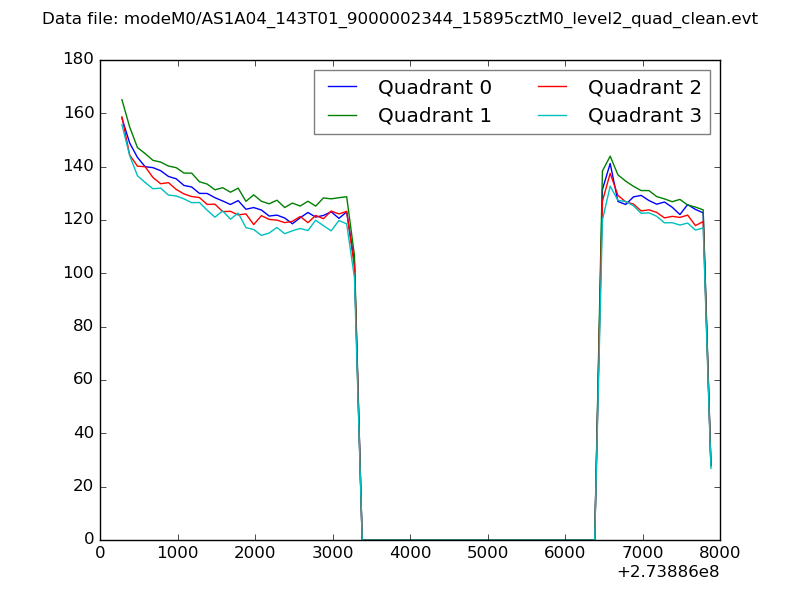
| Quadrant-wise count rates Data is divided into 100 sec bins |
 |
|
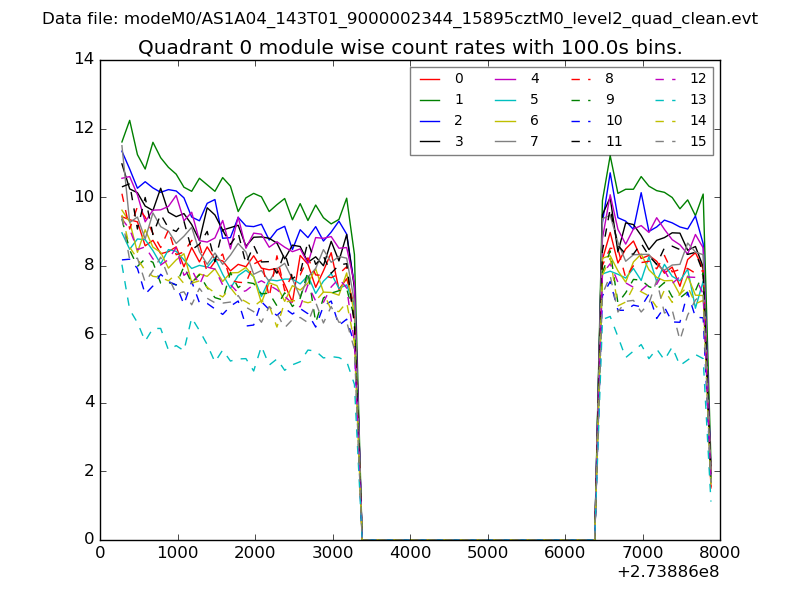
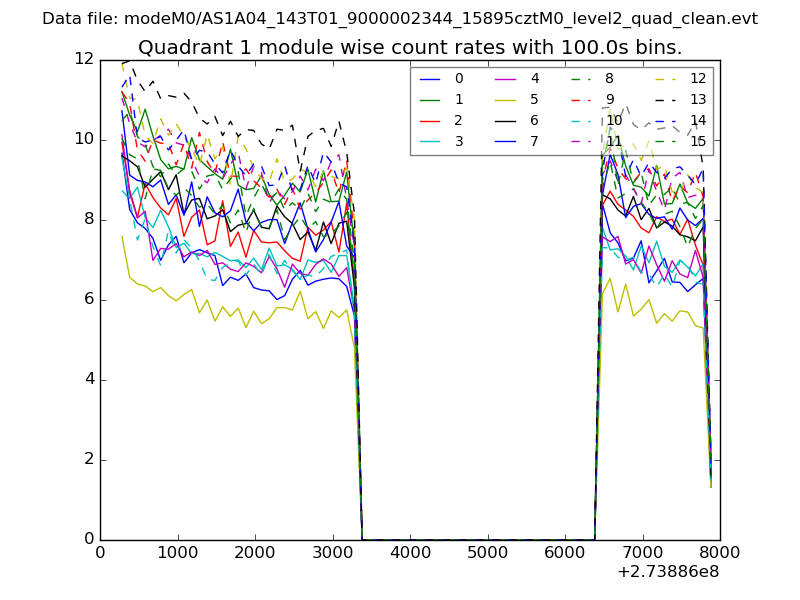
| Module-wise count rates for Quadrant A Data is divided into 100 sec bins |
 |
 |
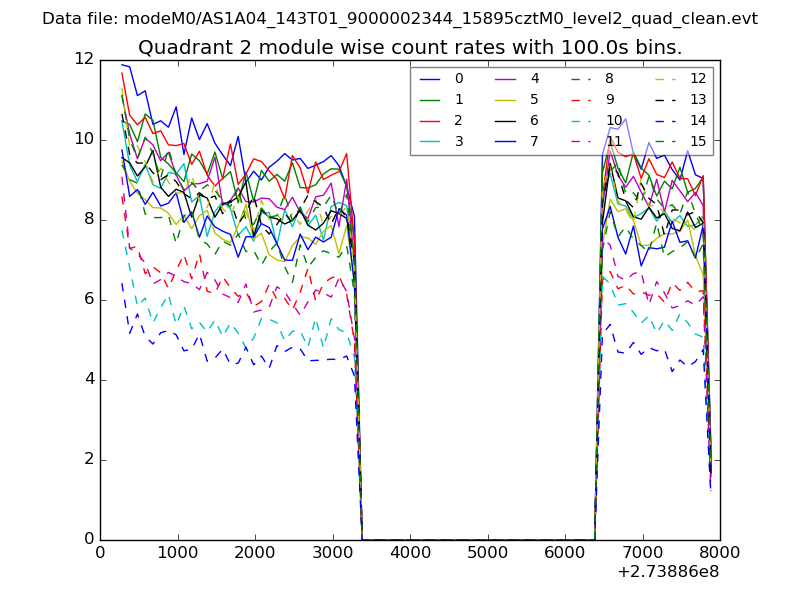
| Module-wise count rates for Quadrant B Data is divided into 100 sec bins |
 |
 |
| Module-wise count rates for Quadrant C Data is divided into 100 sec bins |
 |
 |
| Module-wise count rates for Quadrant D Data is divided into 100 sec bins |
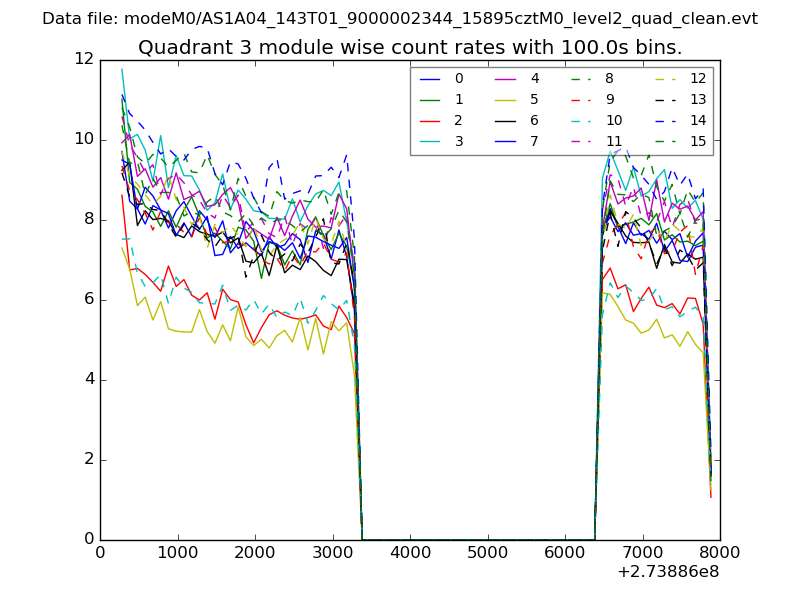 |
 |
| Parameter | Plot |
|---|---|
| CZT HV Monitor | 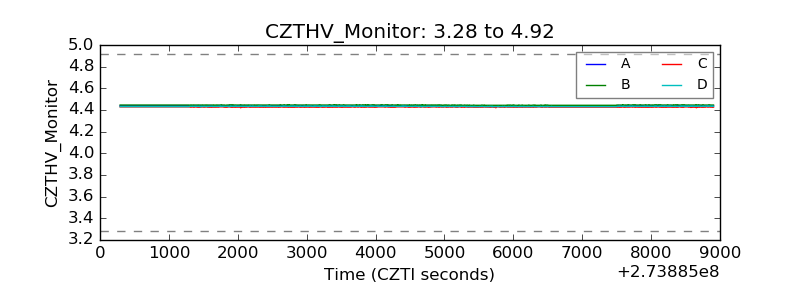 |
| D_VDD | 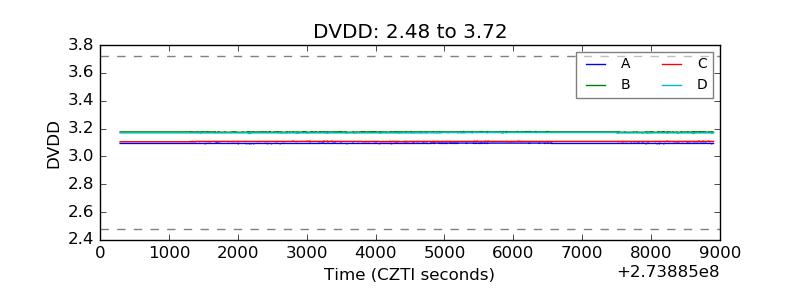 |
| Temperature 1 | 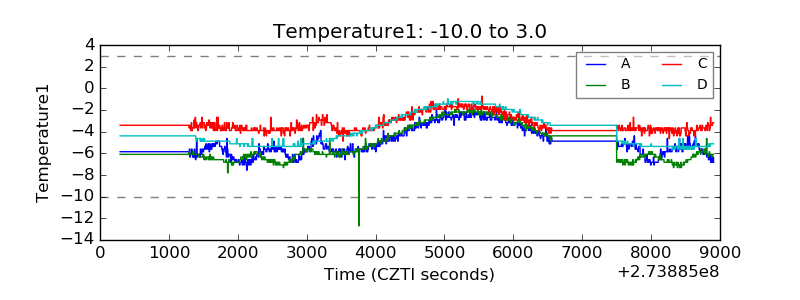 |
| Veto HV Monitor | 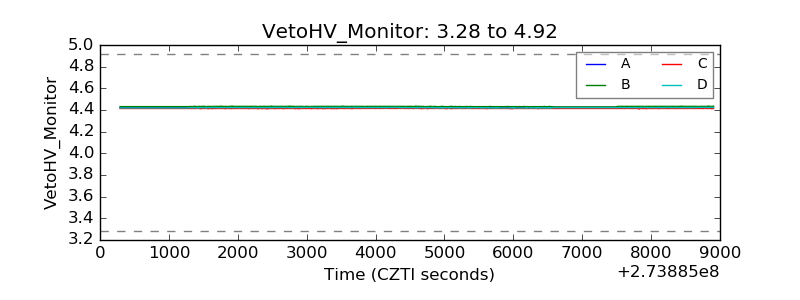 |
| Veto LLD | 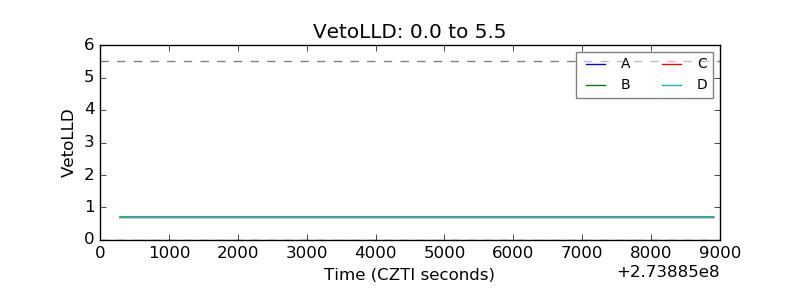 |
| Alpha Counter | 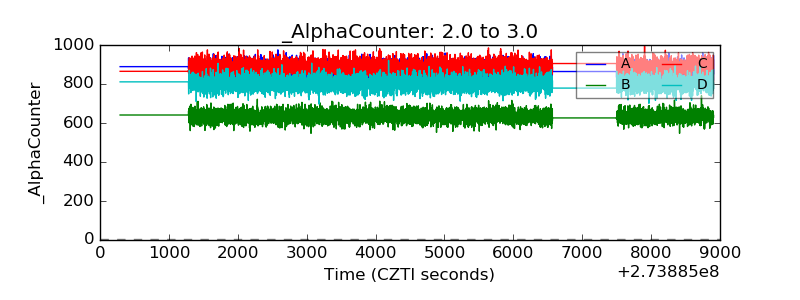 |
| _CPM_Rate | 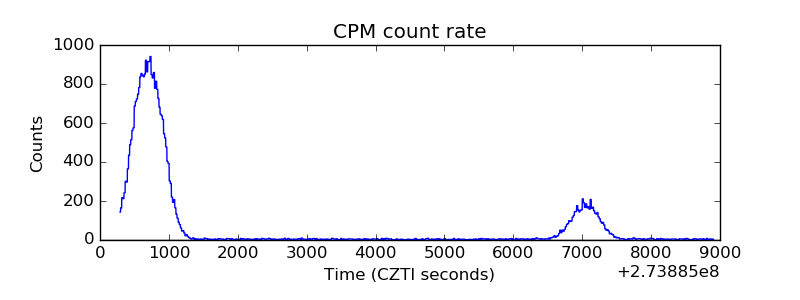 |
| CZT Counter |  |
| +2.5 Volts monitor |  |
| +5 Volts monitor |  |
| _ROLL_ROT | 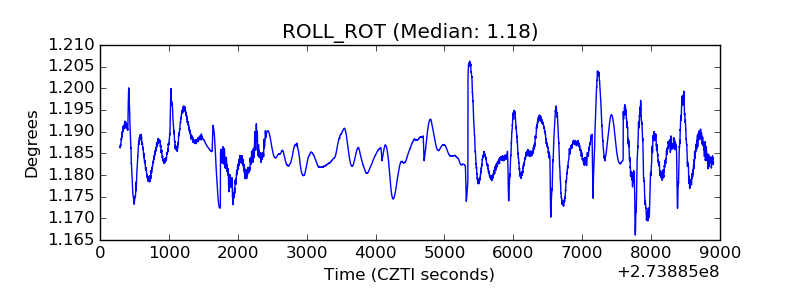 |
| _Roll_DEC | 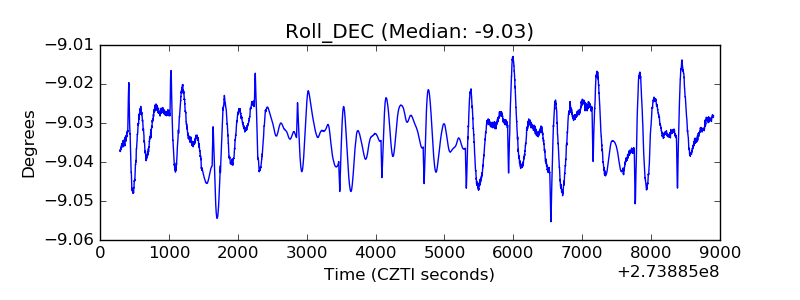 |
| _Roll_RA | 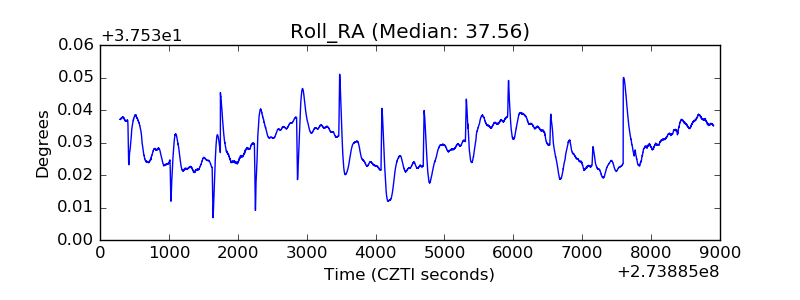 |
| Veto Counter | 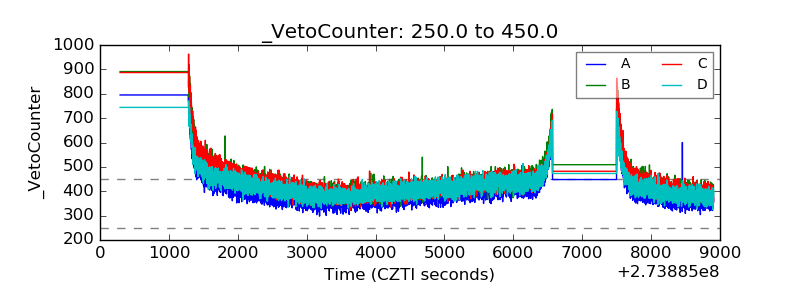 |