| Param | Original file | Final file |
|---|---|---|
| Filename | modeM0/AS1A04_143T01_9000002344_15901cztM0_level2.evt | modeM0/AS1A04_143T01_9000002344_15901cztM0_level2_quad_clean.evt |
| Size (bytes) | 2,524,466,880 | 433,149,120 |
| Size | 2.4 GB | 413.1 MB |
| Events in quadrant A | 21,175,723 | 2,649,952 |
| Events in quadrant B | 18,185,684 | 2,750,919 |
| Events in quadrant C | 17,649,570 | 2,612,107 |
| Events in quadrant D | 16,958,756 | 2,580,180 |
| Mode SS | |||
|---|---|---|---|
| Quadrant | BADHDUFLAG | Total packets | Discarded packets |
| A | 0 | 748 | 0 |
| B | 0 | 748 | 0 |
| C | 0 | 748 | 0 |
| D | 0 | 748 | 0 |
| Mode M0 | |||
|---|---|---|---|
| Quadrant | BADHDUFLAG | Total packets | Discarded packets |
| A | 0 | 87005 | 8 |
| B | 0 | 77507 | 7 |
| C | 0 | 75630 | 7 |
| D | 0 | 76385 | 7 |
| Mode M9 | |||
|---|---|---|---|
| Quadrant | BADHDUFLAG | Total packets | Discarded packets |
| A | 0 | 29 | 0 |
| B | 0 | 29 | 0 |
| C | 0 | 29 | 0 |
| D | 0 | 30 | 0 |
| Quadrant | Total seconds | Saturated seconds | Saturation percentage |
|---|---|---|---|
| A | 36764 | 1817 | 4.942335% |
| B | 36764 | 725 | 1.972038% |
| C | 36764 | 741 | 2.015559% |
| D | 36764 | 570 | 1.550430% |
Noise dominated data is calculated using 1-second bins in cleaned event files. If a bin has >2000 counts, and if more than 50% of those come from <1% of pixels, then it is considered to be noise-dominated and hence unusable.
| Quadrant | # 1 sec bins | Bins with >0 counts | Bins with >2000 counts | High rate bins dominated by noise | Noise dominated (total time) | Noise dominated (detector-on time) | Marked lightcurve |
|---|---|---|---|---|---|---|---|
| A | 39305 | 36769 | 879 | 879 | 2.24% | 2.39% | 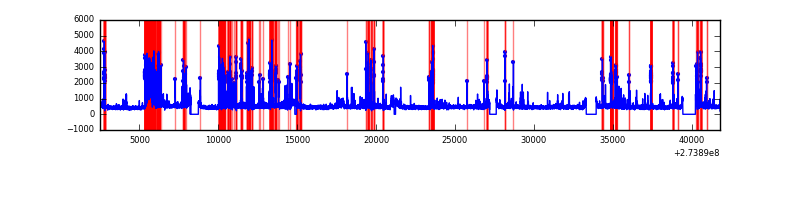 |
| B | 39305 | 36769 | 33 | 33 | 0.08% | 0.09% | 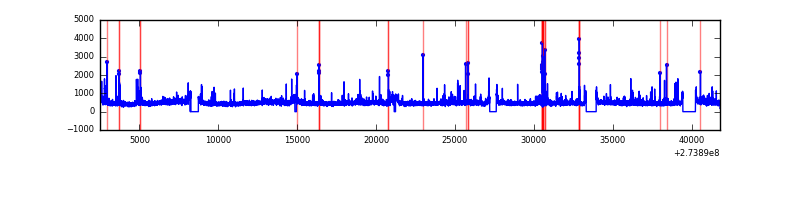 |
| C | 39305 | 36769 | 1 | 1 | 0.00% | 0.00% | 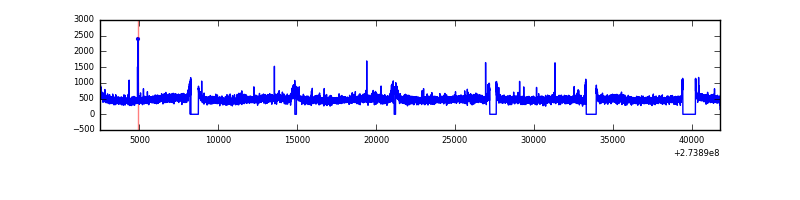 |
| D | 39305 | 36769 | 55 | 55 | 0.14% | 0.15% | 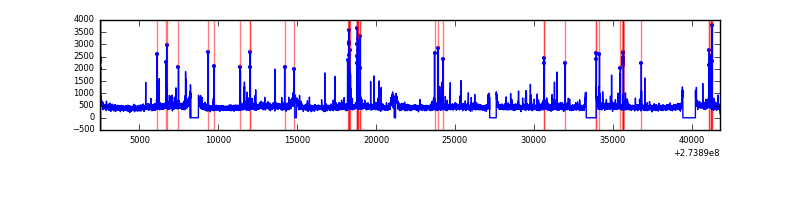 |
Top three noisy pixels from each quadrant. If the there are fewer than three noisy pixels in the level2.evt file, extra rows are filled as -1
| Pixel properties | Quadrant properties | ||||||
|---|---|---|---|---|---|---|---|
| Quadrant | DetID | PixID | Counts | Sigma | Mean | Median | Sigma |
| A | 15 | 239 | 4191073 | 4755.17 | 4372 | 4272 | 880.5 |
| A | 15 | 174 | 73498 | 78.62 | 4372 | 4272 | 880.5 |
| A | 9 | 143 | 55219 | 57.86 | 4372 | 4272 | 880.5 |
| B | 4 | 173 | 338102 | 390.85 | 4451 | 4334 | 854.0 |
| B | 4 | 216 | 136378 | 154.62 | 4451 | 4334 | 854.0 |
| B | 12 | 111 | 102214 | 114.62 | 4451 | 4334 | 854.0 |
| C | 14 | 238 | 646074 | 639.29 | 4275 | 4294 | 1003.9 |
| C | 3 | 233 | 272273 | 266.94 | 4275 | 4294 | 1003.9 |
| C | 10 | 22 | 34410 | 30.0 | 4275 | 4294 | 1003.9 |
| D | 13 | 172 | 265714 | 244.9 | 4360 | 4232 | 1067.7 |
| D | 2 | 234 | 172258 | 157.37 | 4360 | 4232 | 1067.7 |
| D | 2 | 120 | 62345 | 54.43 | 4360 | 4232 | 1067.7 |
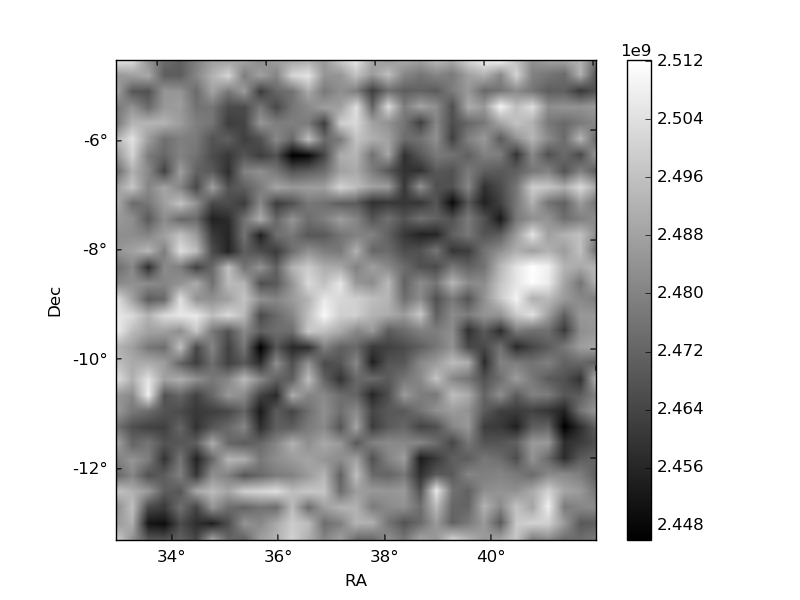
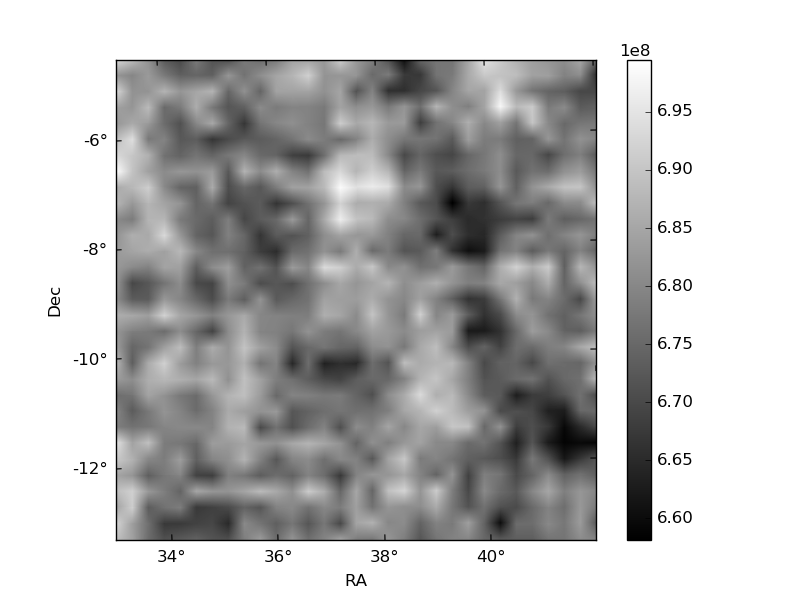
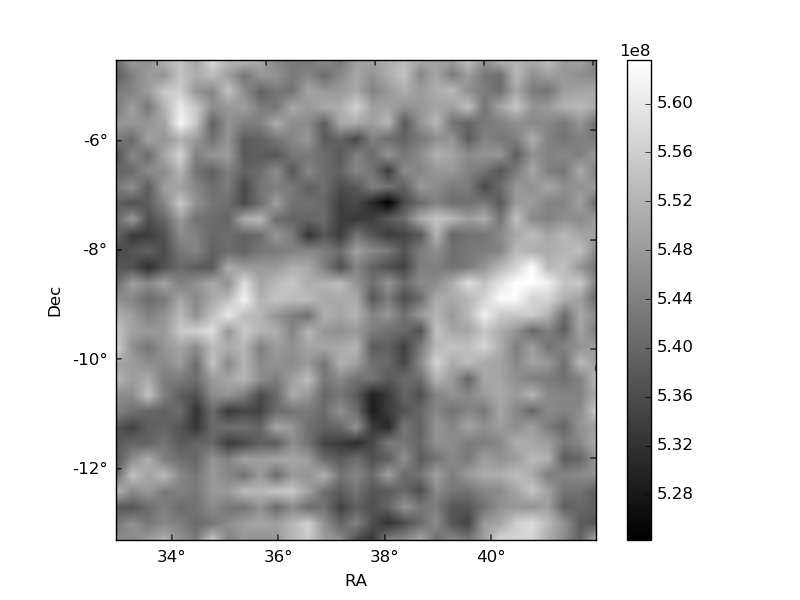
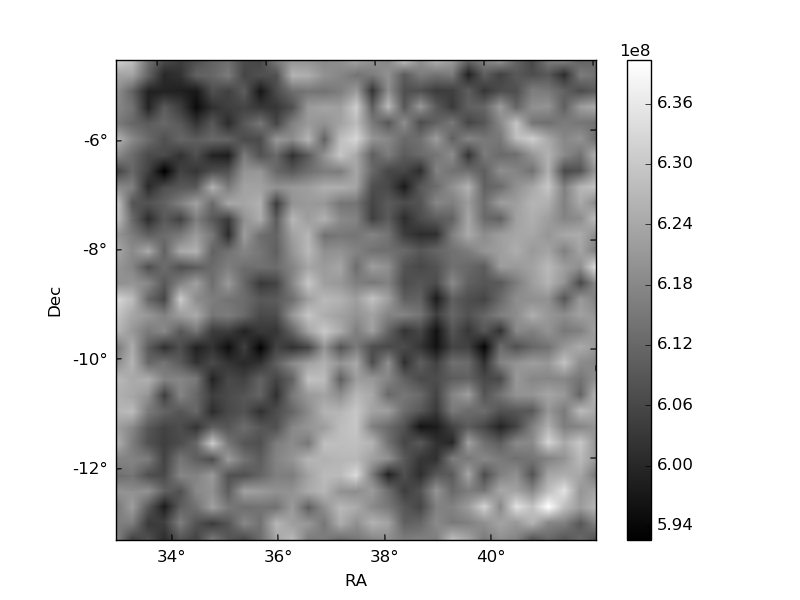
Histogram calculated using DETX and DETY for each event in the final _common_clean file
| Quadrant A | 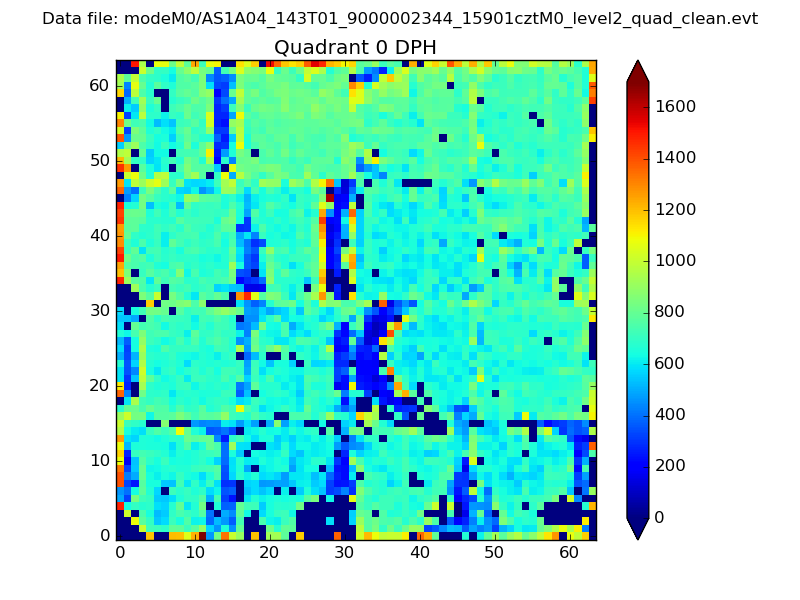 |
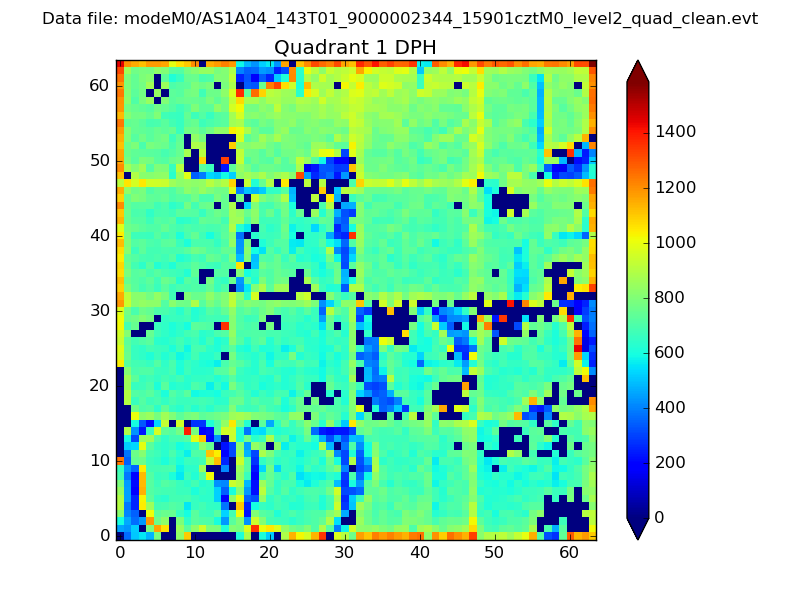 |
Quadrant B |
|---|---|---|---|
| Quadrant D | 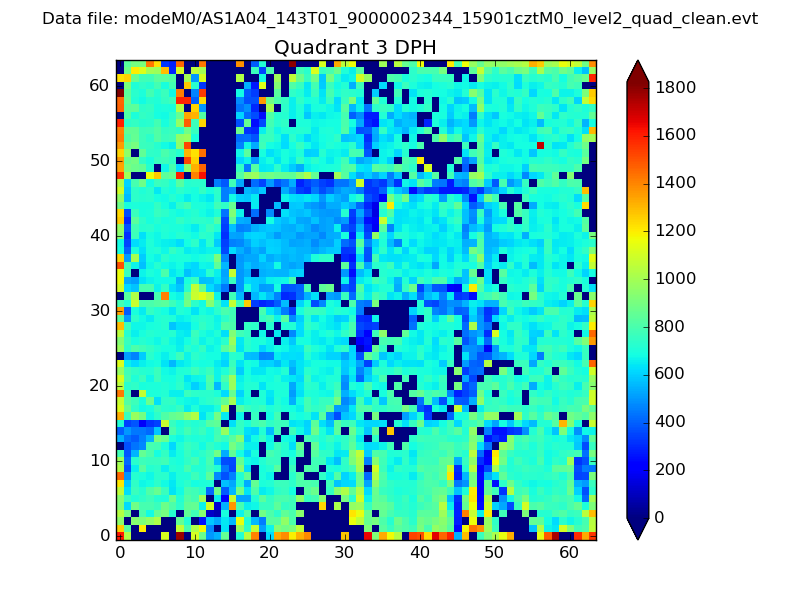 |
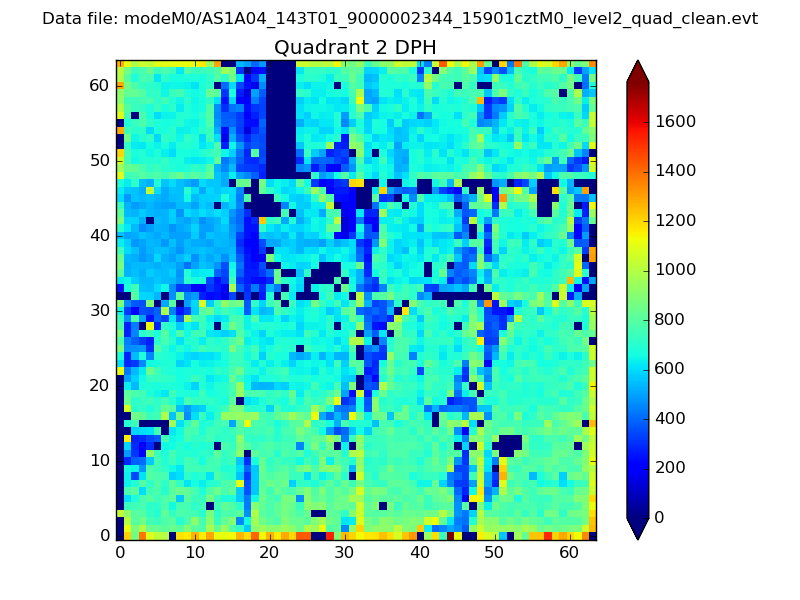 |
Quadrant C |
| Plot type | Count rate plots | Images |
|---|---|---|
| Comparison with Poisson distribution Blue bars denote a histogram of data divided into 1 sec bins. Red curve is a Poisson curve with rate = median count rate of data. |
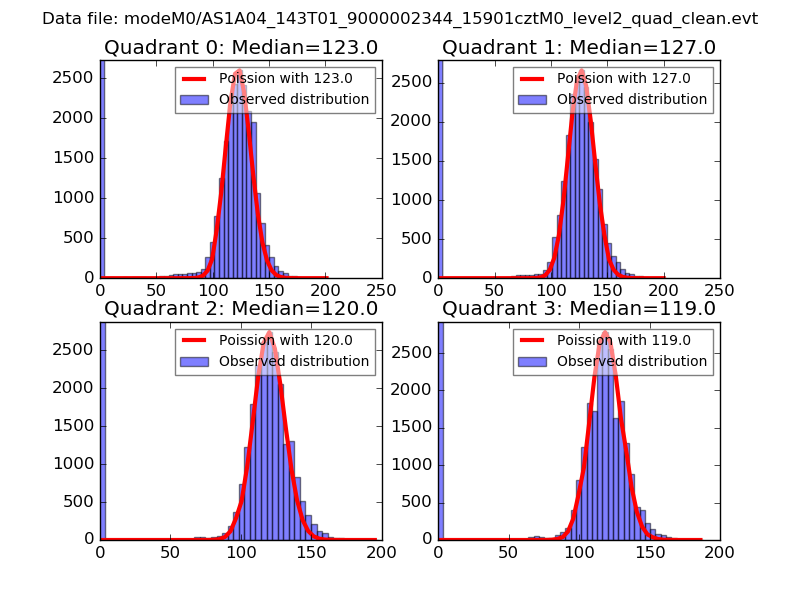 |
 |
| Quadrant-wise count rates Data is divided into 100 sec bins |
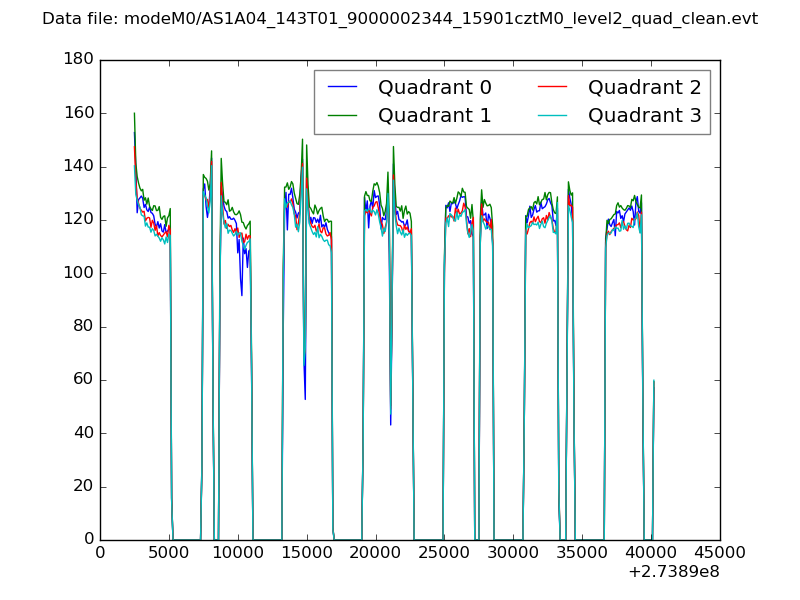 |
|
| Module-wise count rates for Quadrant A Data is divided into 100 sec bins |
 |
 |
| Module-wise count rates for Quadrant B Data is divided into 100 sec bins |
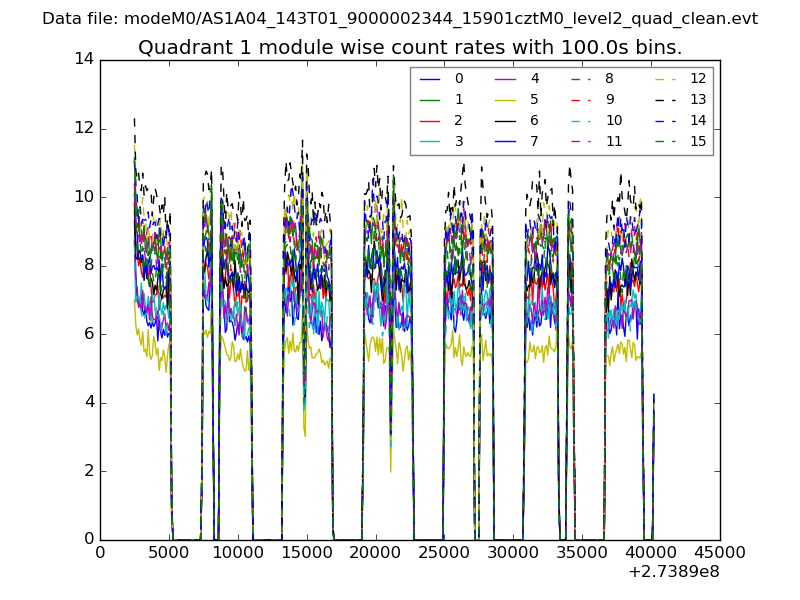 |
 |
| Module-wise count rates for Quadrant C Data is divided into 100 sec bins |
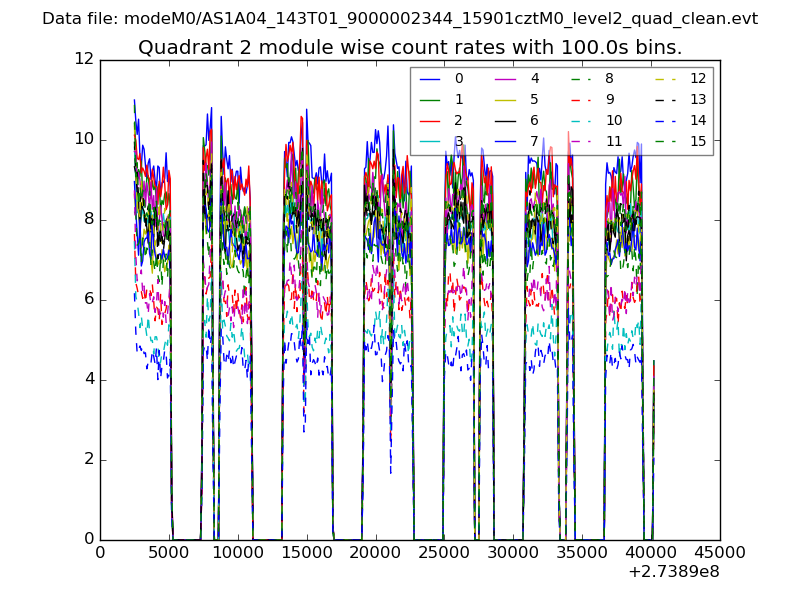 |
 |
| Module-wise count rates for Quadrant D Data is divided into 100 sec bins |
 |
 |
| Parameter | Plot |
|---|---|
| CZT HV Monitor | 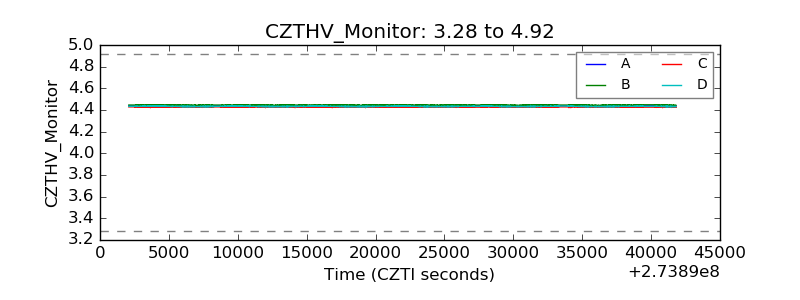 |
| D_VDD | 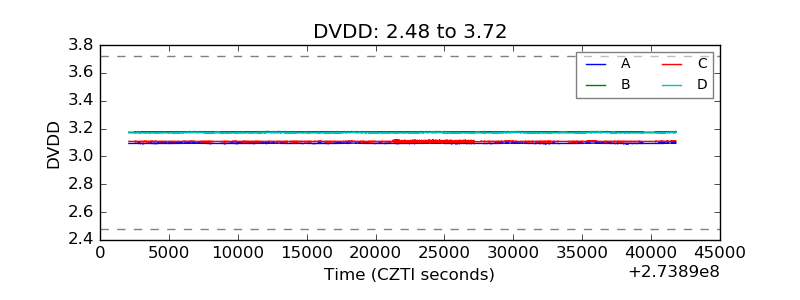 |
| Temperature 1 |  |
| Veto HV Monitor | 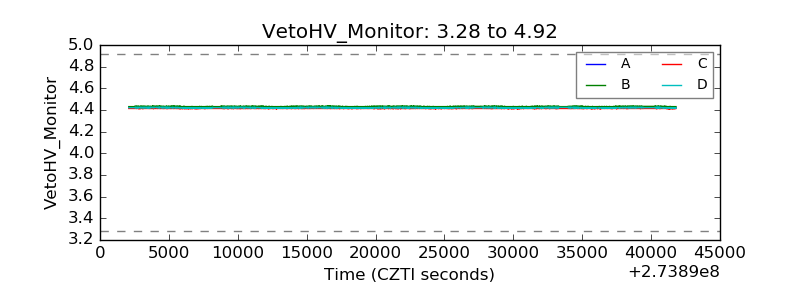 |
| Veto LLD | 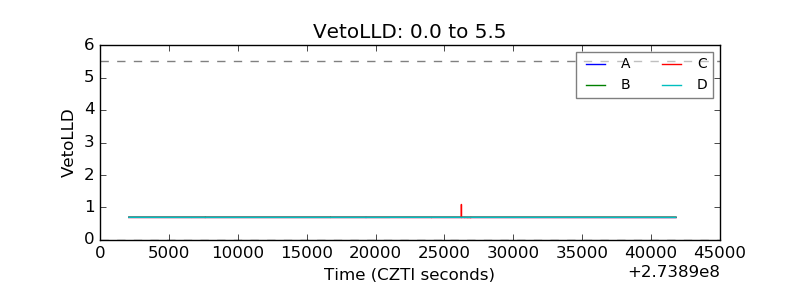 |
| Alpha Counter | 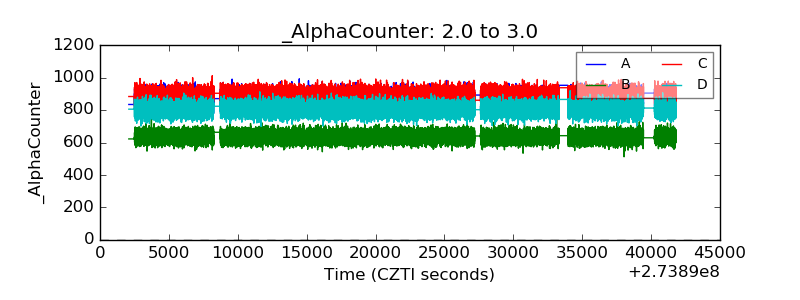 |
| _CPM_Rate | 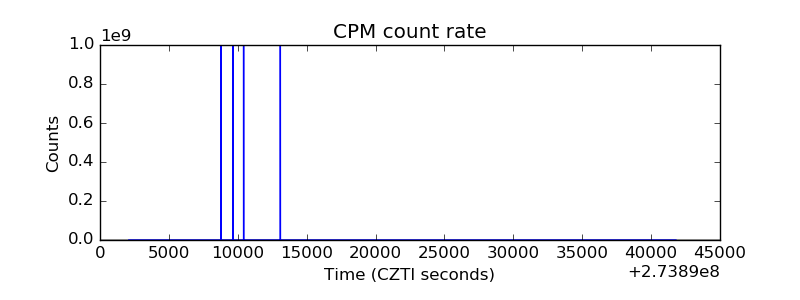 |
| CZT Counter | 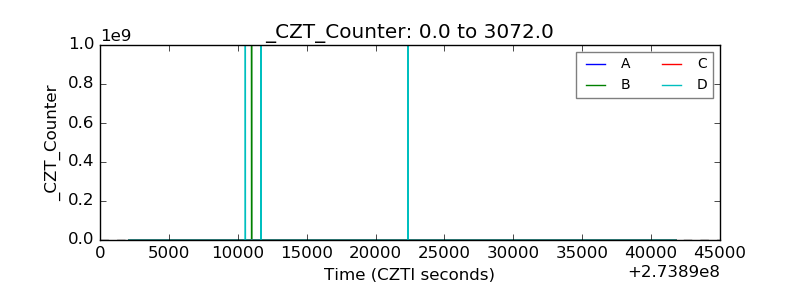 |
| +2.5 Volts monitor |  |
| +5 Volts monitor |  |
| _ROLL_ROT |  |
| _Roll_DEC |  |
| _Roll_RA | 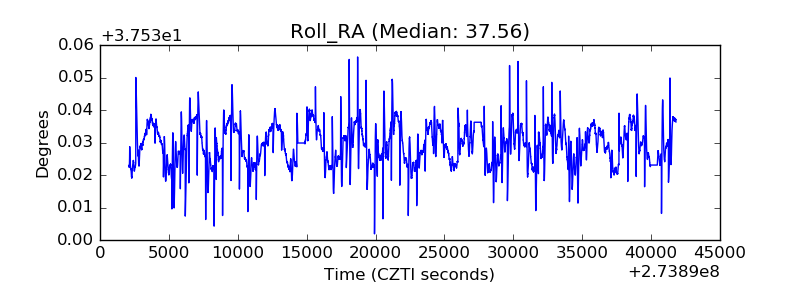 |
| Veto Counter |  |