| Param | Original file | Final file |
|---|---|---|
| Filename | modeM0/AS1A04_143T01_9000002344_15907cztM0_level2.evt | modeM0/AS1A04_143T01_9000002344_15907cztM0_level2_quad_clean.evt |
| Size (bytes) | 447,770,880 | 100,474,560 |
| Size | 427.0 MB | 95.8 MB |
| Events in quadrant A | 3,409,443 | 658,304 |
| Events in quadrant B | 3,412,850 | 685,782 |
| Events in quadrant C | 3,236,702 | 646,581 |
| Events in quadrant D | 3,089,325 | 628,381 |
| Mode SS | |||
|---|---|---|---|
| Quadrant | BADHDUFLAG | Total packets | Discarded packets |
| A | 0 | 122 | 0 |
| B | 0 | 122 | 0 |
| C | 0 | 122 | 0 |
| D | 0 | 122 | 0 |
| Mode M0 | |||
|---|---|---|---|
| Quadrant | BADHDUFLAG | Total packets | Discarded packets |
| A | 0 | 14060 | 3 |
| B | 0 | 13943 | 2 |
| C | 0 | 13400 | 2 |
| D | 0 | 13144 | 2 |
| Mode M9 | |||
|---|---|---|---|
| Quadrant | BADHDUFLAG | Total packets | Discarded packets |
| A | 0 | 14 | 0 |
| B | 0 | 14 | 0 |
| C | 0 | 14 | 0 |
| D | 0 | 14 | 0 |
| Quadrant | Total seconds | Saturated seconds | Saturation percentage |
|---|---|---|---|
| A | 6075 | 139 | 2.288066% |
| B | 6075 | 103 | 1.695473% |
| C | 6075 | 128 | 2.106996% |
| D | 6076 | 68 | 1.119157% |
Noise dominated data is calculated using 1-second bins in cleaned event files. If a bin has >2000 counts, and if more than 50% of those come from <1% of pixels, then it is considered to be noise-dominated and hence unusable.
| Quadrant | # 1 sec bins | Bins with >0 counts | Bins with >2000 counts | High rate bins dominated by noise | Noise dominated (total time) | Noise dominated (detector-on time) | Marked lightcurve |
|---|---|---|---|---|---|---|---|
| A | 7431 | 6077 | 20 | 20 | 0.27% | 0.33% | 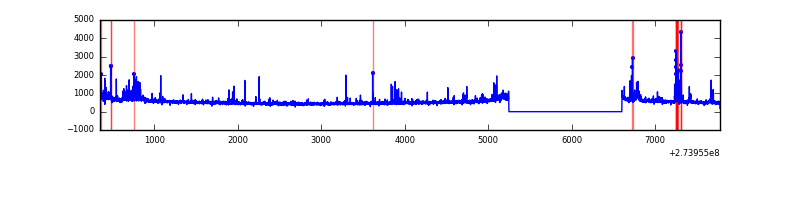 |
| B | 7431 | 6077 | 3 | 3 | 0.04% | 0.05% | 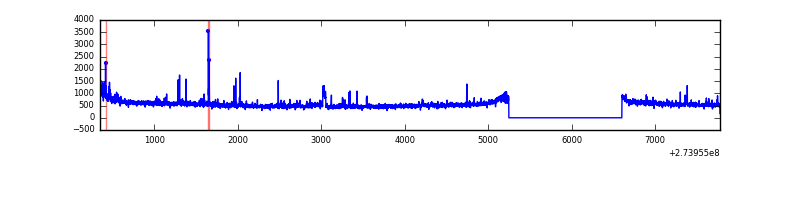 |
| C | 7431 | 6077 | 0 | 0 | 0.00% | 0.00% | 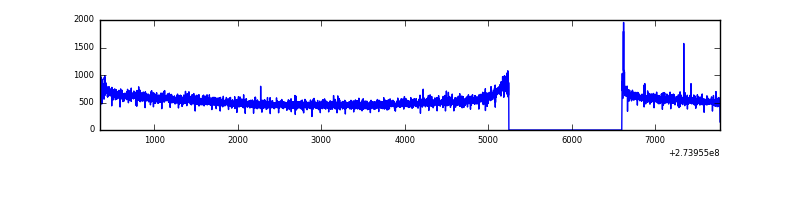 |
| D | 7432 | 6078 | 9 | 9 | 0.12% | 0.15% | 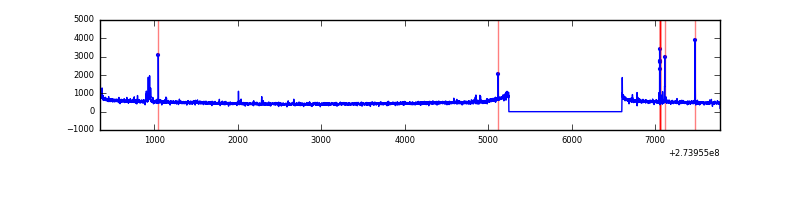 |
Top three noisy pixels from each quadrant. If the there are fewer than three noisy pixels in the level2.evt file, extra rows are filled as -1
| Pixel properties | Quadrant properties | ||||||
|---|---|---|---|---|---|---|---|
| Quadrant | DetID | PixID | Counts | Sigma | Mean | Median | Sigma |
| A | 15 | 239 | 283805 | 1743.91 | 809 | 793 | 162.3 |
| A | 9 | 143 | 10854 | 62.0 | 809 | 793 | 162.3 |
| A | 0 | 226 | 7133 | 39.07 | 809 | 793 | 162.3 |
| B | 10 | 245 | 52886 | 336.29 | 825 | 806 | 154.9 |
| B | 4 | 173 | 47859 | 303.83 | 825 | 806 | 154.9 |
| B | 0 | 189 | 19643 | 121.63 | 825 | 806 | 154.9 |
| C | 14 | 238 | 124465 | 675.06 | 788 | 797 | 183.2 |
| C | 3 | 233 | 29194 | 155.01 | 788 | 797 | 183.2 |
| C | 10 | 22 | 9305 | 46.44 | 788 | 797 | 183.2 |
| D | 2 | 234 | 27665 | 139.51 | 793 | 772 | 192.8 |
| D | 10 | 70 | 21438 | 107.21 | 793 | 772 | 192.8 |
| D | 1 | 52 | 17449 | 86.51 | 793 | 772 | 192.8 |
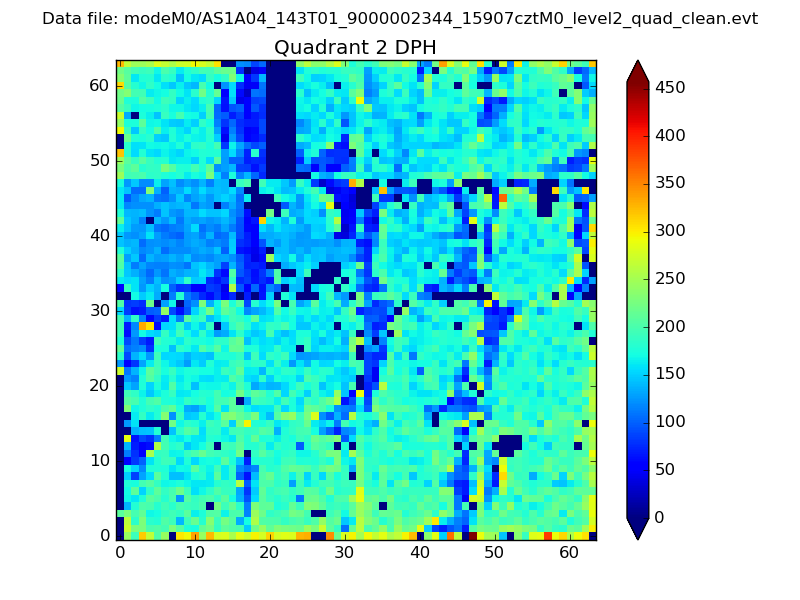
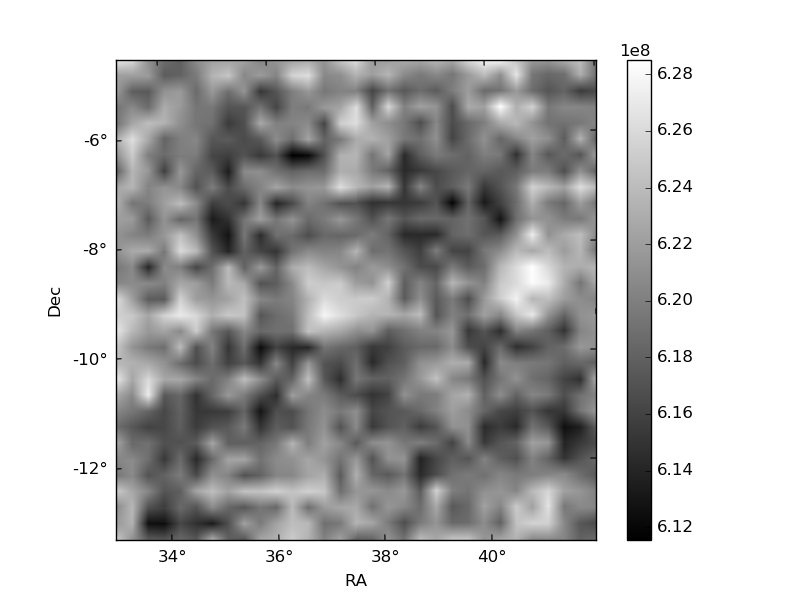
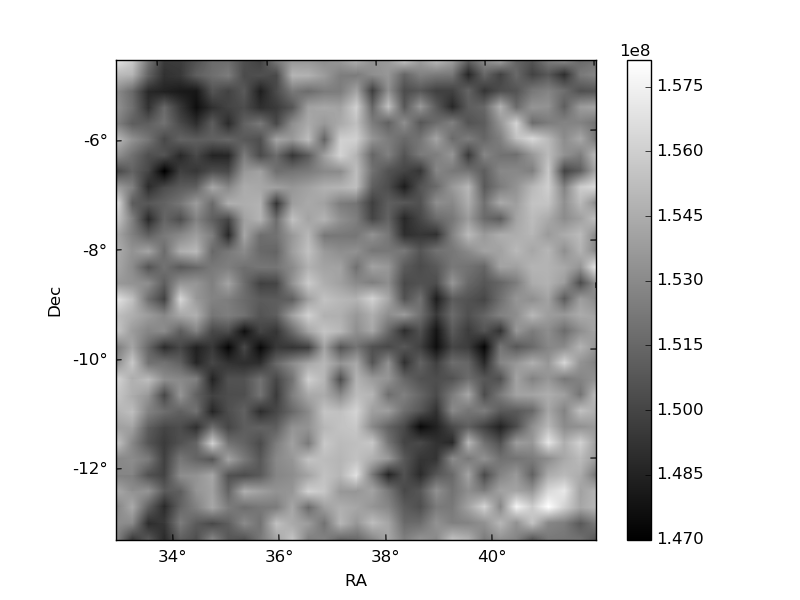
Histogram calculated using DETX and DETY for each event in the final _common_clean file
| Quadrant A | 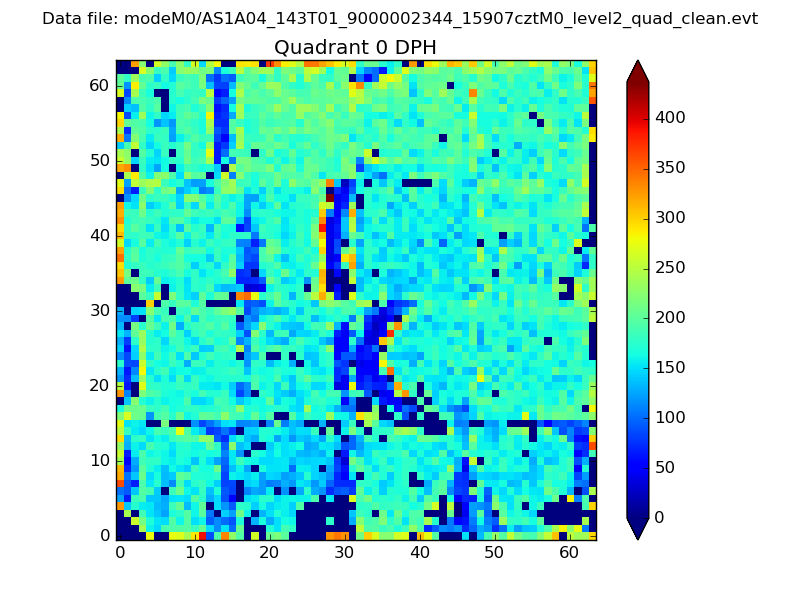 |
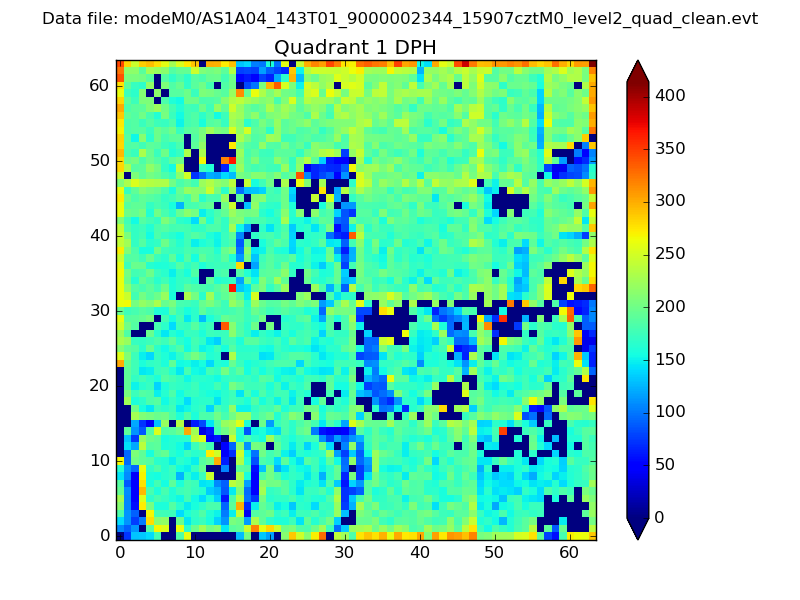 |
Quadrant B |
|---|---|---|---|
| Quadrant D | 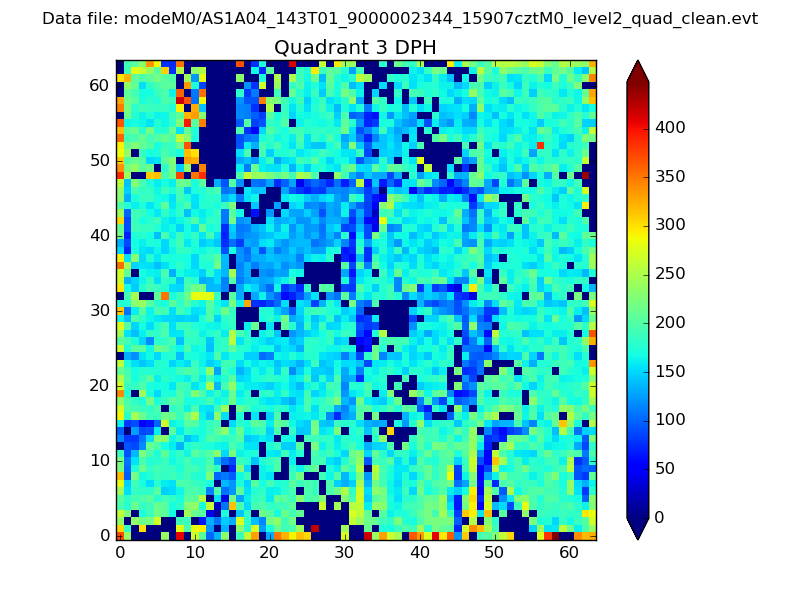 |
 |
Quadrant C |
| Plot type | Count rate plots | Images |
|---|---|---|
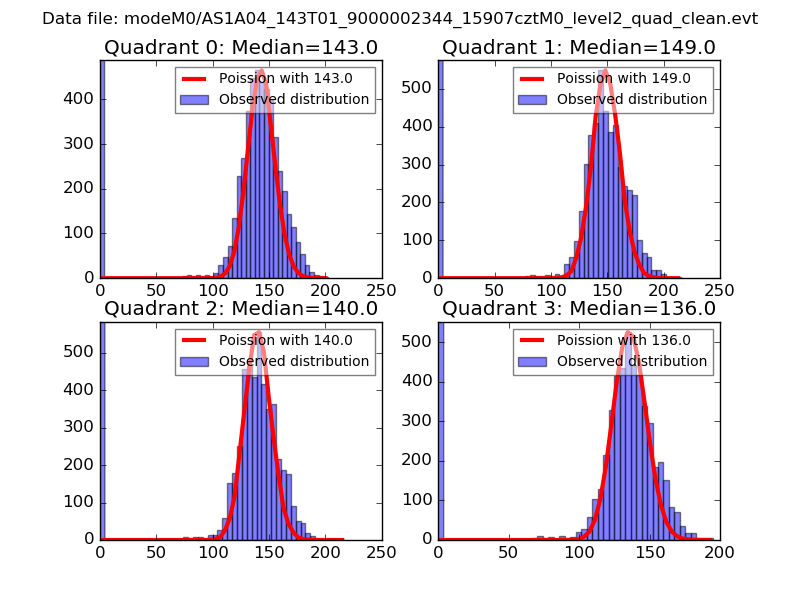
| Comparison with Poisson distribution Blue bars denote a histogram of data divided into 1 sec bins. Red curve is a Poisson curve with rate = median count rate of data. |
 |
 |
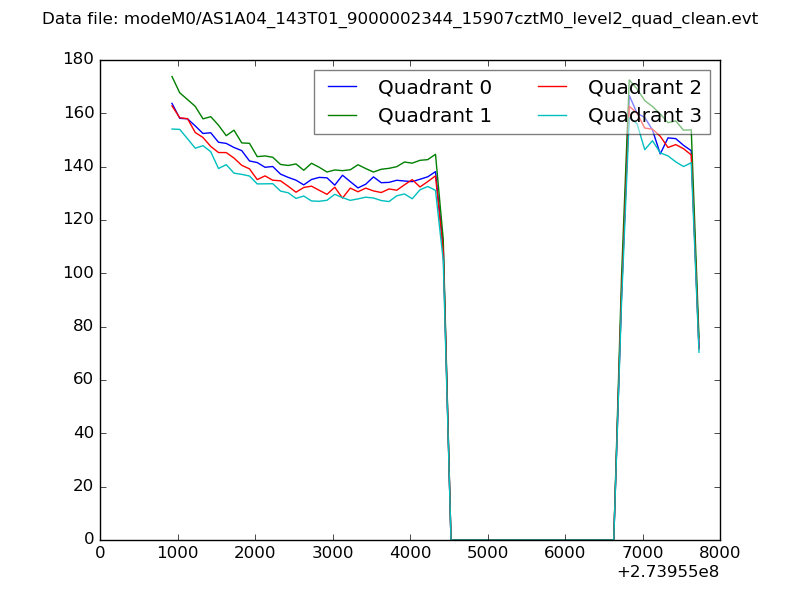
| Quadrant-wise count rates Data is divided into 100 sec bins |
 |
|
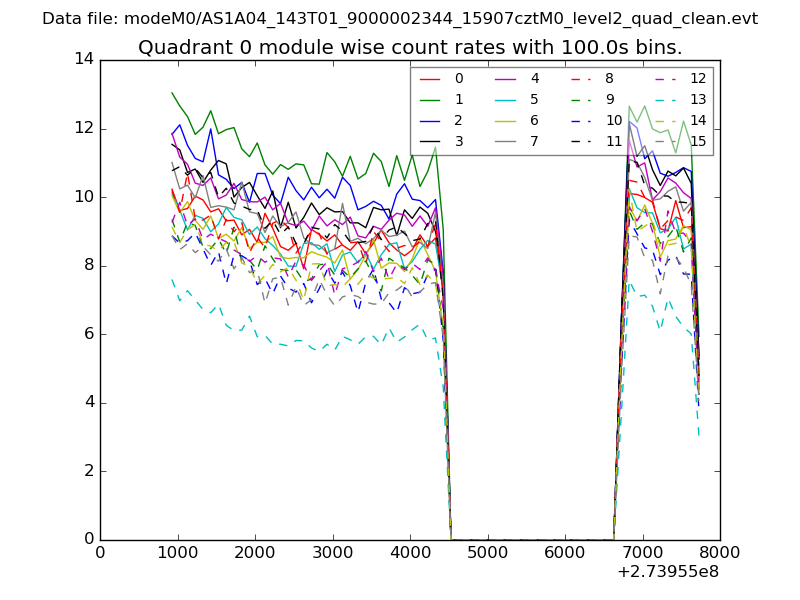
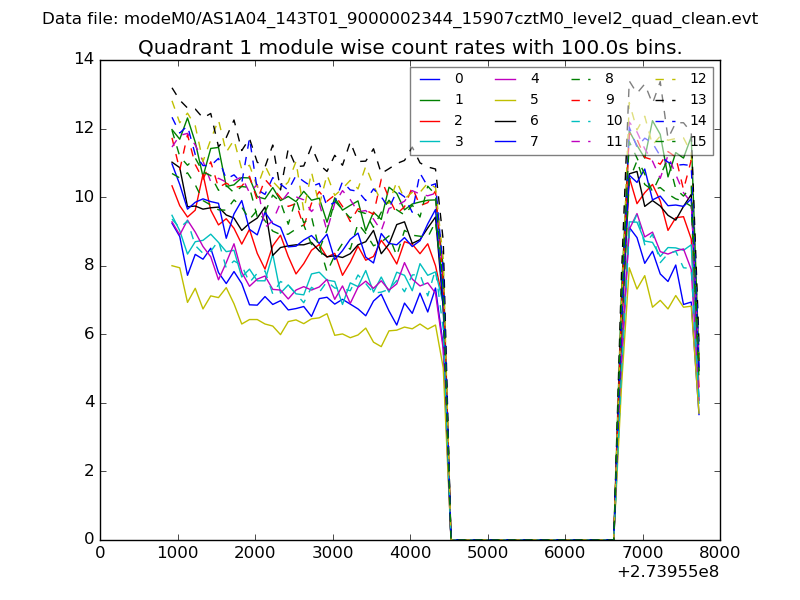
| Module-wise count rates for Quadrant A Data is divided into 100 sec bins |
 |
 |
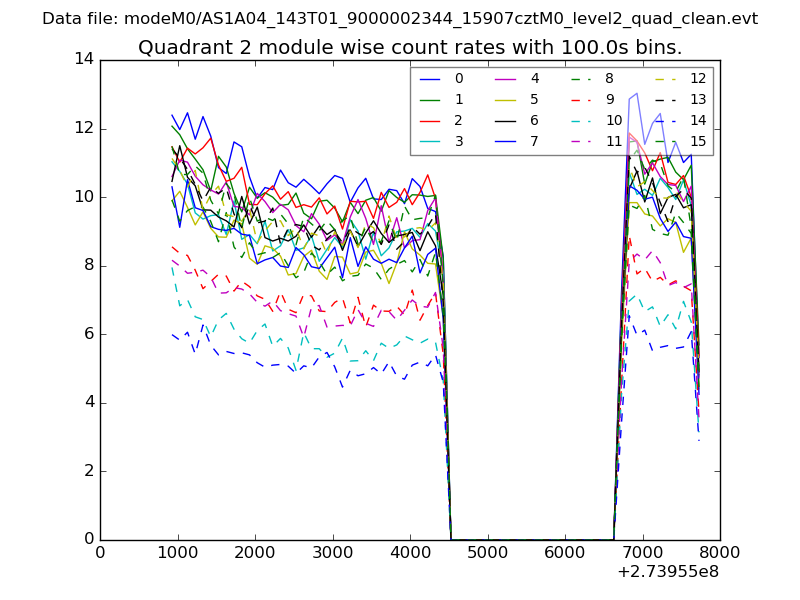
| Module-wise count rates for Quadrant B Data is divided into 100 sec bins |
 |
 |
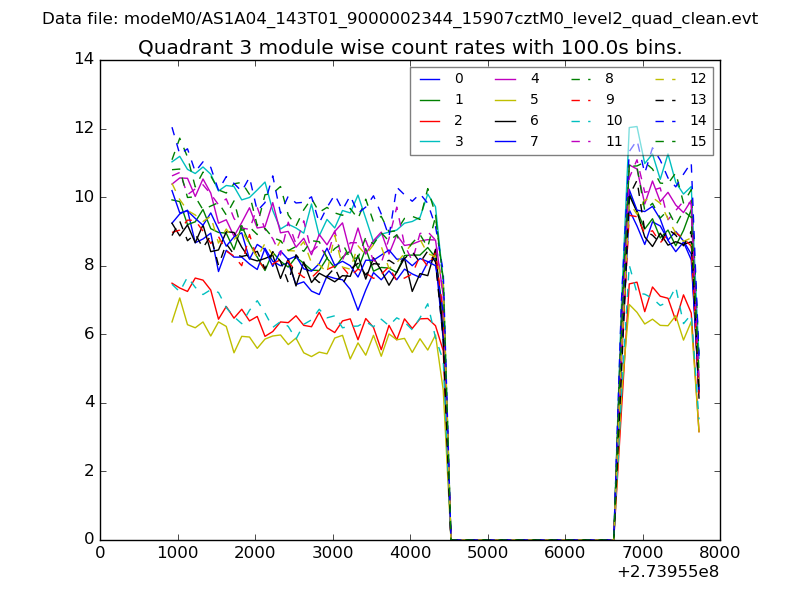
| Module-wise count rates for Quadrant C Data is divided into 100 sec bins |
 |
 |
| Module-wise count rates for Quadrant D Data is divided into 100 sec bins |
 |
 |
| Parameter | Plot |
|---|---|
| CZT HV Monitor | 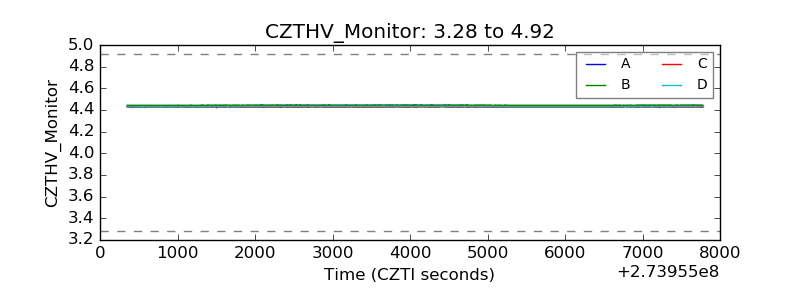 |
| D_VDD | 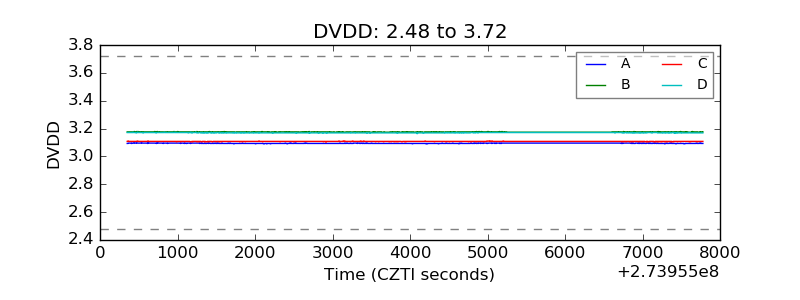 |
| Temperature 1 | 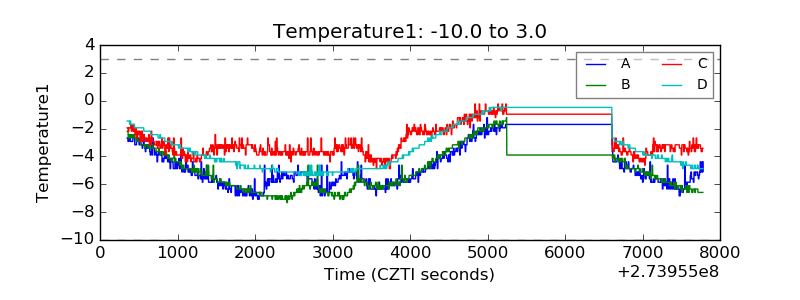 |
| Veto HV Monitor | 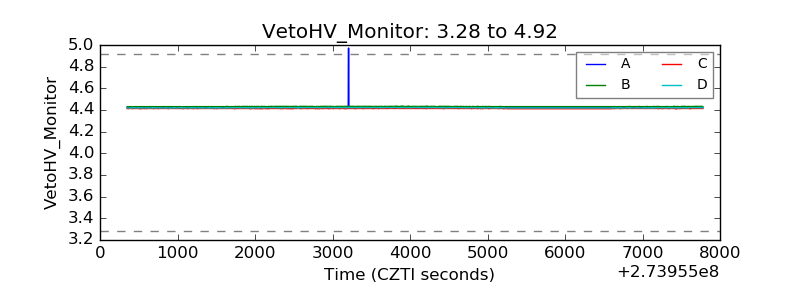 |
| Veto LLD | 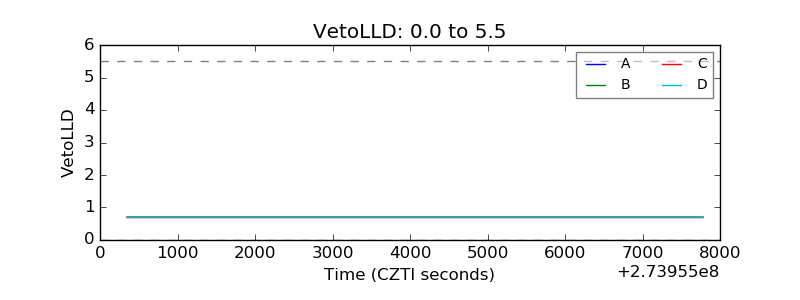 |
| Alpha Counter | 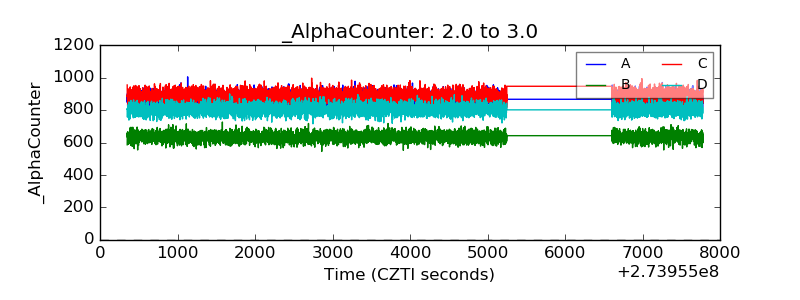 |
| _CPM_Rate | 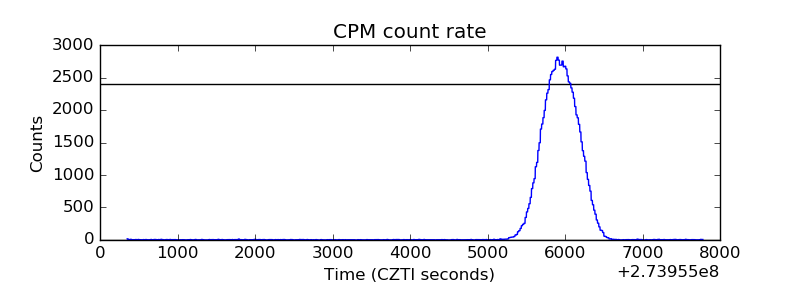 |
| CZT Counter | 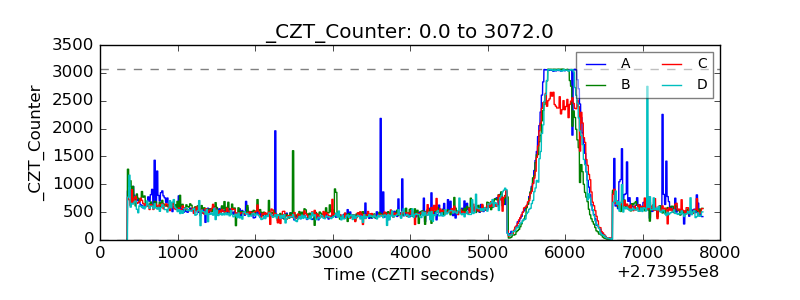 |
| +2.5 Volts monitor |  |
| +5 Volts monitor |  |
| _ROLL_ROT | 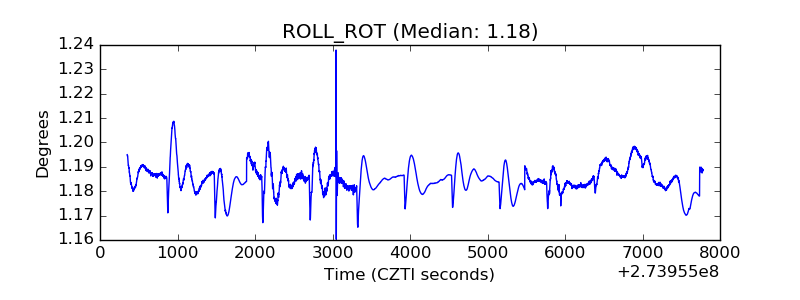 |
| _Roll_DEC | 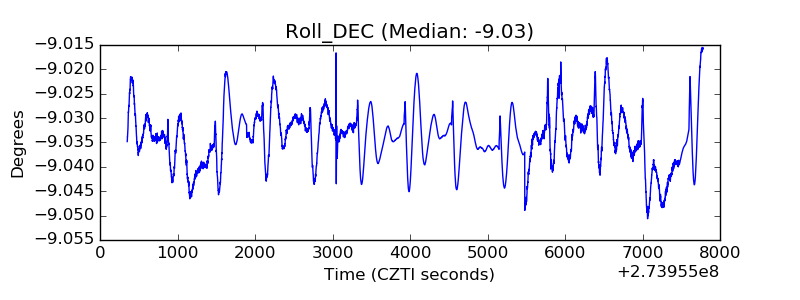 |
| _Roll_RA | 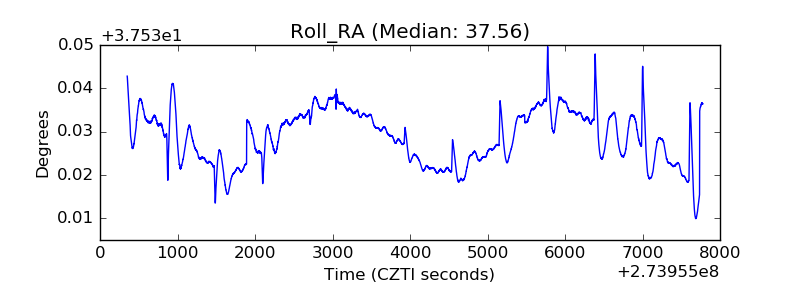 |
| Veto Counter | 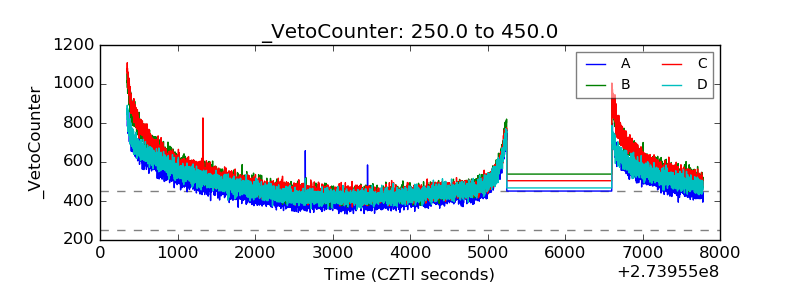 |