| Param | Original file | Final file |
|---|---|---|
| Filename | modeM0/AS1A04_143T01_9000002344_15908cztM0_level2.evt | modeM0/AS1A04_143T01_9000002344_15908cztM0_level2_quad_clean.evt |
| Size (bytes) | 440,919,360 | 104,973,120 |
| Size | 420.5 MB | 100.1 MB |
| Events in quadrant A | 3,310,678 | 689,059 |
| Events in quadrant B | 3,219,670 | 720,284 |
| Events in quadrant C | 3,165,916 | 677,331 |
| Events in quadrant D | 3,234,591 | 658,655 |
| Mode SS | |||
|---|---|---|---|
| Quadrant | BADHDUFLAG | Total packets | Discarded packets |
| A | 0 | 126 | 0 |
| B | 0 | 126 | 0 |
| C | 0 | 126 | 0 |
| D | 0 | 126 | 0 |
| Mode M0 | |||
|---|---|---|---|
| Quadrant | BADHDUFLAG | Total packets | Discarded packets |
| A | 0 | 13877 | 3 |
| B | 0 | 13489 | 2 |
| C | 0 | 13220 | 2 |
| D | 0 | 13741 | 2 |
| Mode M9 | |||
|---|---|---|---|
| Quadrant | BADHDUFLAG | Total packets | Discarded packets |
| A | 0 | 23 | 0 |
| B | 0 | 23 | 0 |
| C | 0 | 23 | 0 |
| D | 0 | 24 | 0 |
| Quadrant | Total seconds | Saturated seconds | Saturation percentage |
|---|---|---|---|
| A | 6223 | 102 | 1.639081% |
| B | 6223 | 45 | 0.723124% |
| C | 6223 | 70 | 1.124859% |
| D | 6223 | 66 | 1.060582% |
Noise dominated data is calculated using 1-second bins in cleaned event files. If a bin has >2000 counts, and if more than 50% of those come from <1% of pixels, then it is considered to be noise-dominated and hence unusable.
| Quadrant | # 1 sec bins | Bins with >0 counts | Bins with >2000 counts | High rate bins dominated by noise | Noise dominated (total time) | Noise dominated (detector-on time) | Marked lightcurve |
|---|---|---|---|---|---|---|---|
| A | 7584 | 6226 | 23 | 23 | 0.30% | 0.37% | 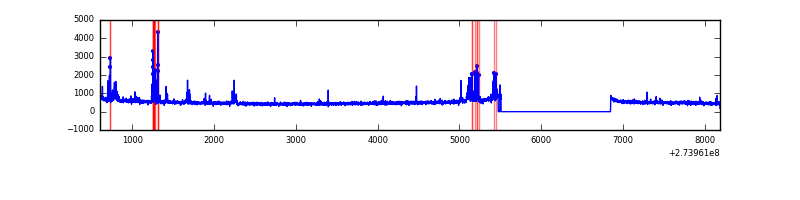 |
| B | 7584 | 6226 | 1 | 1 | 0.01% | 0.02% | 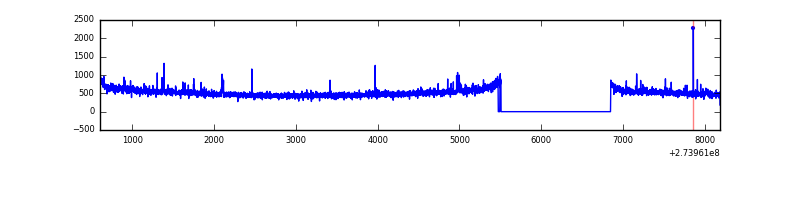 |
| C | 7584 | 6226 | 0 | 0 | 0.00% | 0.00% | 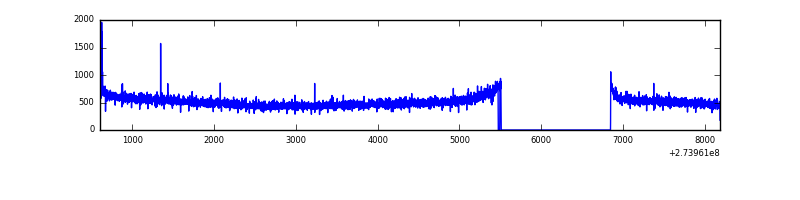 |
| D | 7584 | 6226 | 28 | 28 | 0.37% | 0.45% | 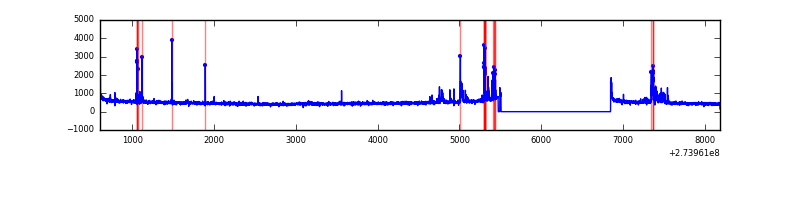 |
Top three noisy pixels from each quadrant. If the there are fewer than three noisy pixels in the level2.evt file, extra rows are filled as -1
| Pixel properties | Quadrant properties | ||||||
|---|---|---|---|---|---|---|---|
| Quadrant | DetID | PixID | Counts | Sigma | Mean | Median | Sigma |
| A | 15 | 239 | 247539 | 1548.23 | 794 | 778 | 159.4 |
| A | 3 | 80 | 8102 | 45.95 | 794 | 778 | 159.4 |
| A | 0 | 226 | 6900 | 38.41 | 794 | 778 | 159.4 |
| B | 4 | 173 | 28008 | 178.55 | 808 | 790 | 152.4 |
| B | 12 | 111 | 17260 | 108.04 | 808 | 790 | 152.4 |
| B | 11 | 111 | 14562 | 90.34 | 808 | 790 | 152.4 |
| C | 14 | 238 | 119069 | 655.33 | 776 | 783 | 180.5 |
| C | 3 | 233 | 13102 | 68.25 | 776 | 783 | 180.5 |
| C | 10 | 22 | 8195 | 41.06 | 776 | 783 | 180.5 |
| D | 12 | 17 | 165577 | 874.19 | 775 | 755 | 188.5 |
| D | 1 | 52 | 43471 | 226.56 | 775 | 755 | 188.5 |
| D | 13 | 172 | 39690 | 206.51 | 775 | 755 | 188.5 |
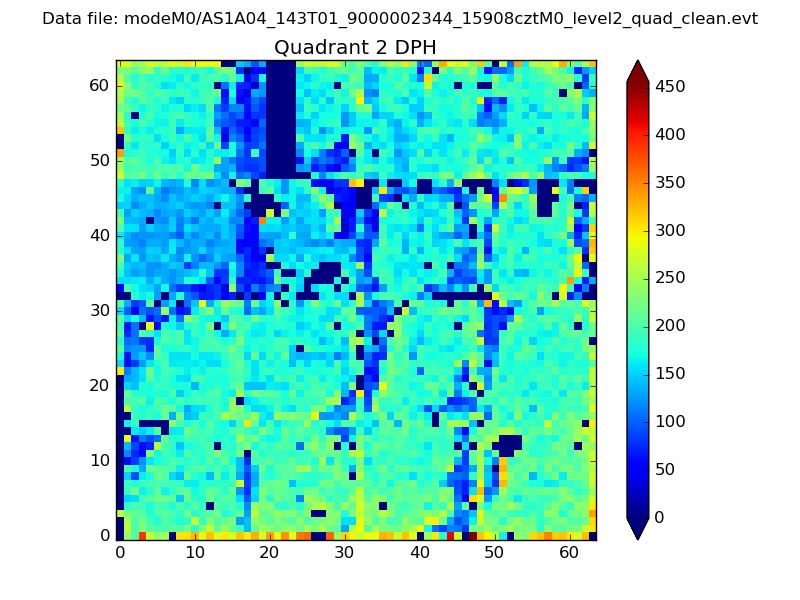
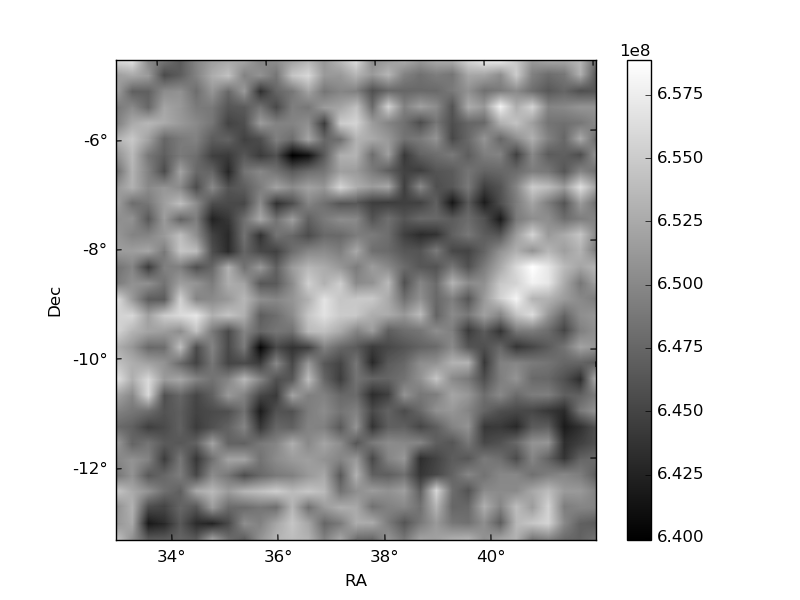
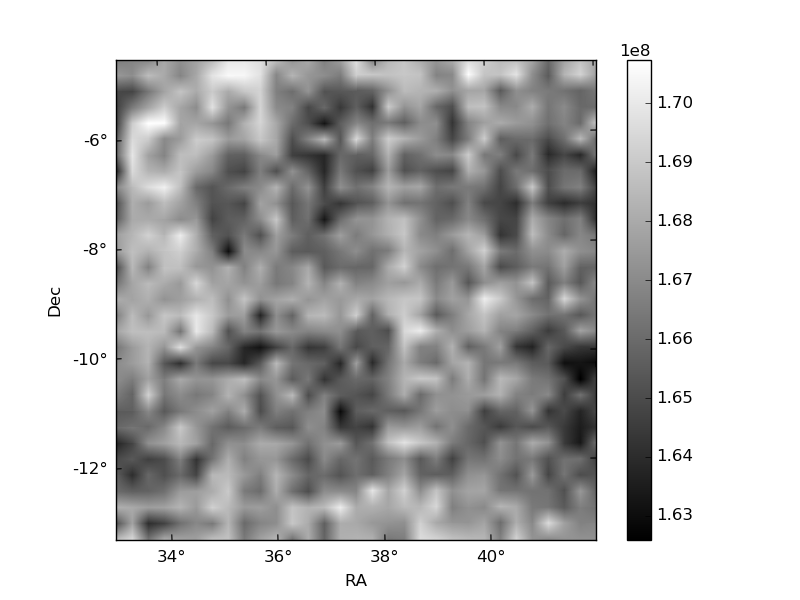
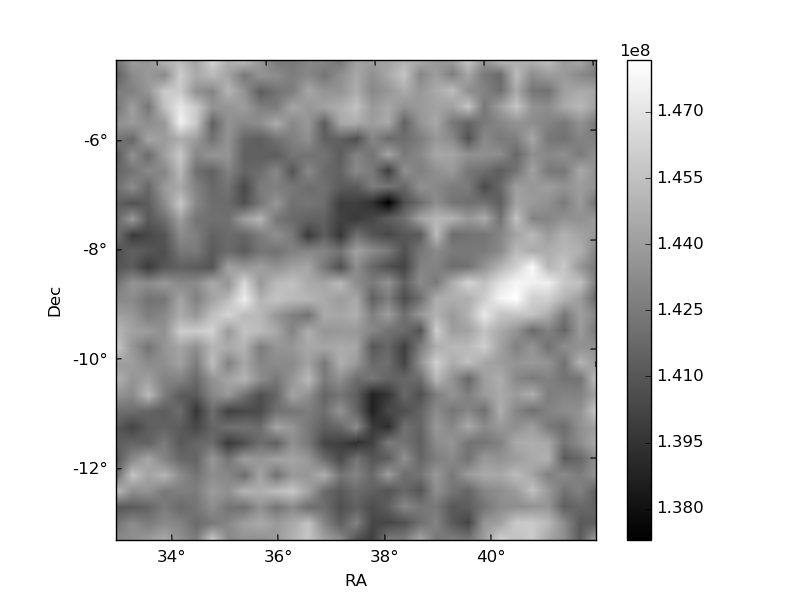
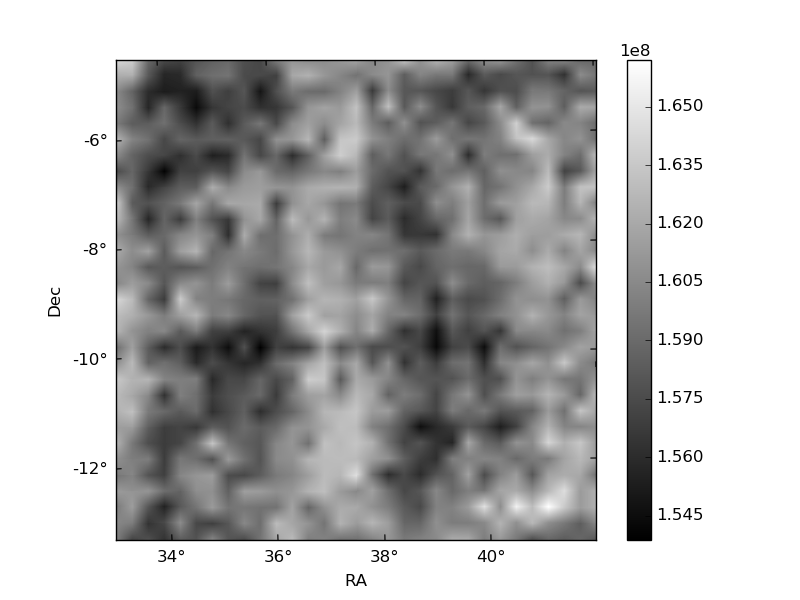
Histogram calculated using DETX and DETY for each event in the final _common_clean file
| Quadrant A | 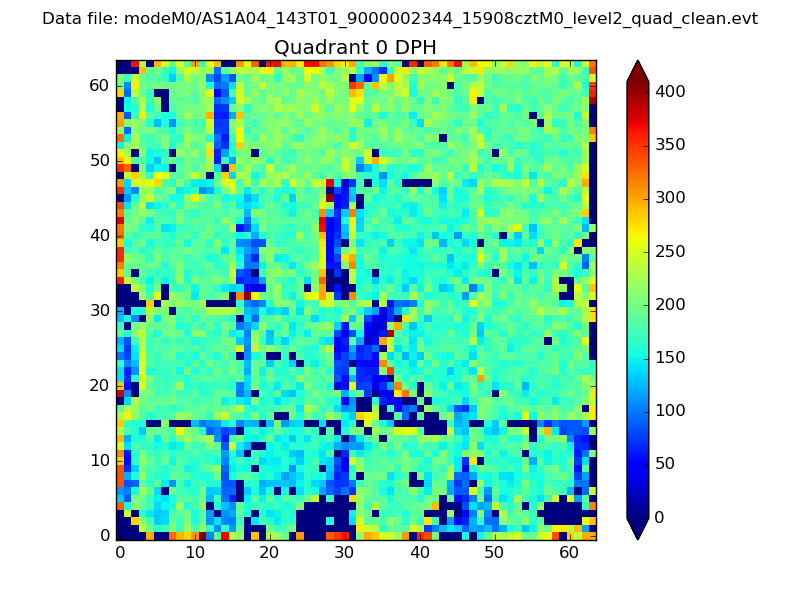 |
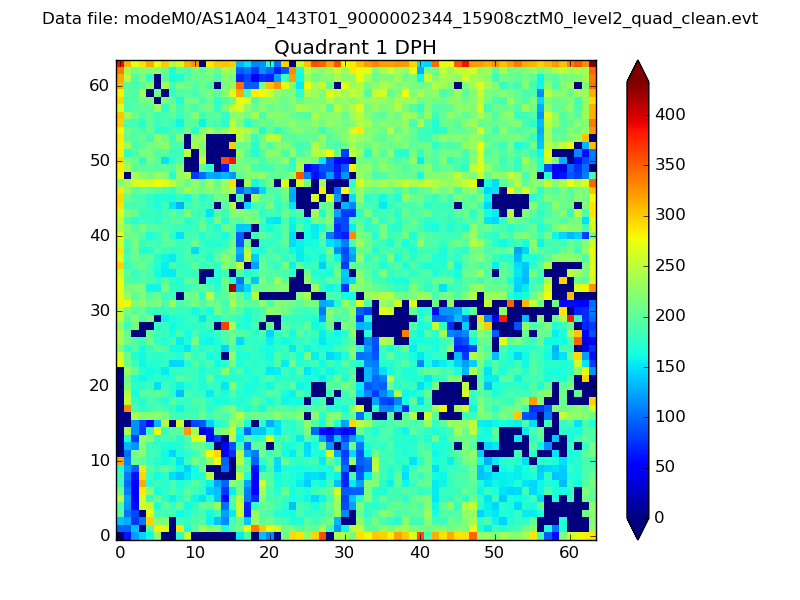 |
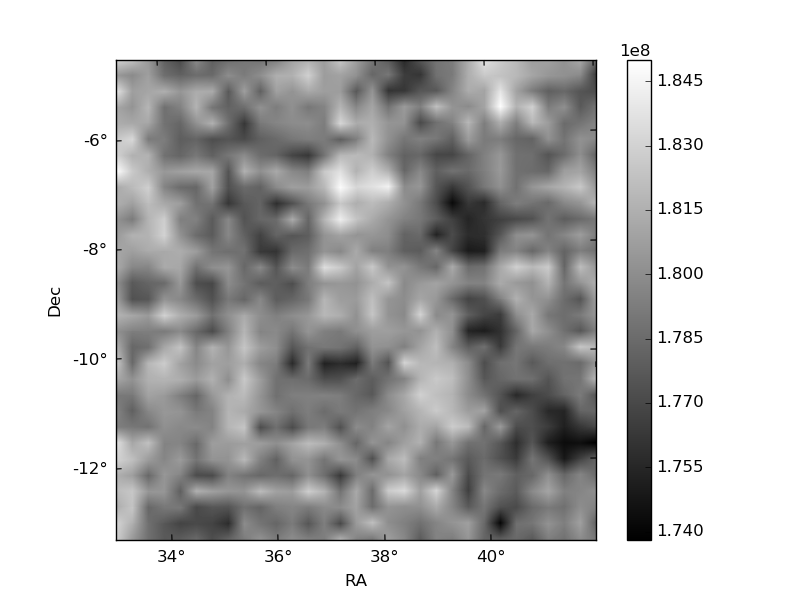
Quadrant B |
|---|---|---|---|
| Quadrant D | 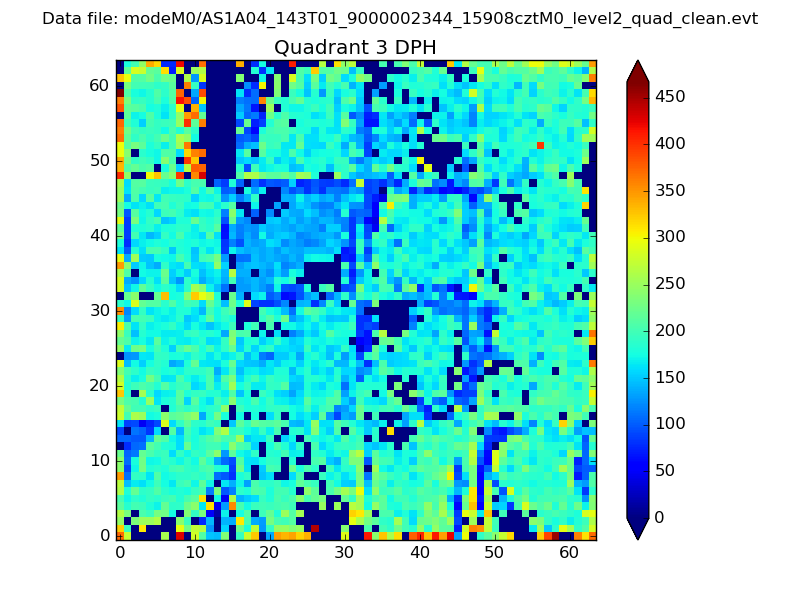 |
 |
Quadrant C |
| Plot type | Count rate plots | Images |
|---|---|---|
| Comparison with Poisson distribution Blue bars denote a histogram of data divided into 1 sec bins. Red curve is a Poisson curve with rate = median count rate of data. |
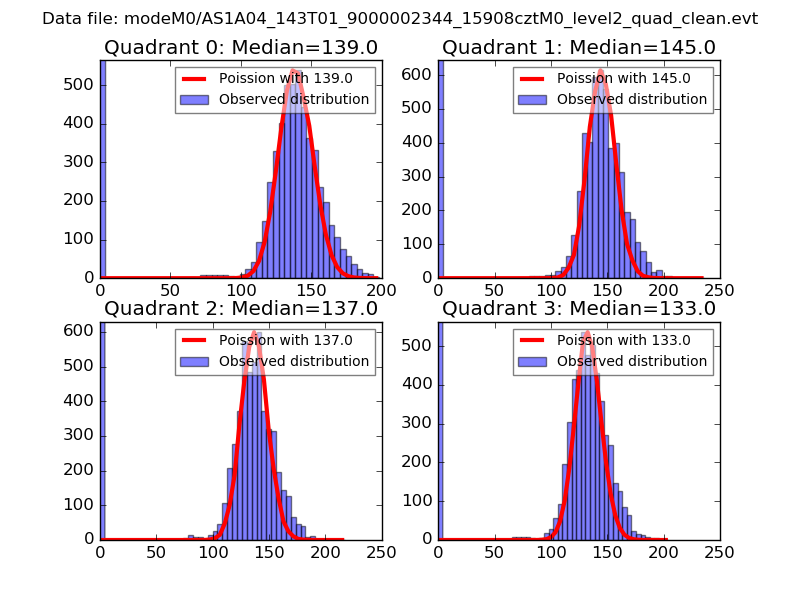 |
 |
| Quadrant-wise count rates Data is divided into 100 sec bins |
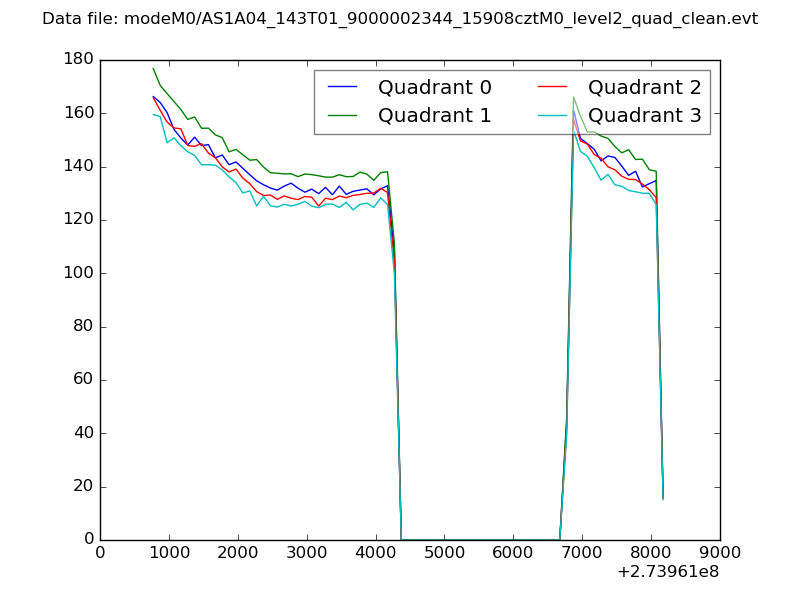 |
|
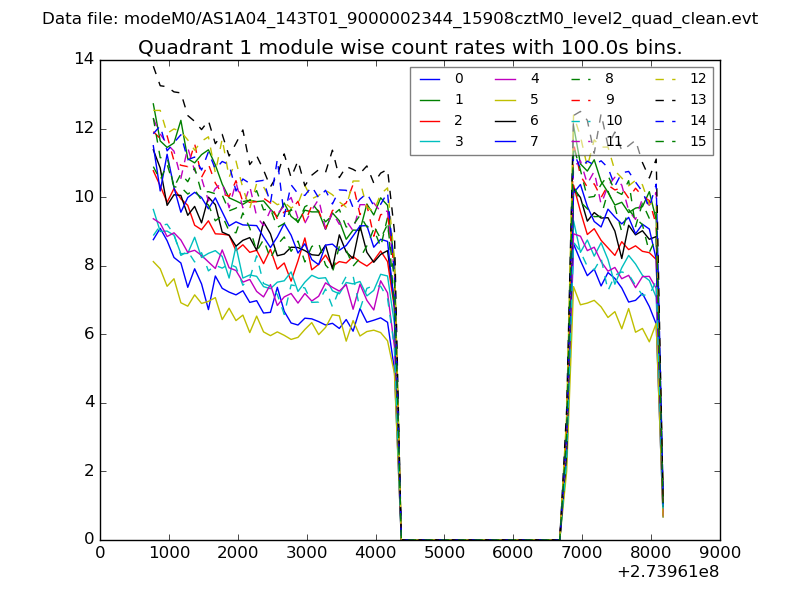
| Module-wise count rates for Quadrant A Data is divided into 100 sec bins |
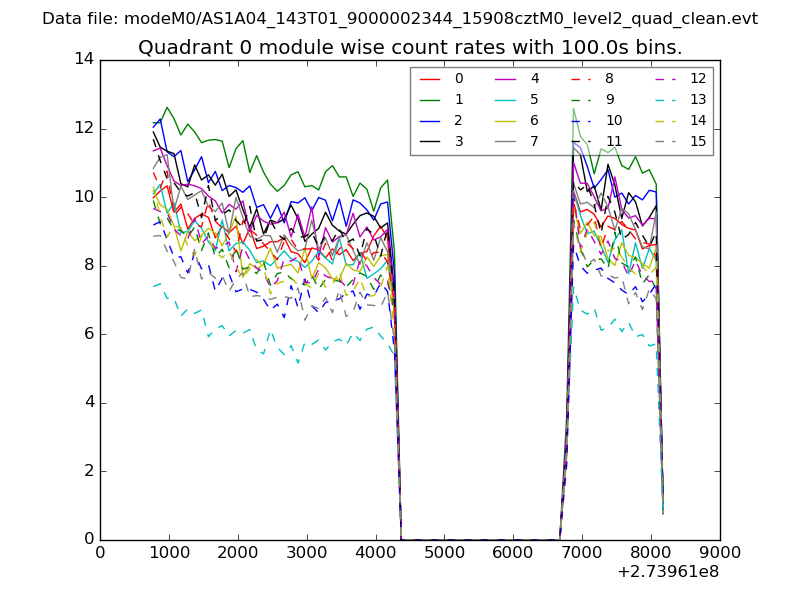 |
 |
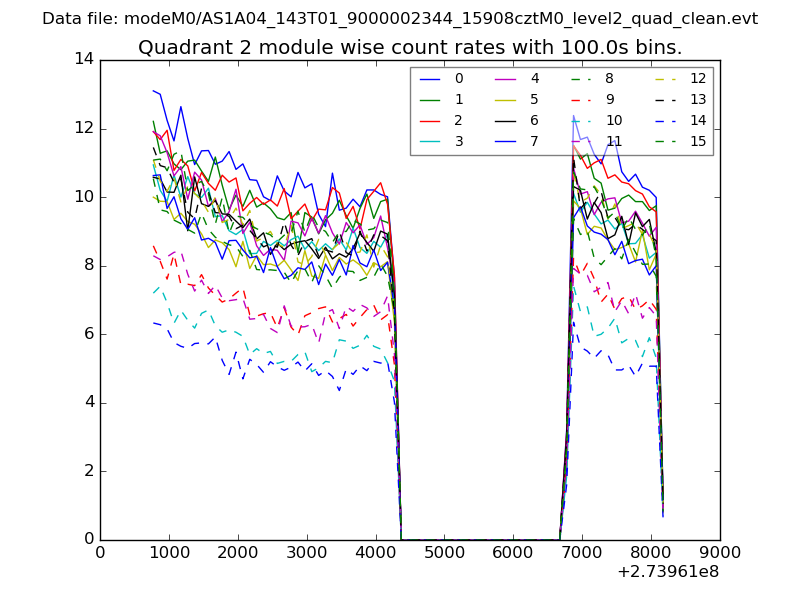
| Module-wise count rates for Quadrant B Data is divided into 100 sec bins |
 |
 |
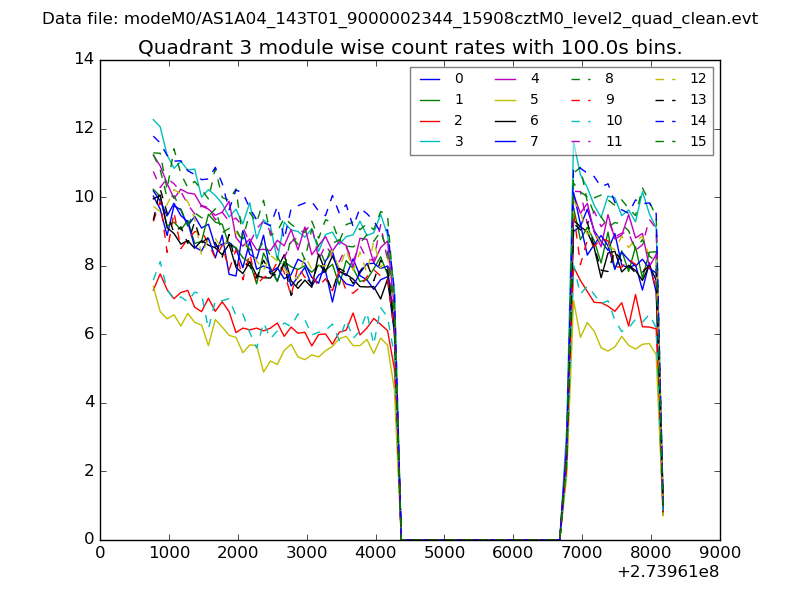
| Module-wise count rates for Quadrant C Data is divided into 100 sec bins |
 |
 |
| Module-wise count rates for Quadrant D Data is divided into 100 sec bins |
 |
 |
| Parameter | Plot |
|---|---|
| CZT HV Monitor | 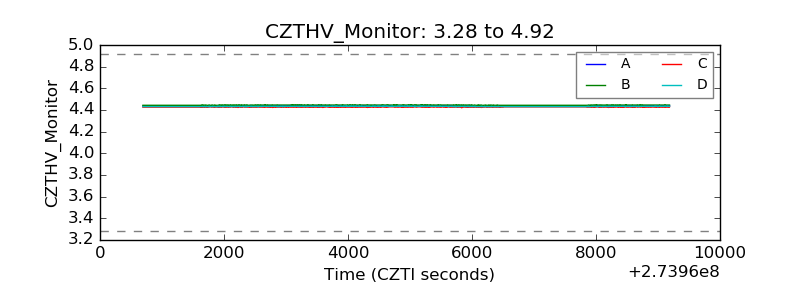 |
| D_VDD | 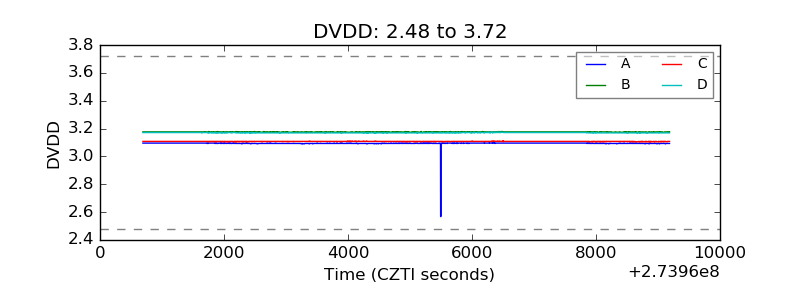 |
| Temperature 1 | 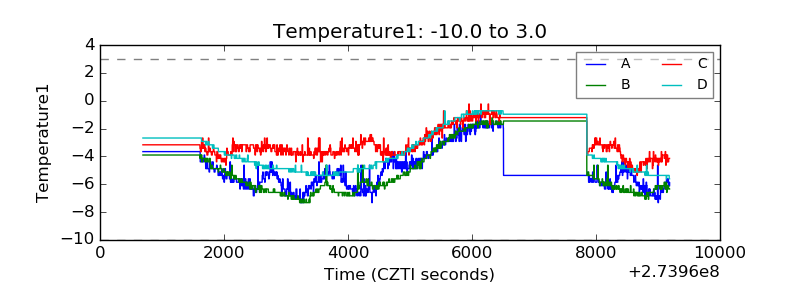 |
| Veto HV Monitor | 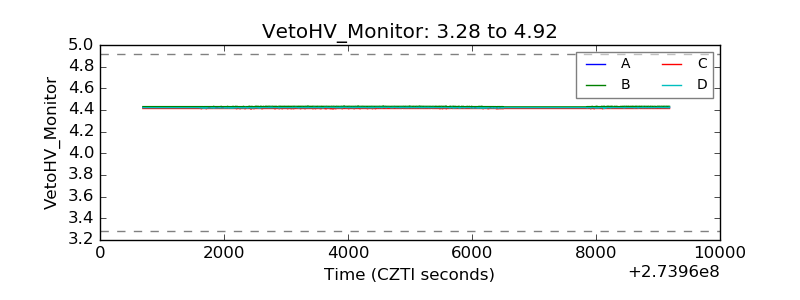 |
| Veto LLD | 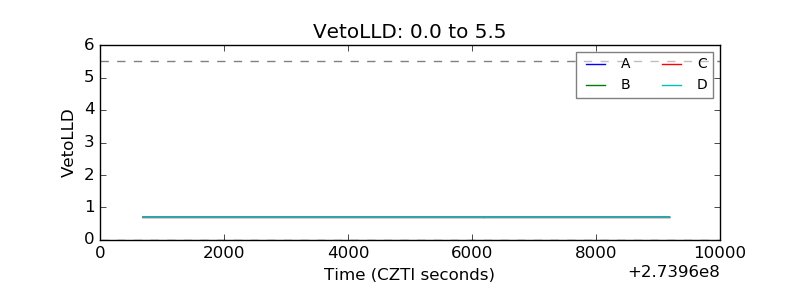 |
| Alpha Counter | 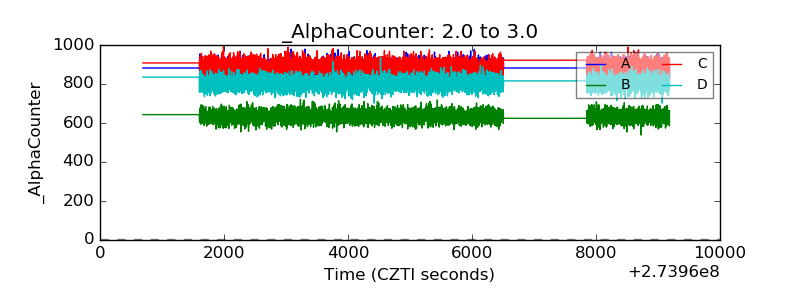 |
| _CPM_Rate | 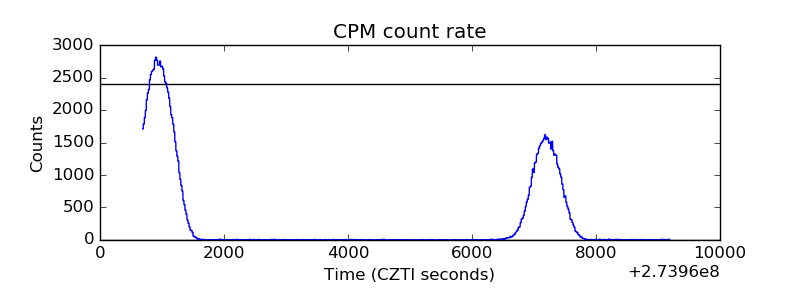 |
| CZT Counter | 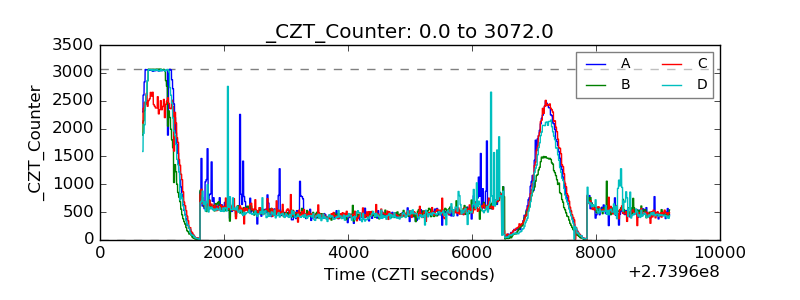 |
| +2.5 Volts monitor | 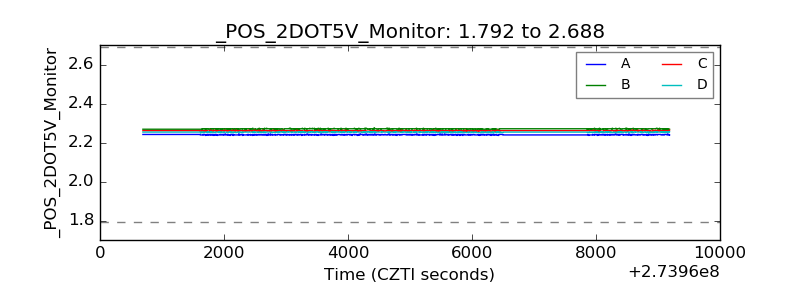 |
| +5 Volts monitor | 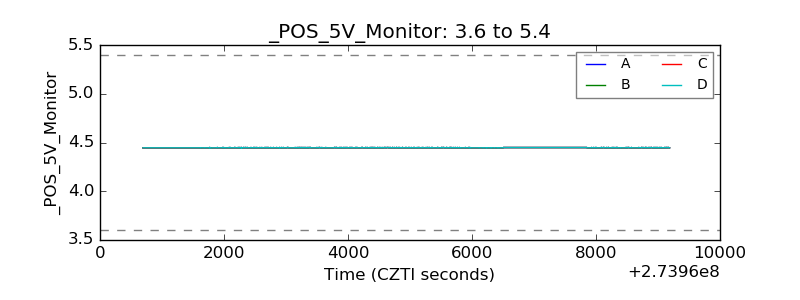 |
| _ROLL_ROT | 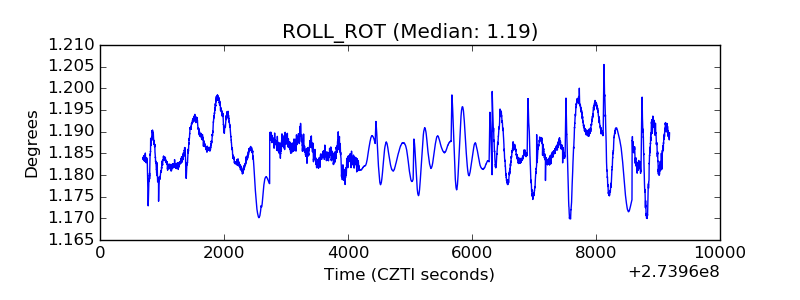 |
| _Roll_DEC | 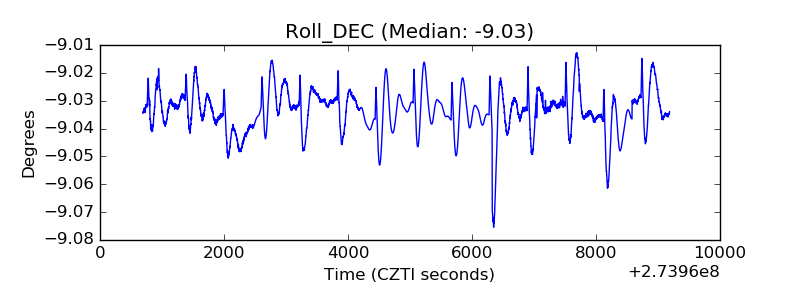 |
| _Roll_RA | 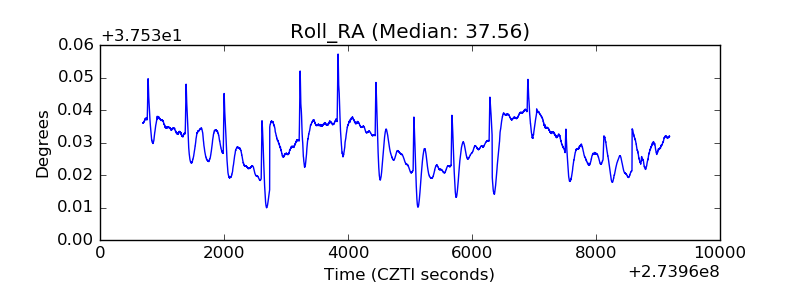 |
| Veto Counter | 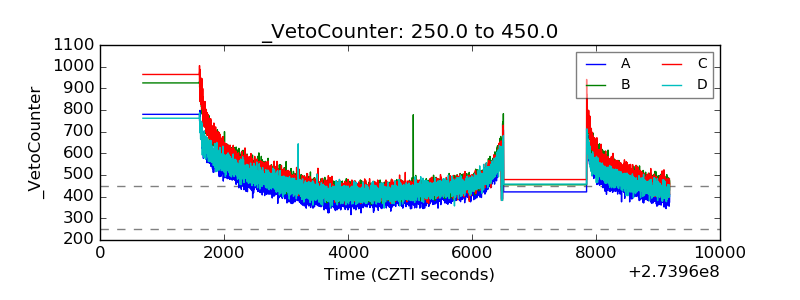 |