| Param | Original file | Final file |
|---|---|---|
| Filename | modeM0/AS1A04_143T01_9000002344_15909cztM0_level2.evt | modeM0/AS1A04_143T01_9000002344_15909cztM0_level2_quad_clean.evt |
| Size (bytes) | 471,723,840 | 96,549,120 |
| Size | 449.9 MB | 92.1 MB |
| Events in quadrant A | 3,684,347 | 616,264 |
| Events in quadrant B | 3,423,052 | 643,343 |
| Events in quadrant C | 3,380,545 | 606,871 |
| Events in quadrant D | 3,344,352 | 591,669 |
| Mode SS | |||
|---|---|---|---|
| Quadrant | BADHDUFLAG | Total packets | Discarded packets |
| A | 0 | 140 | 0 |
| B | 0 | 140 | 0 |
| C | 0 | 140 | 0 |
| D | 0 | 140 | 0 |
| Mode M0 | |||
|---|---|---|---|
| Quadrant | BADHDUFLAG | Total packets | Discarded packets |
| A | 0 | 15289 | 3 |
| B | 0 | 14449 | 2 |
| C | 0 | 14199 | 2 |
| D | 0 | 14581 | 2 |
| Mode M9 | |||
|---|---|---|---|
| Quadrant | BADHDUFLAG | Total packets | Discarded packets |
| A | 0 | 25 | 0 |
| B | 0 | 25 | 0 |
| C | 0 | 25 | 0 |
| D | 0 | 25 | 0 |
| Quadrant | Total seconds | Saturated seconds | Saturation percentage |
|---|---|---|---|
| A | 6681 | 131 | 1.960784% |
| B | 6681 | 99 | 1.481814% |
| C | 6681 | 105 | 1.571621% |
| D | 6681 | 67 | 1.002844% |
Noise dominated data is calculated using 1-second bins in cleaned event files. If a bin has >2000 counts, and if more than 50% of those come from <1% of pixels, then it is considered to be noise-dominated and hence unusable.
| Quadrant | # 1 sec bins | Bins with >0 counts | Bins with >2000 counts | High rate bins dominated by noise | Noise dominated (total time) | Noise dominated (detector-on time) | Marked lightcurve |
|---|---|---|---|---|---|---|---|
| A | 9163 | 6685 | 29 | 29 | 0.32% | 0.43% | 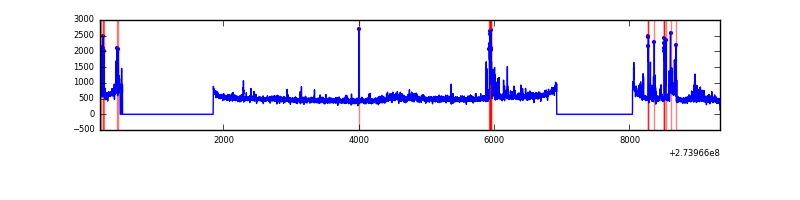 |
| B | 9163 | 6685 | 4 | 4 | 0.04% | 0.06% | 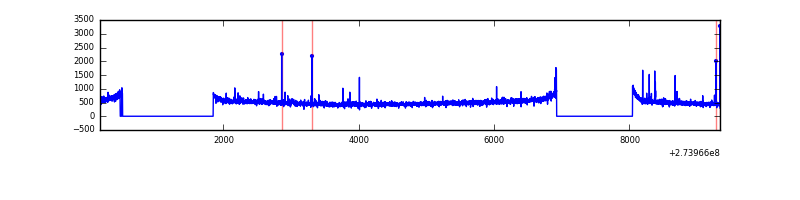 |
| C | 9163 | 6685 | 0 | 0 | 0.00% | 0.00% | 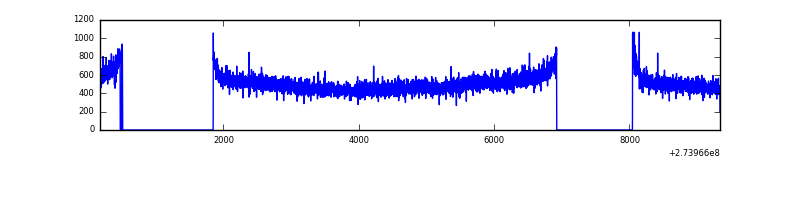 |
| D | 9163 | 6685 | 19 | 19 | 0.21% | 0.28% | 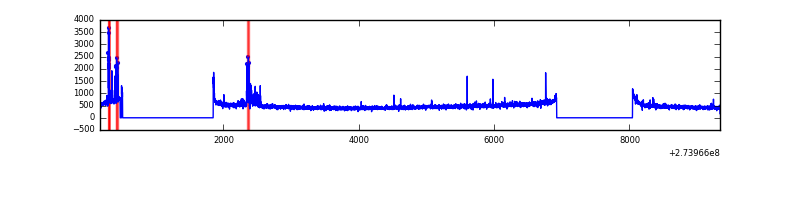 |
Top three noisy pixels from each quadrant. If the there are fewer than three noisy pixels in the level2.evt file, extra rows are filled as -1
| Pixel properties | Quadrant properties | ||||||
|---|---|---|---|---|---|---|---|
| Quadrant | DetID | PixID | Counts | Sigma | Mean | Median | Sigma |
| A | 15 | 239 | 336332 | 1967.56 | 846 | 827 | 170.5 |
| A | 3 | 80 | 52737 | 304.42 | 846 | 827 | 170.5 |
| A | 15 | 157 | 32436 | 185.37 | 846 | 827 | 170.5 |
| B | 4 | 173 | 35785 | 214.02 | 856 | 836 | 163.3 |
| B | 12 | 111 | 19097 | 111.83 | 856 | 836 | 163.3 |
| B | 11 | 111 | 15916 | 92.35 | 856 | 836 | 163.3 |
| C | 14 | 238 | 125365 | 649.19 | 820 | 828 | 191.8 |
| C | 3 | 233 | 52037 | 266.94 | 820 | 828 | 191.8 |
| C | 7 | 247 | 5986 | 26.89 | 820 | 828 | 191.8 |
| D | 12 | 17 | 122582 | 602.31 | 825 | 802 | 202.2 |
| D | 13 | 172 | 41788 | 202.71 | 825 | 802 | 202.2 |
| D | 1 | 52 | 32887 | 158.69 | 825 | 802 | 202.2 |
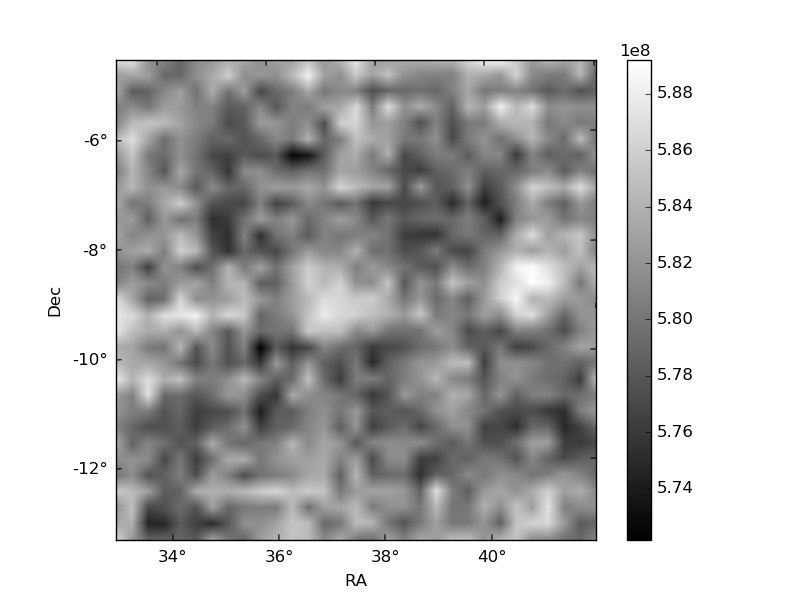
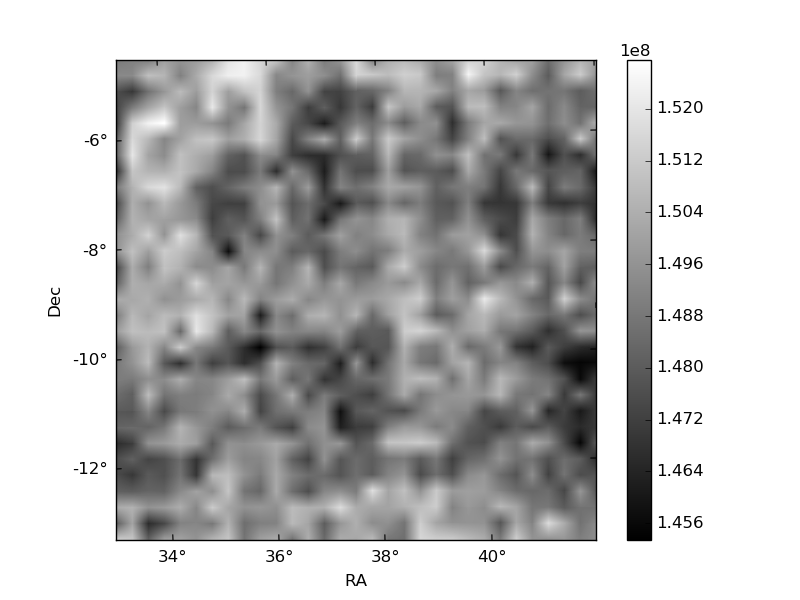
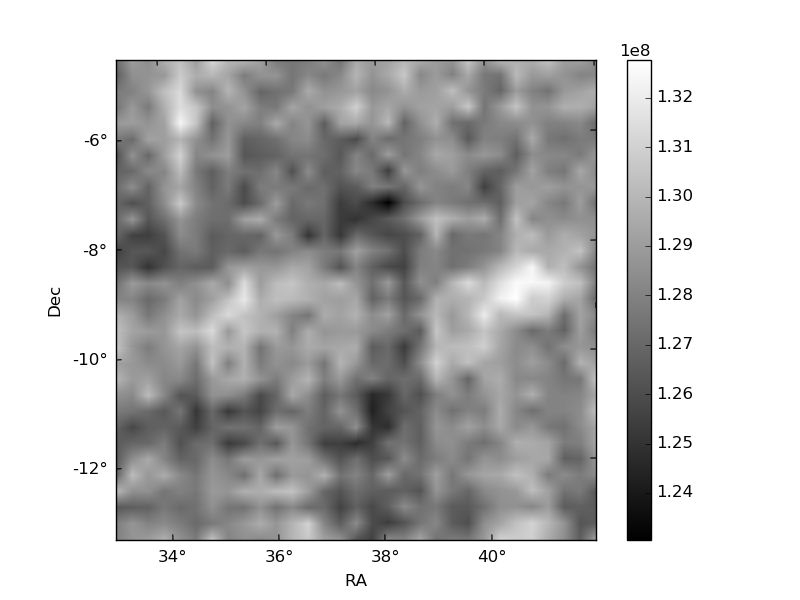
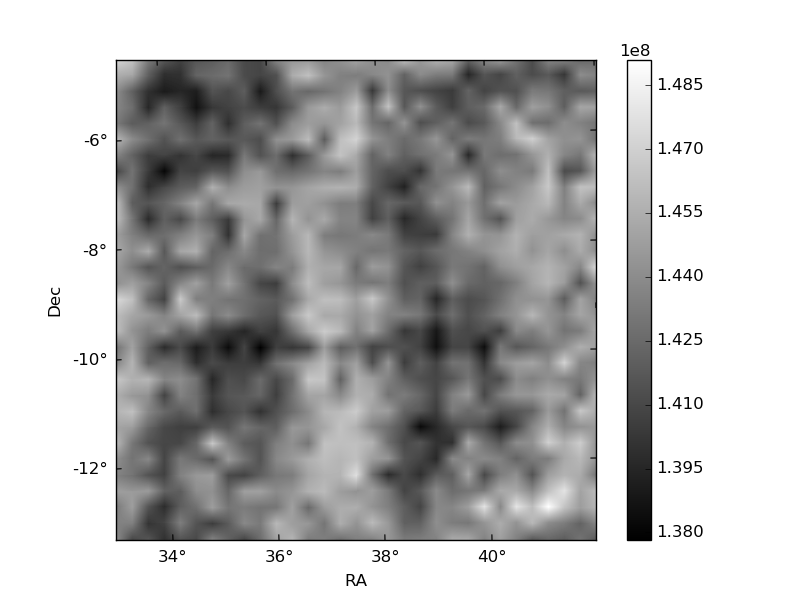
Histogram calculated using DETX and DETY for each event in the final _common_clean file
| Quadrant A | 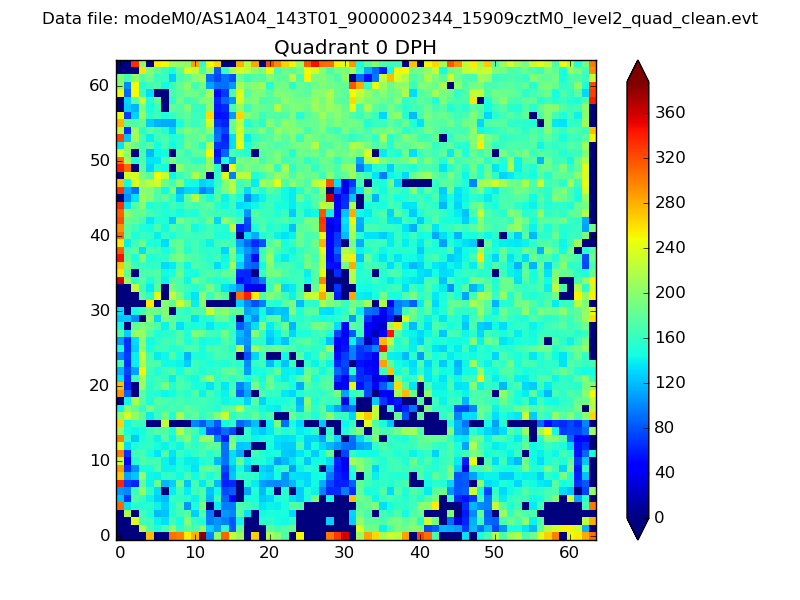 |
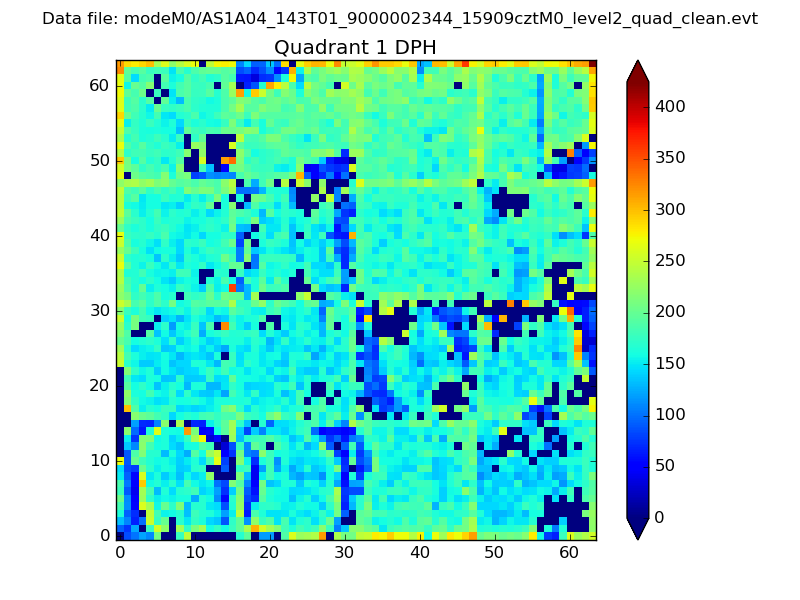 |
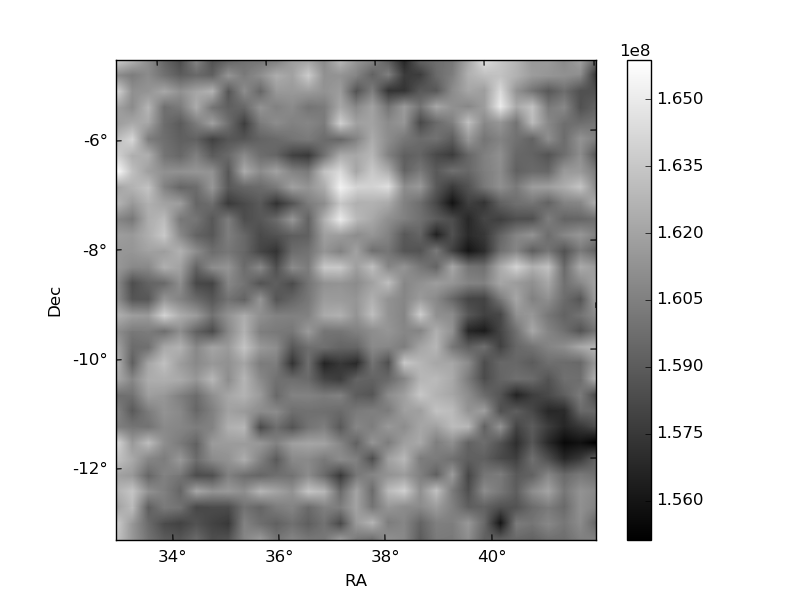
Quadrant B |
|---|---|---|---|
| Quadrant D | 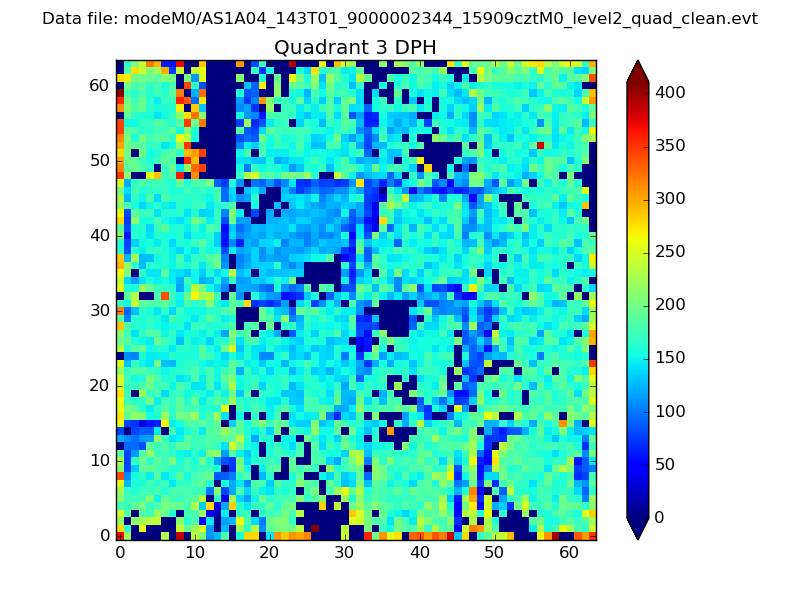 |
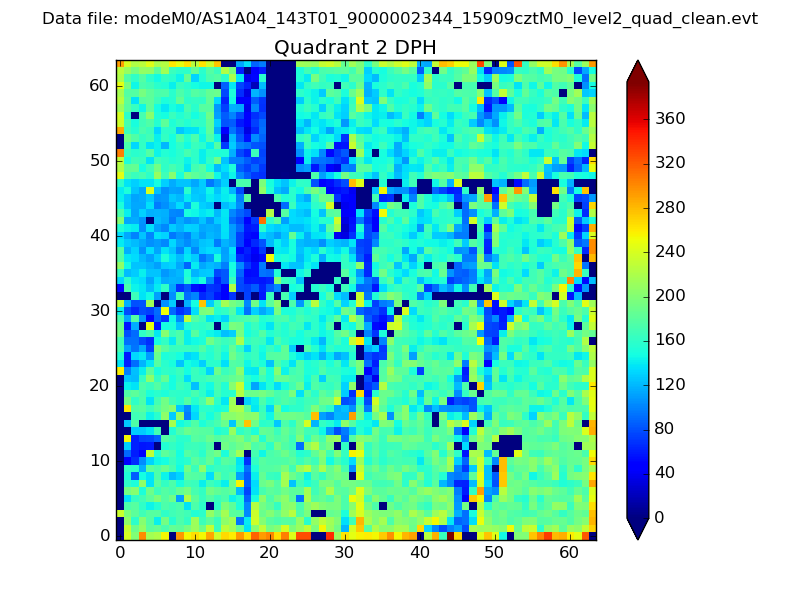 |
Quadrant C |
| Plot type | Count rate plots | Images |
|---|---|---|
| Comparison with Poisson distribution Blue bars denote a histogram of data divided into 1 sec bins. Red curve is a Poisson curve with rate = median count rate of data. |
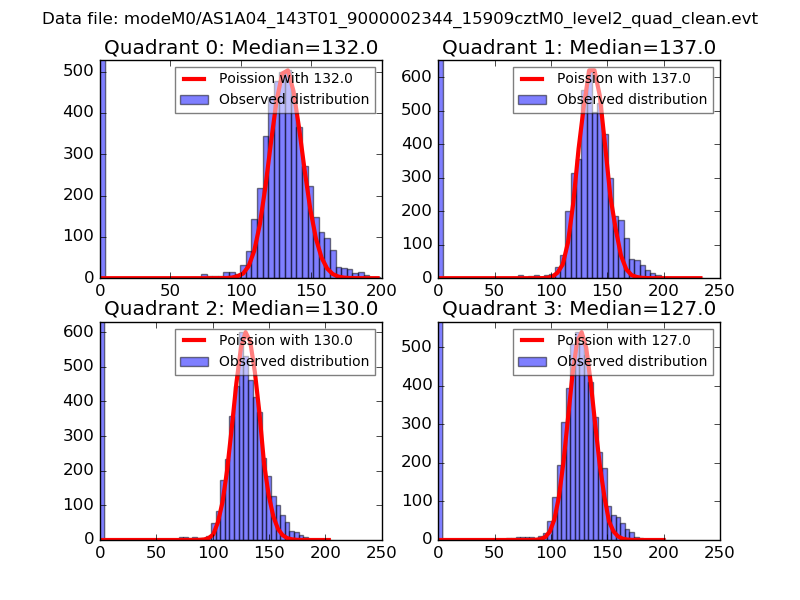 |
 |
| Quadrant-wise count rates Data is divided into 100 sec bins |
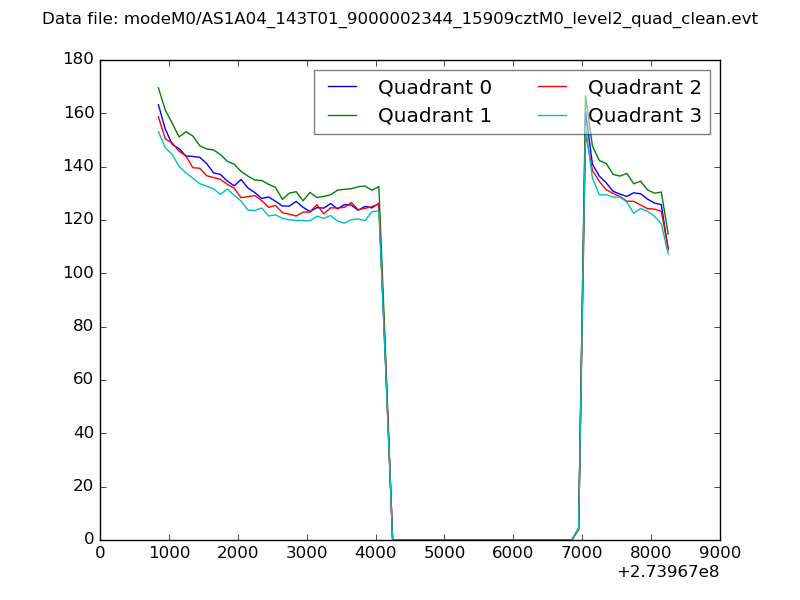 |
|
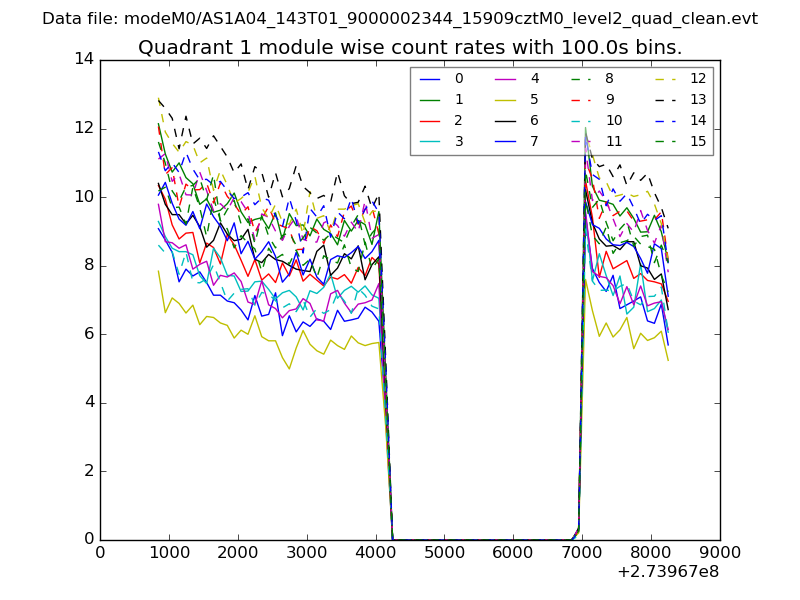
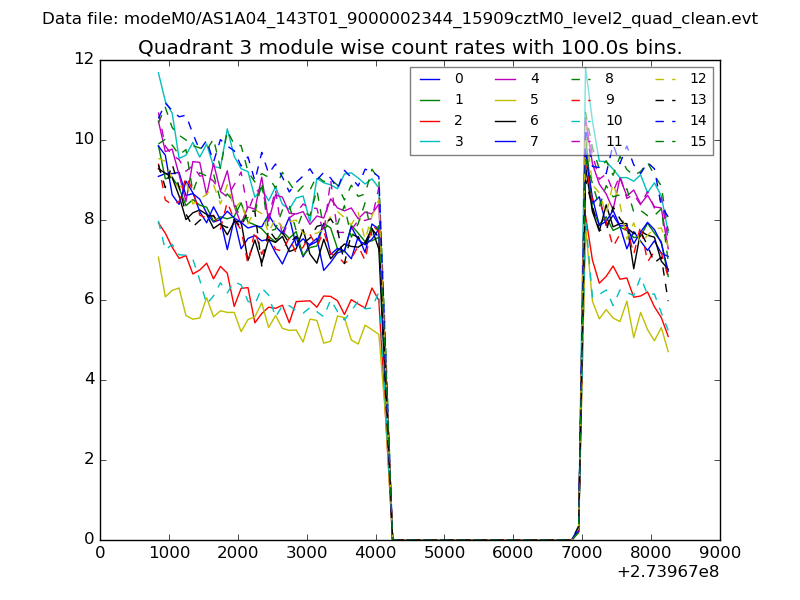
| Module-wise count rates for Quadrant A Data is divided into 100 sec bins |
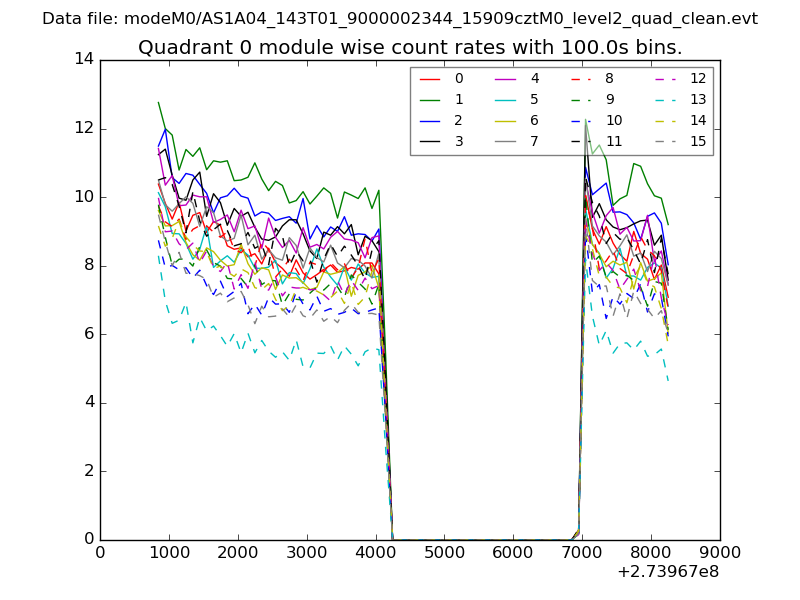 |
 |
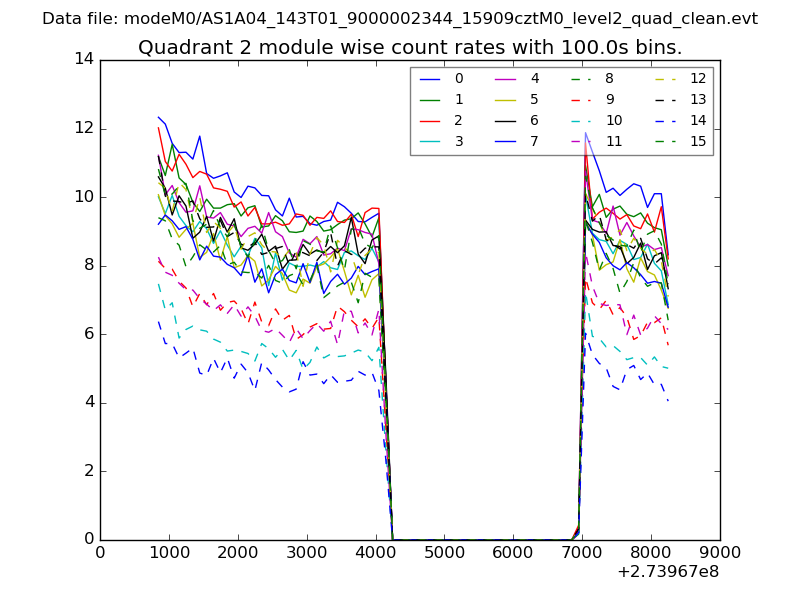
| Module-wise count rates for Quadrant B Data is divided into 100 sec bins |
 |
 |
| Module-wise count rates for Quadrant C Data is divided into 100 sec bins |
 |
 |
| Module-wise count rates for Quadrant D Data is divided into 100 sec bins |
 |
 |
| Parameter | Plot |
|---|---|
| CZT HV Monitor | 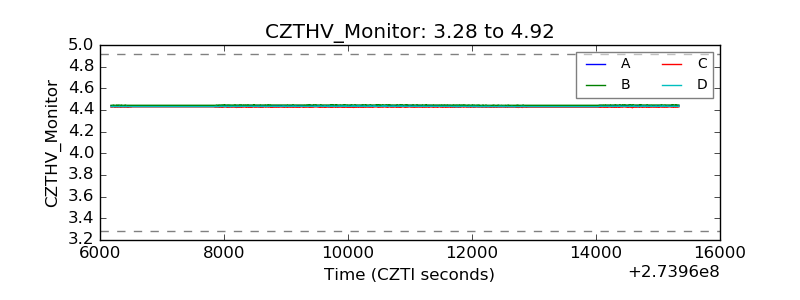 |
| D_VDD | 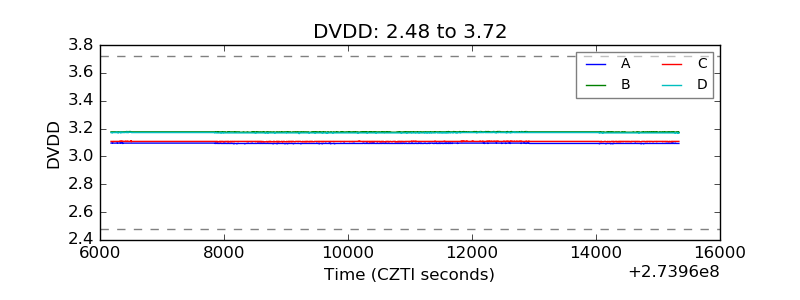 |
| Temperature 1 |  |
| Veto HV Monitor | 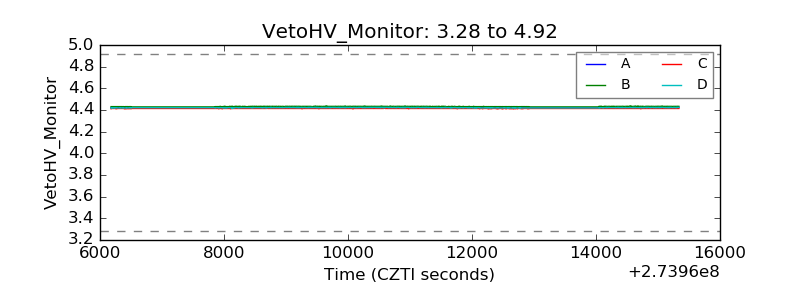 |
| Veto LLD | 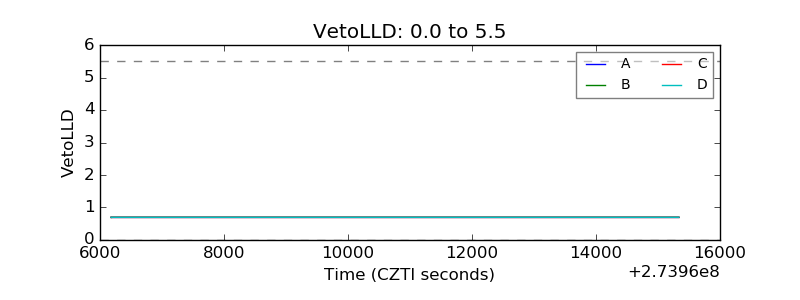 |
| Alpha Counter | 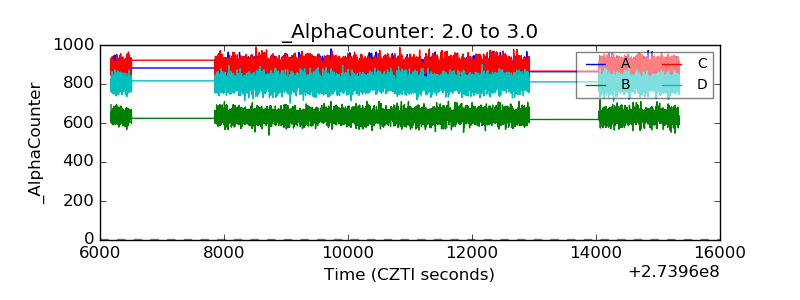 |
| _CPM_Rate | 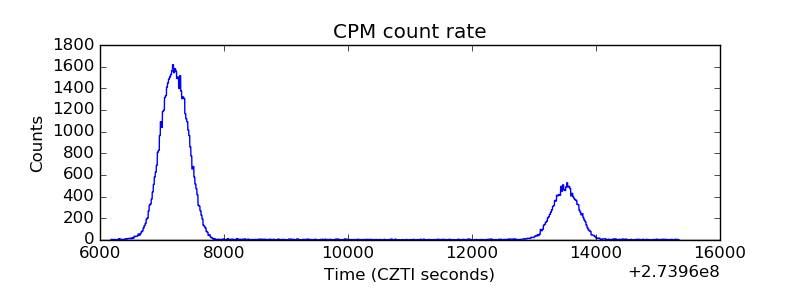 |
| CZT Counter | 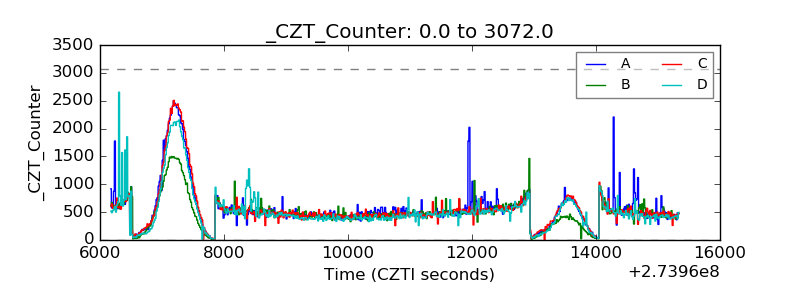 |
| +2.5 Volts monitor |  |
| +5 Volts monitor |  |
| _ROLL_ROT | 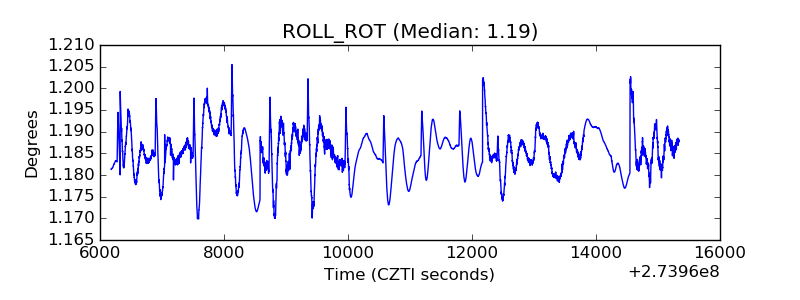 |
| _Roll_DEC |  |
| _Roll_RA | 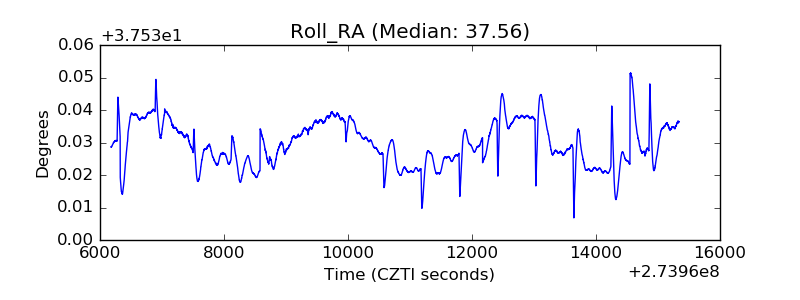 |
| Veto Counter | 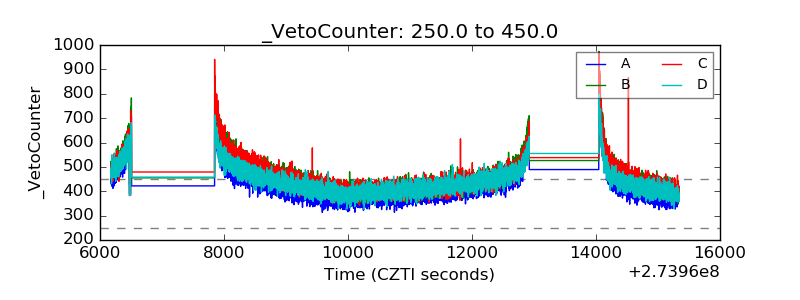 |