| Param | Original file | Final file |
|---|---|---|
| Filename | modeM0/AS1A04_143T01_9000002344_15910cztM0_level2.evt | modeM0/AS1A04_143T01_9000002344_15910cztM0_level2_quad_clean.evt |
| Size (bytes) | 495,423,360 | 100,563,840 |
| Size | 472.5 MB | 95.9 MB |
| Events in quadrant A | 3,875,397 | 635,587 |
| Events in quadrant B | 3,705,328 | 660,599 |
| Events in quadrant C | 3,543,934 | 624,355 |
| Events in quadrant D | 3,381,024 | 614,316 |
| Mode SS | |||
|---|---|---|---|
| Quadrant | BADHDUFLAG | Total packets | Discarded packets |
| A | 0 | 150 | 0 |
| B | 0 | 150 | 0 |
| C | 0 | 150 | 0 |
| D | 0 | 150 | 0 |
| Mode M0 | |||
|---|---|---|---|
| Quadrant | BADHDUFLAG | Total packets | Discarded packets |
| A | 0 | 16275 | 3 |
| B | 0 | 15856 | 2 |
| C | 0 | 15179 | 2 |
| D | 0 | 15235 | 2 |
| Mode M9 | |||
|---|---|---|---|
| Quadrant | BADHDUFLAG | Total packets | Discarded packets |
| A | 0 | 13 | 0 |
| B | 0 | 13 | 0 |
| C | 0 | 13 | 0 |
| D | 0 | 14 | 0 |
| Quadrant | Total seconds | Saturated seconds | Saturation percentage |
|---|---|---|---|
| A | 7331 | 102 | 1.391352% |
| B | 7331 | 98 | 1.336789% |
| C | 7331 | 107 | 1.459555% |
| D | 7331 | 40 | 0.545628% |
Noise dominated data is calculated using 1-second bins in cleaned event files. If a bin has >2000 counts, and if more than 50% of those come from <1% of pixels, then it is considered to be noise-dominated and hence unusable.
| Quadrant | # 1 sec bins | Bins with >0 counts | Bins with >2000 counts | High rate bins dominated by noise | Noise dominated (total time) | Noise dominated (detector-on time) | Marked lightcurve |
|---|---|---|---|---|---|---|---|
| A | 8067 | 7333 | 39 | 39 | 0.48% | 0.53% | 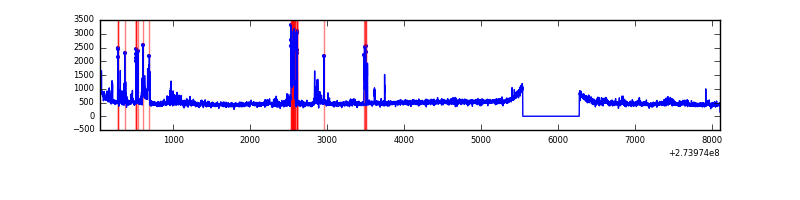 |
| B | 8067 | 7333 | 6 | 6 | 0.07% | 0.08% | 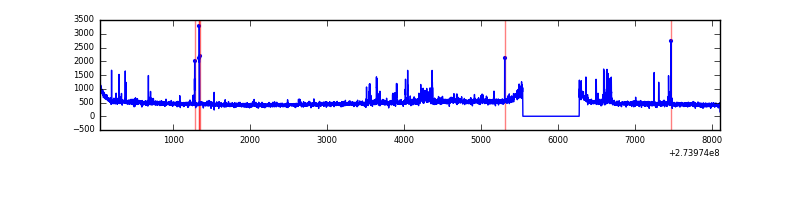 |
| C | 8067 | 7333 | 0 | 0 | 0.00% | 0.00% | 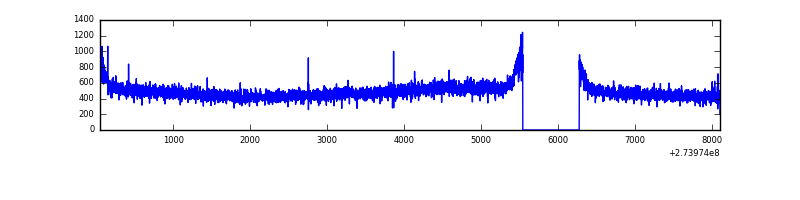 |
| D | 8067 | 7333 | 4 | 4 | 0.05% | 0.05% | 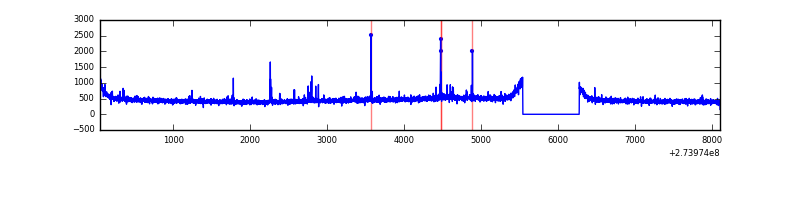 |
Top three noisy pixels from each quadrant. If the there are fewer than three noisy pixels in the level2.evt file, extra rows are filled as -1
| Pixel properties | Quadrant properties | ||||||
|---|---|---|---|---|---|---|---|
| Quadrant | DetID | PixID | Counts | Sigma | Mean | Median | Sigma |
| A | 15 | 239 | 441958 | 2449.82 | 889 | 870 | 180.0 |
| A | 9 | 143 | 17336 | 91.45 | 889 | 870 | 180.0 |
| A | 0 | 226 | 7867 | 38.86 | 889 | 870 | 180.0 |
| B | 4 | 173 | 84677 | 482.94 | 897 | 874 | 173.5 |
| B | 0 | 229 | 66218 | 376.56 | 897 | 874 | 173.5 |
| B | 12 | 111 | 20244 | 111.62 | 897 | 874 | 173.5 |
| C | 14 | 238 | 133919 | 653.66 | 862 | 868 | 203.5 |
| C | 3 | 233 | 45518 | 219.36 | 862 | 868 | 203.5 |
| C | 13 | 61 | 6028 | 25.35 | 862 | 868 | 203.5 |
| D | 12 | 17 | 37186 | 169.47 | 870 | 845 | 214.4 |
| D | 2 | 234 | 36076 | 164.29 | 870 | 845 | 214.4 |
| D | 1 | 52 | 20241 | 90.45 | 870 | 845 | 214.4 |
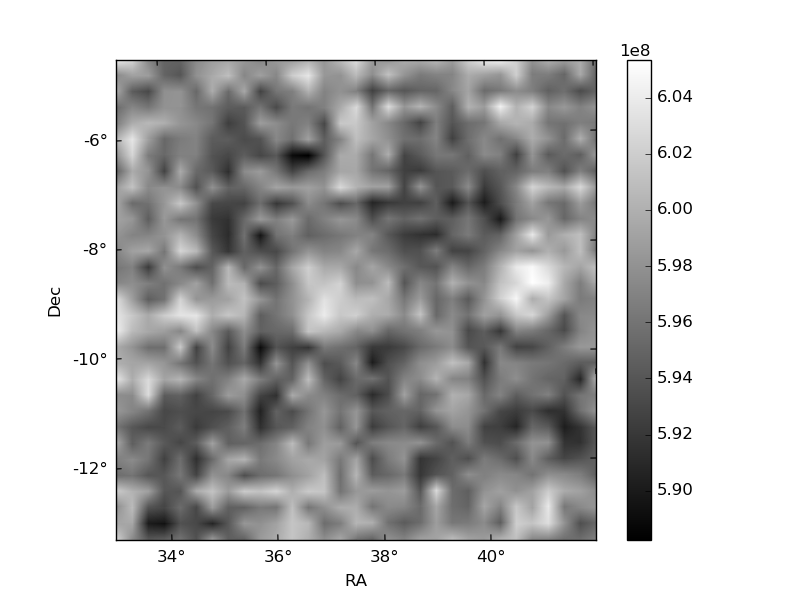
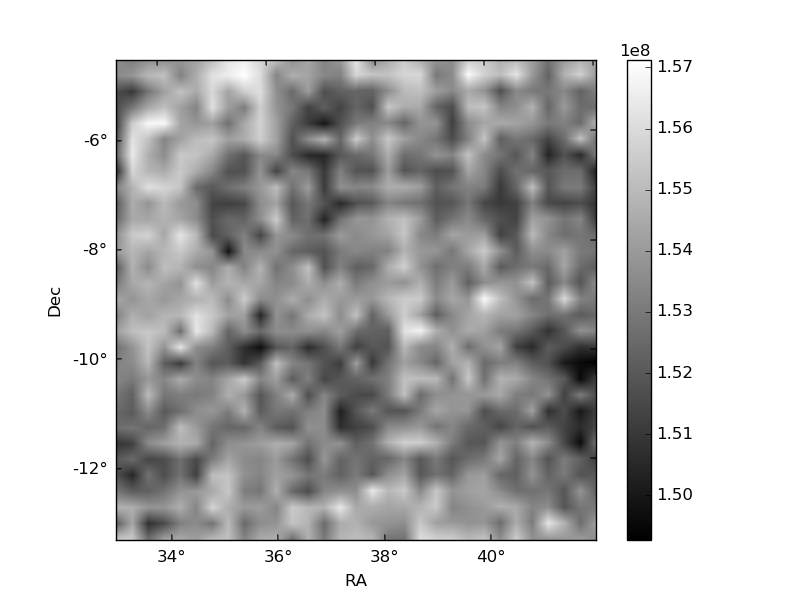
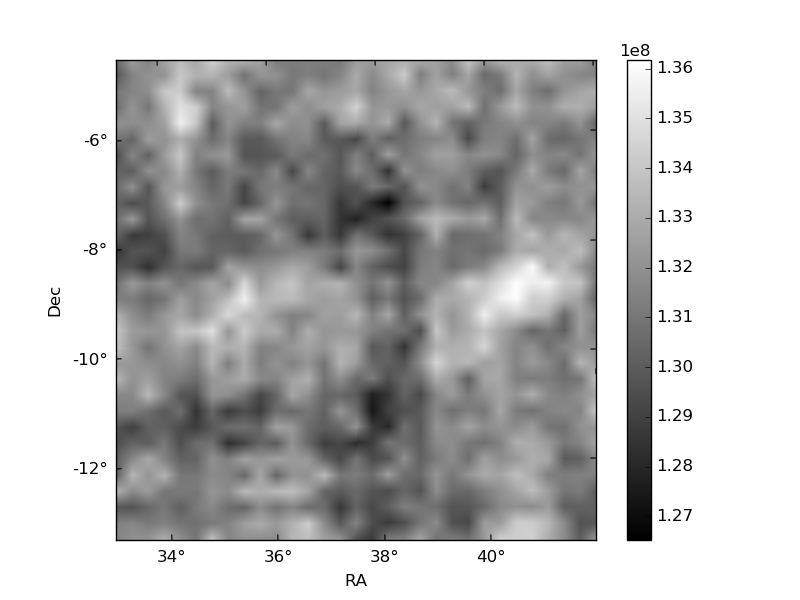
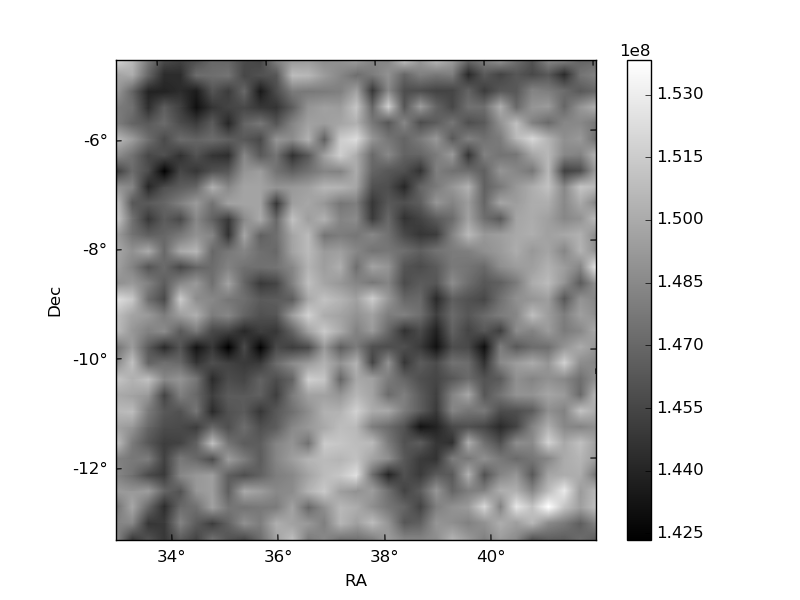
Histogram calculated using DETX and DETY for each event in the final _common_clean file
| Quadrant A | 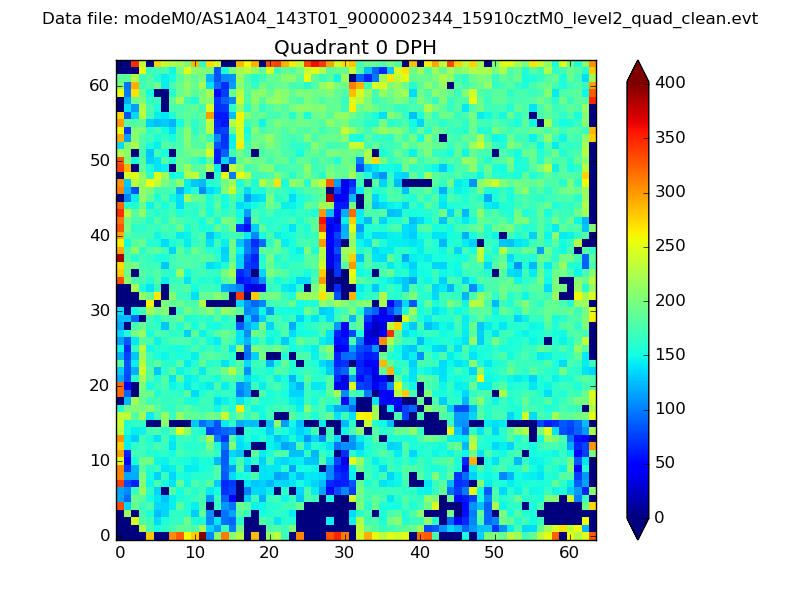 |
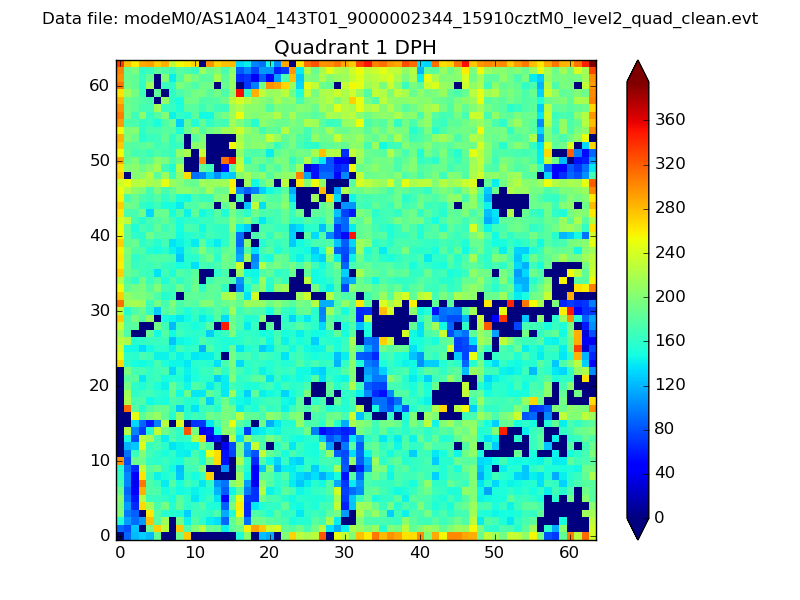 |
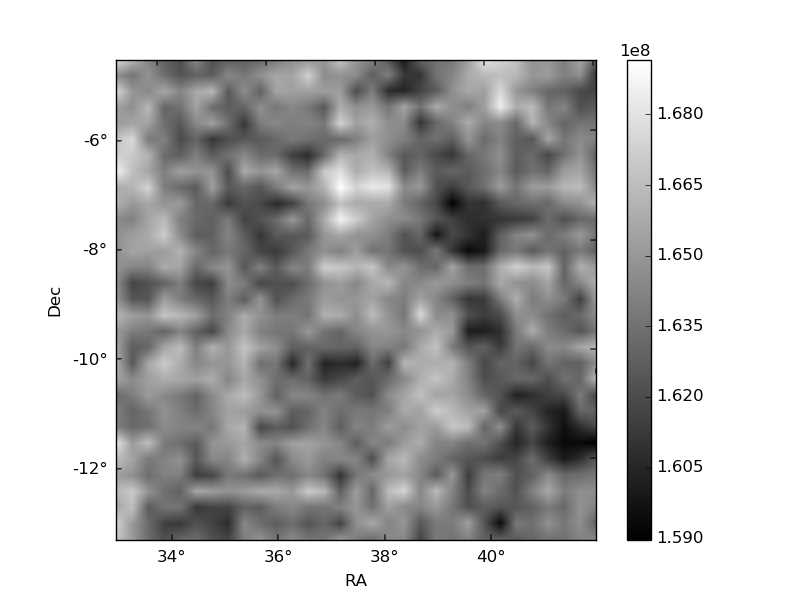
Quadrant B |
|---|---|---|---|
| Quadrant D | 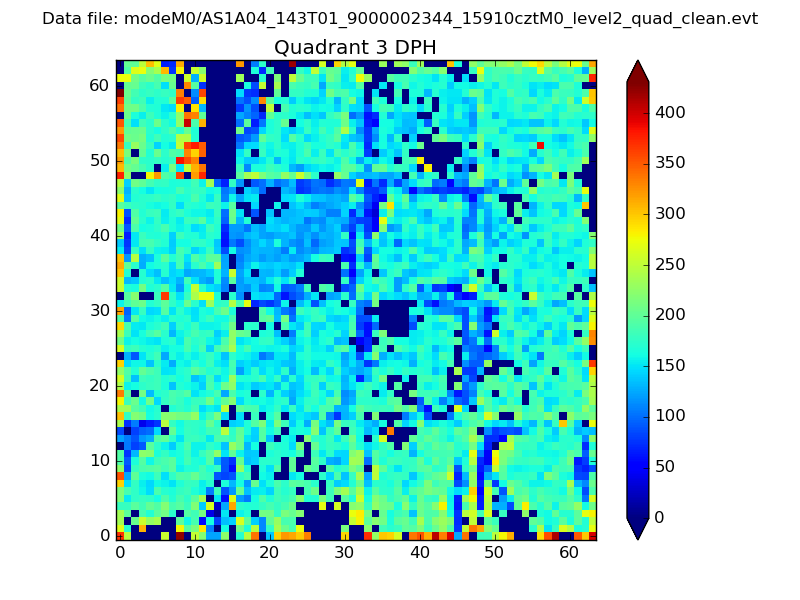 |
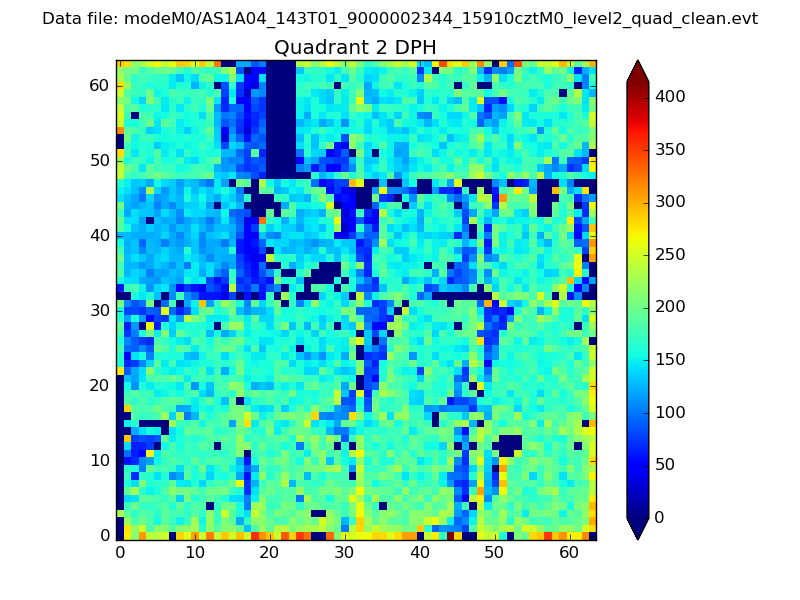 |
Quadrant C |
| Plot type | Count rate plots | Images |
|---|---|---|
| Comparison with Poisson distribution Blue bars denote a histogram of data divided into 1 sec bins. Red curve is a Poisson curve with rate = median count rate of data. |
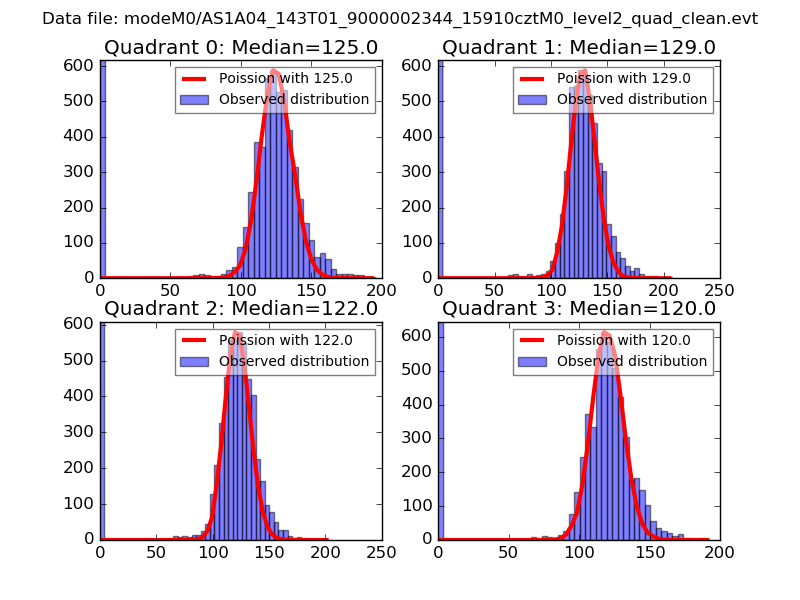 |
 |
| Quadrant-wise count rates Data is divided into 100 sec bins |
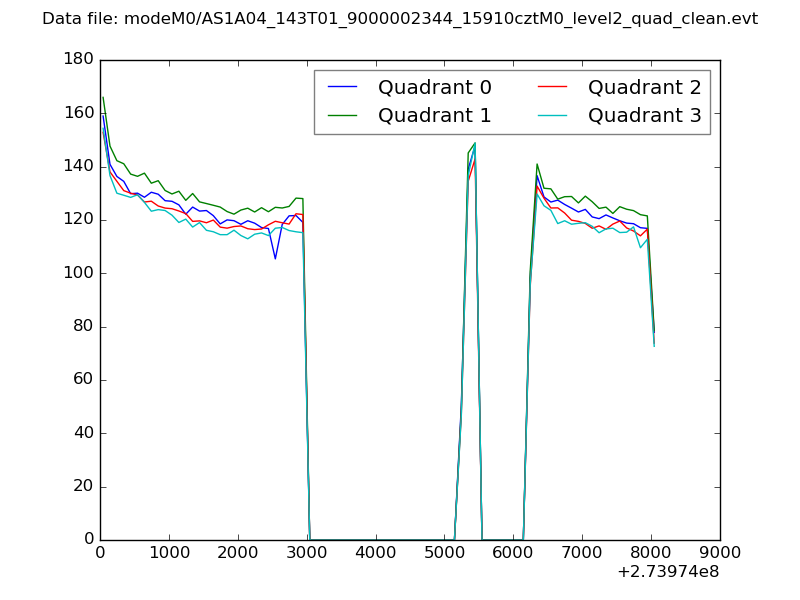 |
|
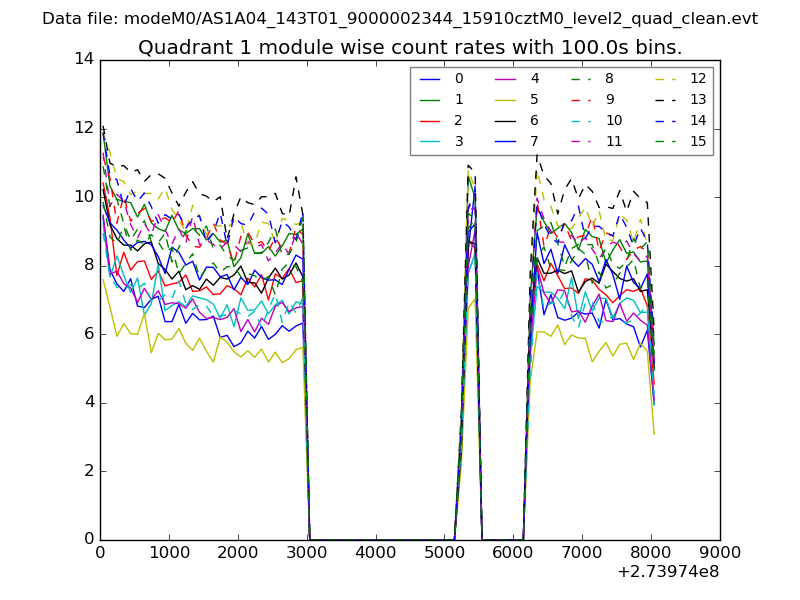
| Module-wise count rates for Quadrant A Data is divided into 100 sec bins |
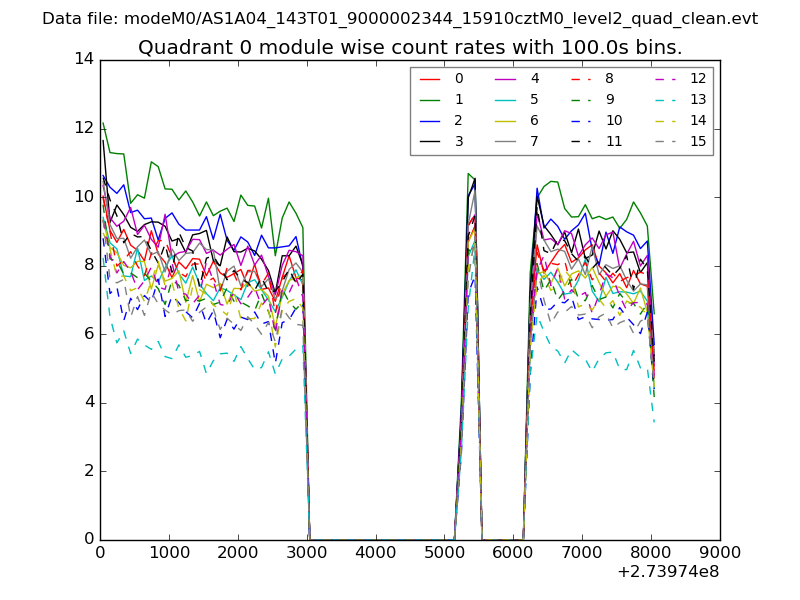 |
 |
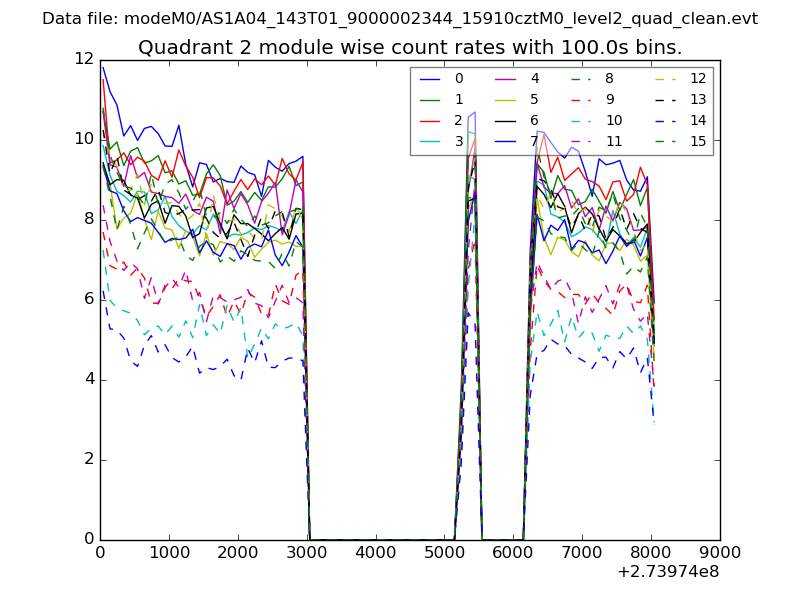
| Module-wise count rates for Quadrant B Data is divided into 100 sec bins |
 |
 |
| Module-wise count rates for Quadrant C Data is divided into 100 sec bins |
 |
 |
| Module-wise count rates for Quadrant D Data is divided into 100 sec bins |
 |
 |
| Parameter | Plot |
|---|---|
| CZT HV Monitor | 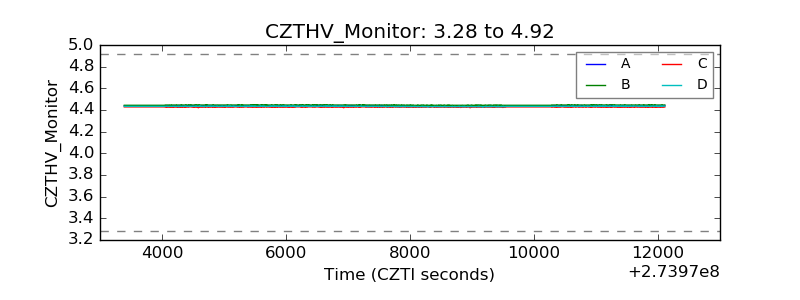 |
| D_VDD |  |
| Temperature 1 | 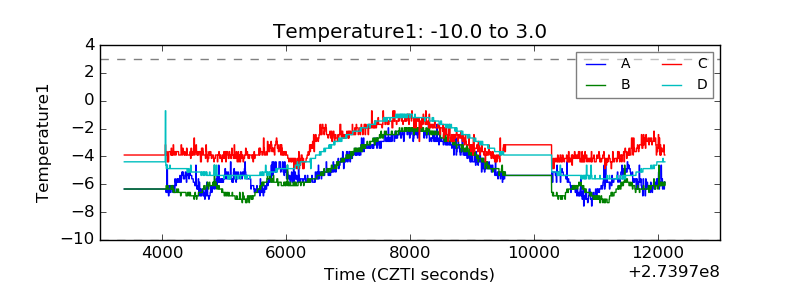 |
| Veto HV Monitor | 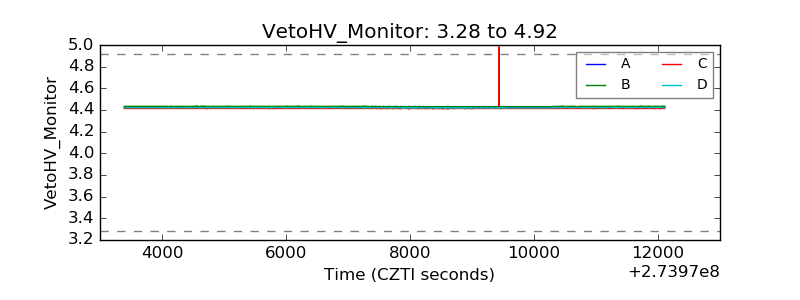 |
| Veto LLD | 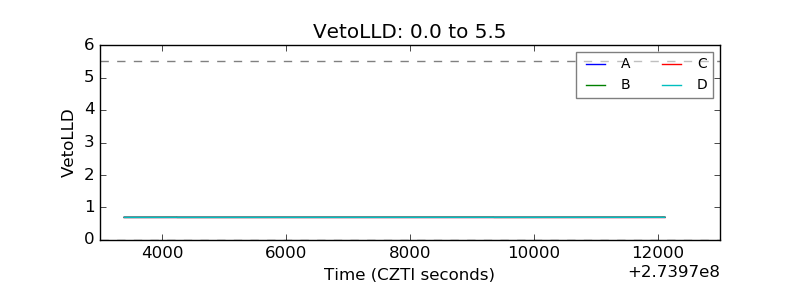 |
| Alpha Counter | 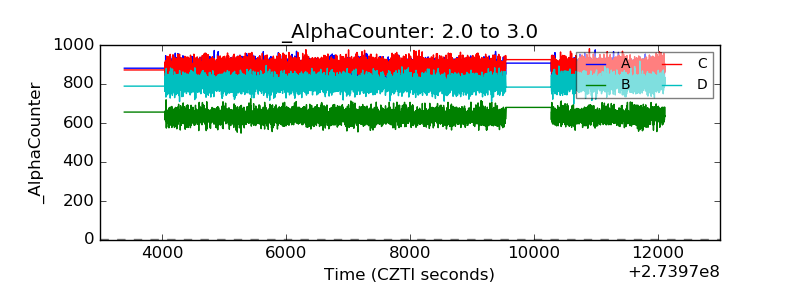 |
| _CPM_Rate | 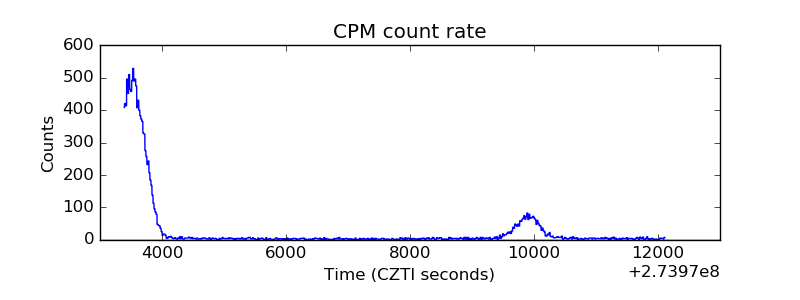 |
| CZT Counter | 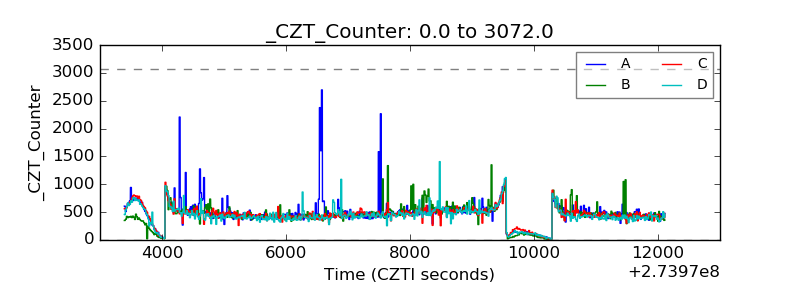 |
| +2.5 Volts monitor |  |
| +5 Volts monitor | 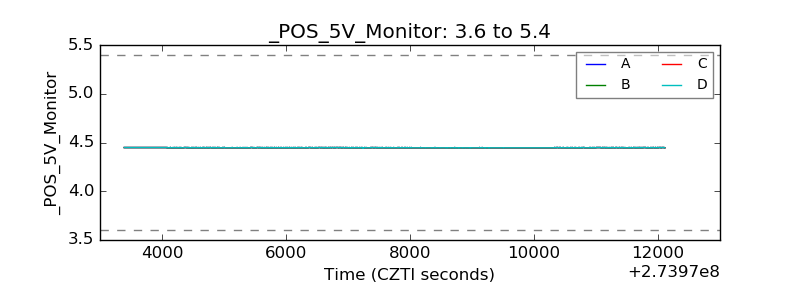 |
| _ROLL_ROT | 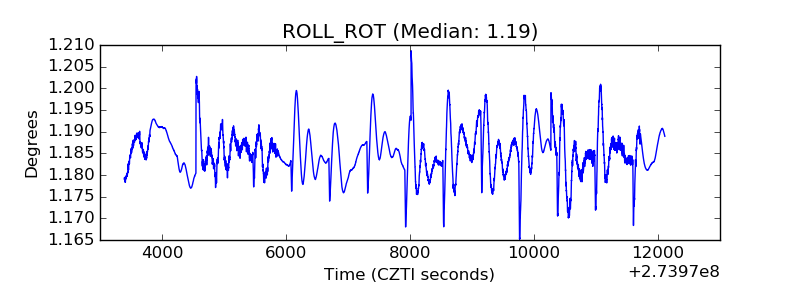 |
| _Roll_DEC |  |
| _Roll_RA | 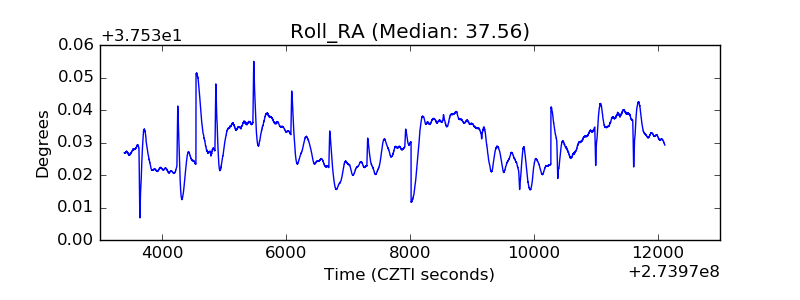 |
| Veto Counter | 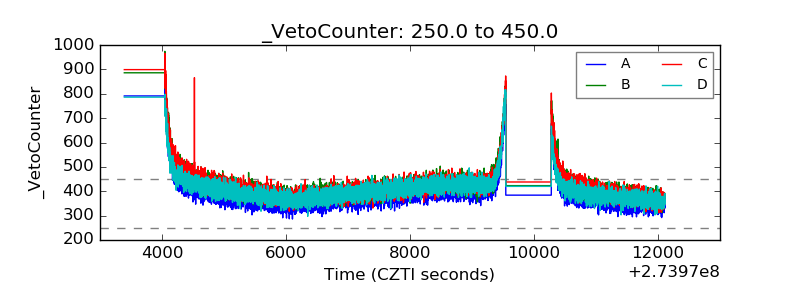 |