| Param | Original file | Final file |
|---|---|---|
| Filename | modeM0/AS1A04_143T01_9000002344_15912cztM0_level2.evt | modeM0/AS1A04_143T01_9000002344_15912cztM0_level2_quad_clean.evt |
| Size (bytes) | 688,559,040 | 116,922,240 |
| Size | 656.7 MB | 111.5 MB |
| Events in quadrant A | 5,634,373 | 710,233 |
| Events in quadrant B | 5,072,672 | 738,886 |
| Events in quadrant C | 4,759,544 | 702,281 |
| Events in quadrant D | 4,701,096 | 689,092 |
| Mode SS | |||
|---|---|---|---|
| Quadrant | BADHDUFLAG | Total packets | Discarded packets |
| A | 0 | 225 | 21 |
| B | 0 | 226 | 26 |
| C | 0 | 226 | 20 |
| D | 0 | 226 | 24 |
| Mode M0 | |||
|---|---|---|---|
| Quadrant | BADHDUFLAG | Total packets | Discarded packets |
| A | 0 | 25528 | 2320 |
| B | 0 | 23912 | 2237 |
| C | 0 | 22908 | 2204 |
| D | 0 | 23283 | 2158 |
| Mode M9 | |||
|---|---|---|---|
| Quadrant | BADHDUFLAG | Total packets | Discarded packets |
| A | 0 | 2 | 0 |
| B | 0 | 2 | 0 |
| C | 0 | 2 | 0 |
| D | 0 | 2 | 0 |
| Quadrant | Total seconds | Saturated seconds | Saturation percentage |
|---|---|---|---|
| A | 10094 | 218 | 2.159699% |
| B | 10110 | 206 | 2.037587% |
| C | 10103 | 170 | 1.682669% |
| D | 10125 | 143 | 1.412346% |
Noise dominated data is calculated using 1-second bins in cleaned event files. If a bin has >2000 counts, and if more than 50% of those come from <1% of pixels, then it is considered to be noise-dominated and hence unusable.
| Quadrant | # 1 sec bins | Bins with >0 counts | Bins with >2000 counts | High rate bins dominated by noise | Noise dominated (total time) | Noise dominated (detector-on time) | Marked lightcurve |
|---|---|---|---|---|---|---|---|
| A | 10875 | 10263 | 9 | 9 | 0.08% | 0.09% | 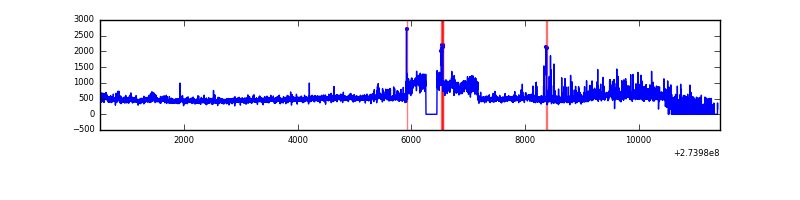 |
| B | 10882 | 10280 | 40 | 40 | 0.37% | 0.39% | 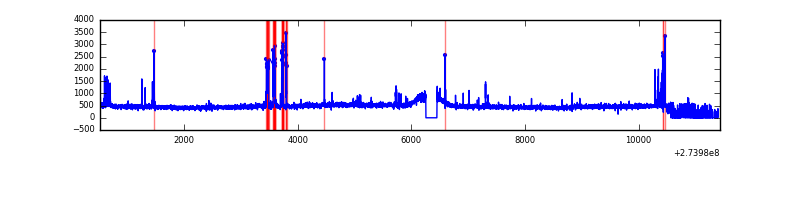 |
| C | 10917 | 10291 | 0 | 0 | 0.00% | 0.00% | 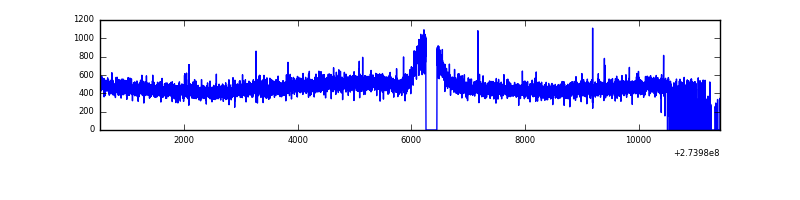 |
| D | 10899 | 10313 | 23 | 23 | 0.21% | 0.22% | 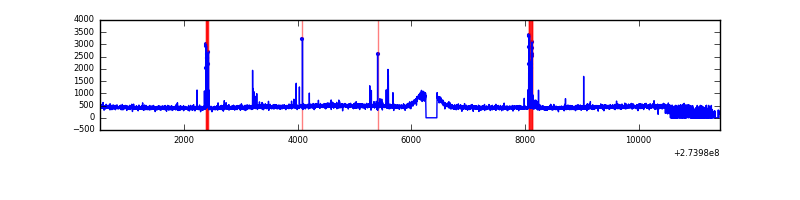 |
Top three noisy pixels from each quadrant. If the there are fewer than three noisy pixels in the level2.evt file, extra rows are filled as -1
| Pixel properties | Quadrant properties | ||||||
|---|---|---|---|---|---|---|---|
| Quadrant | DetID | PixID | Counts | Sigma | Mean | Median | Sigma |
| A | 15 | 239 | 1001198 | 4116.26 | 1202 | 1175 | 242.9 |
| A | 9 | 143 | 12662 | 47.28 | 1202 | 1175 | 242.9 |
| A | 0 | 226 | 10769 | 39.49 | 1202 | 1175 | 242.9 |
| B | 4 | 142 | 166830 | 710.31 | 1209 | 1178 | 233.2 |
| B | 4 | 173 | 73115 | 308.46 | 1209 | 1178 | 233.2 |
| B | 0 | 228 | 40519 | 168.69 | 1209 | 1178 | 233.2 |
| C | 14 | 238 | 178094 | 643.05 | 1164 | 1169 | 275.1 |
| C | 3 | 233 | 27112 | 94.29 | 1164 | 1169 | 275.1 |
| C | 13 | 61 | 8084 | 25.13 | 1164 | 1169 | 275.1 |
| D | 10 | 70 | 125362 | 427.6 | 1188 | 1154 | 290.5 |
| D | 2 | 234 | 48982 | 164.65 | 1188 | 1154 | 290.5 |
| D | 1 | 52 | 22402 | 73.15 | 1188 | 1154 | 290.5 |
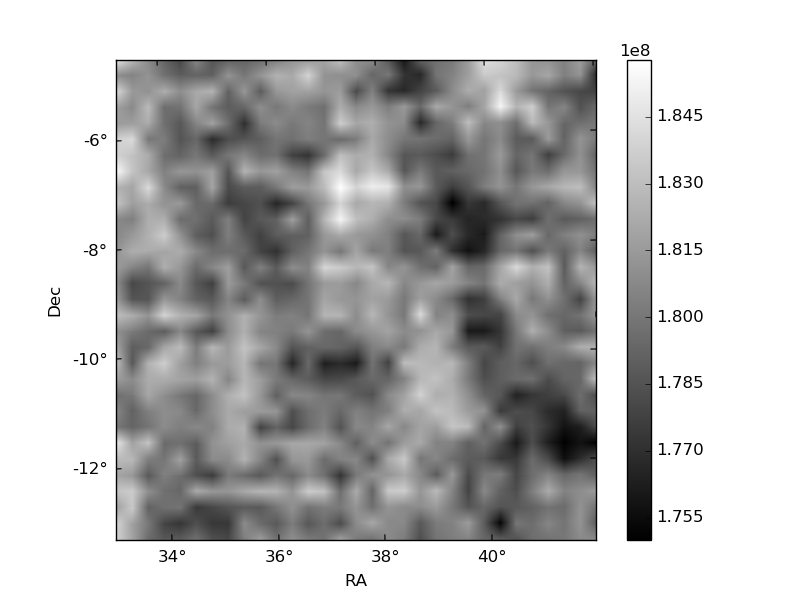
Histogram calculated using DETX and DETY for each event in the final _common_clean file
| Quadrant A | 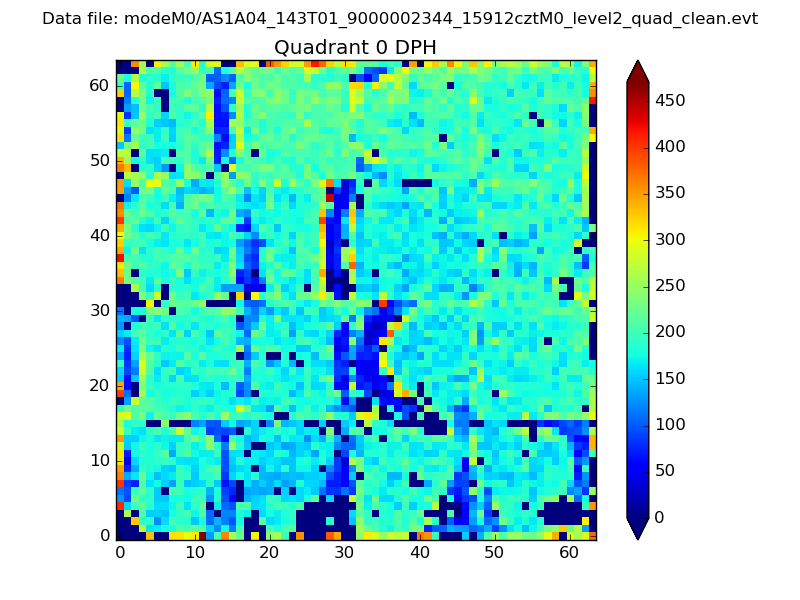 |
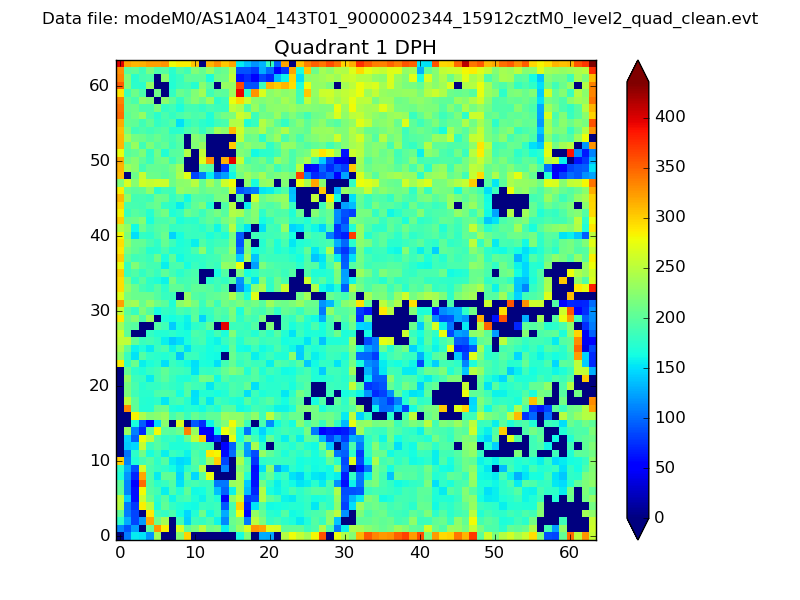 |
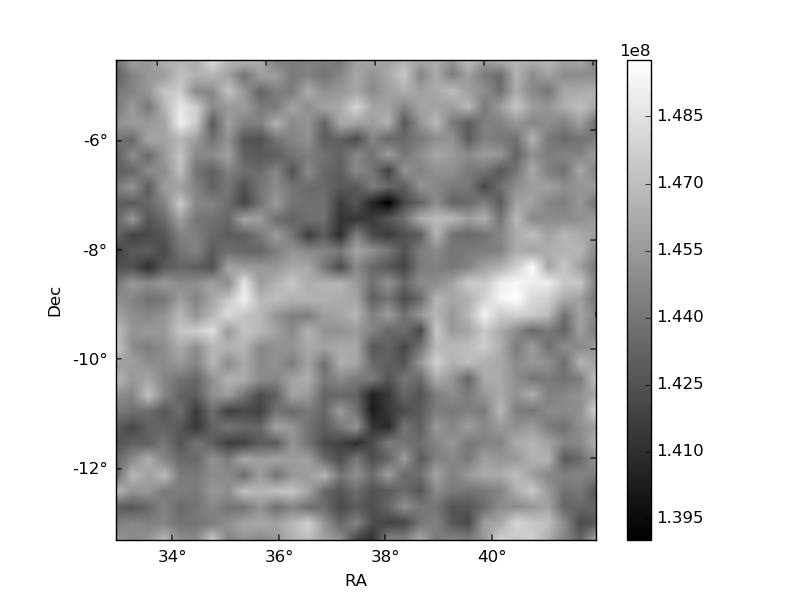
Quadrant B |
|---|---|---|---|
| Quadrant D | 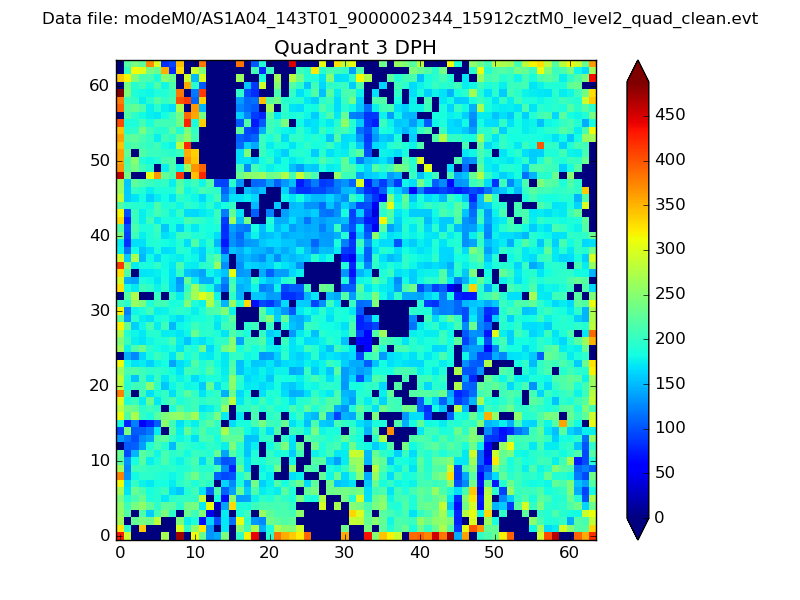 |
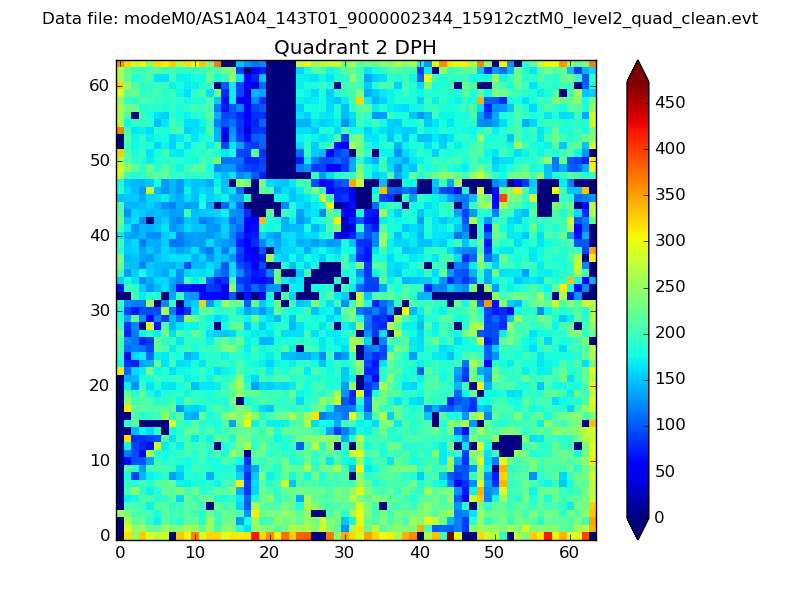 |
Quadrant C |
| Plot type | Count rate plots | Images |
|---|---|---|
| Comparison with Poisson distribution Blue bars denote a histogram of data divided into 1 sec bins. Red curve is a Poisson curve with rate = median count rate of data. |
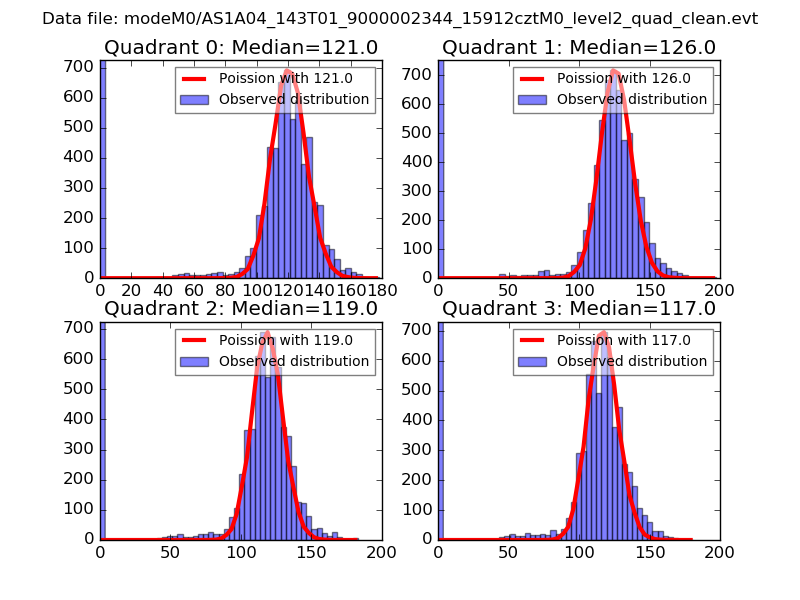 |
 |
| Quadrant-wise count rates Data is divided into 100 sec bins |
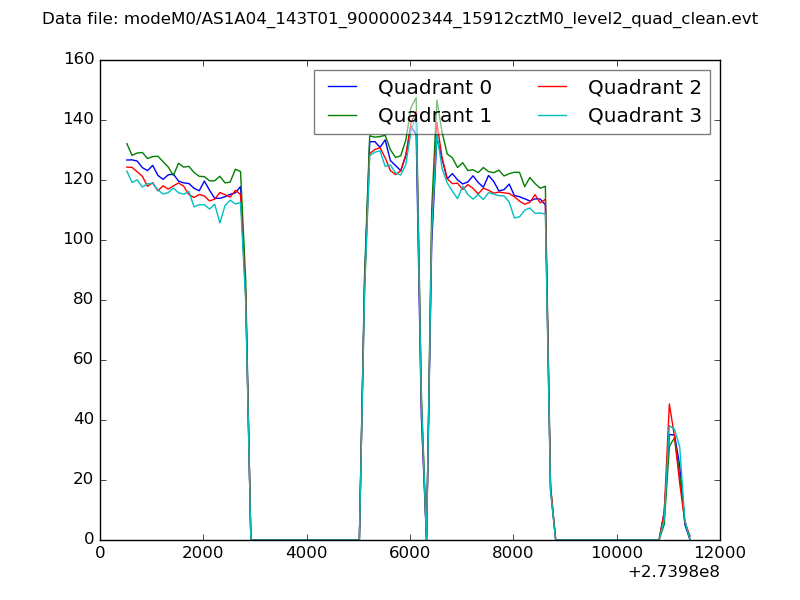 |
|
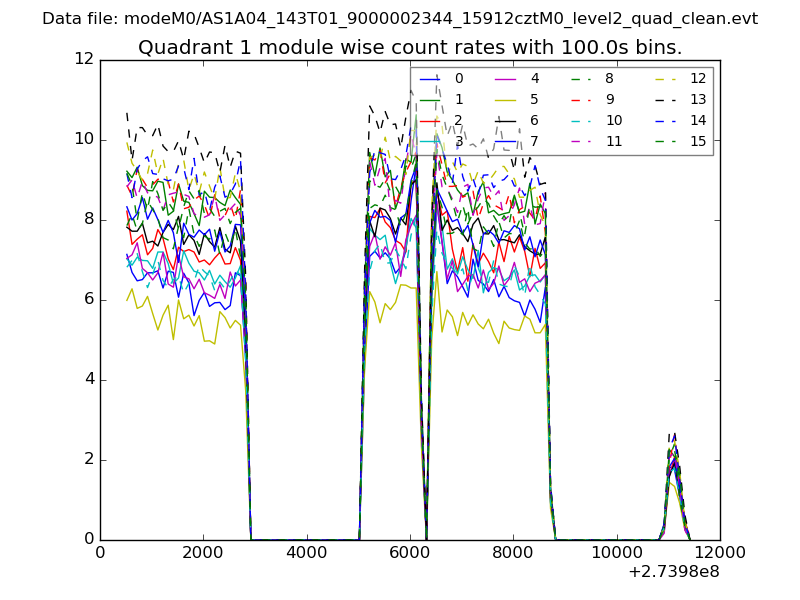
| Module-wise count rates for Quadrant A Data is divided into 100 sec bins |
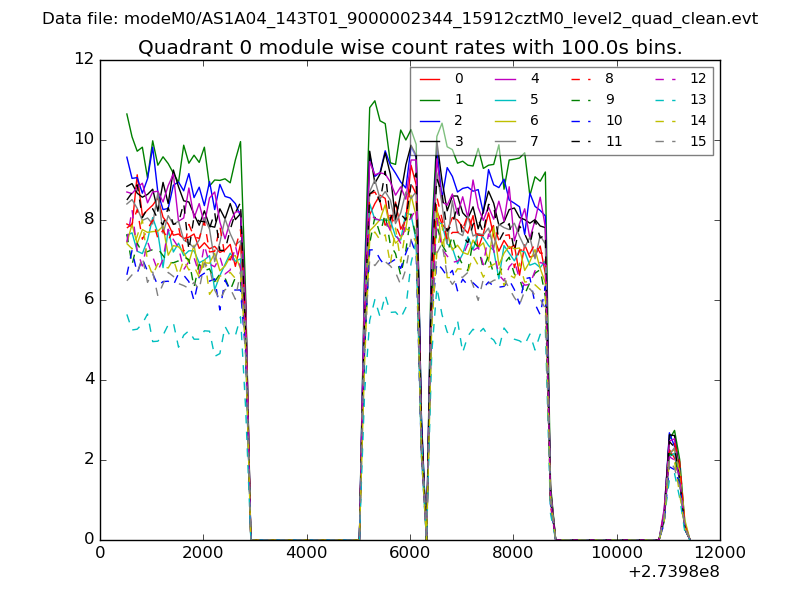 |
 |
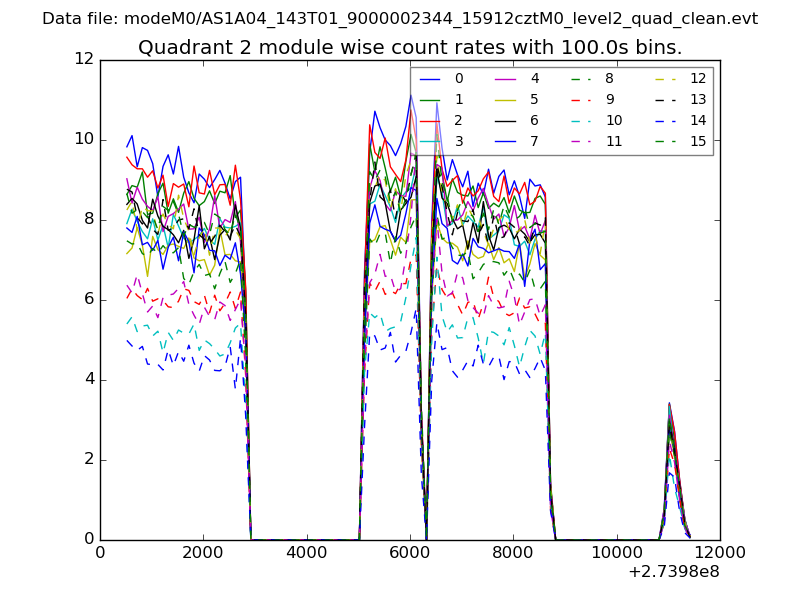
| Module-wise count rates for Quadrant B Data is divided into 100 sec bins |
 |
 |
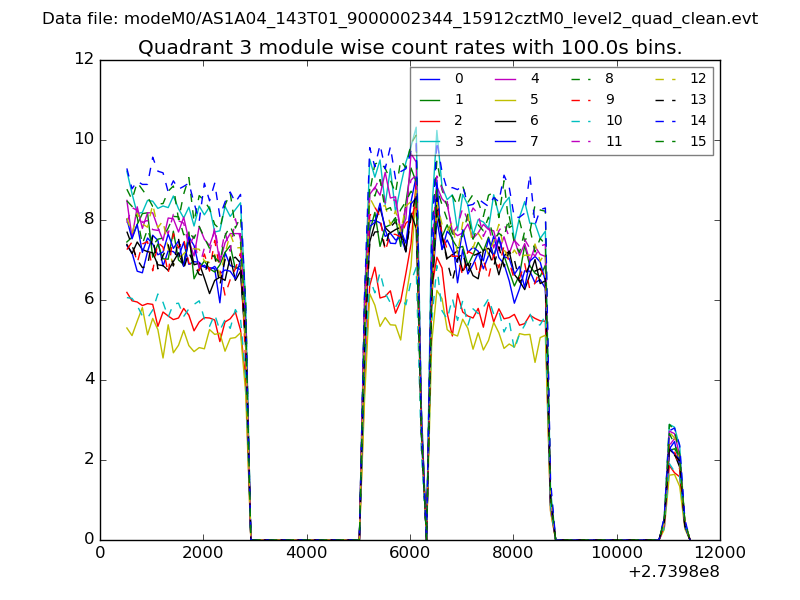
| Module-wise count rates for Quadrant C Data is divided into 100 sec bins |
 |
 |
| Module-wise count rates for Quadrant D Data is divided into 100 sec bins |
 |
 |
| Parameter | Plot |
|---|---|
| CZT HV Monitor | 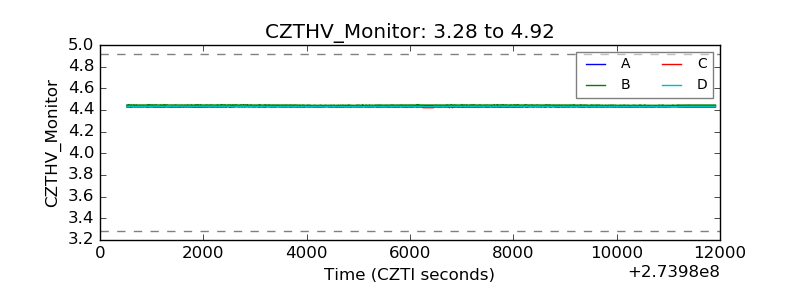 |
| D_VDD | 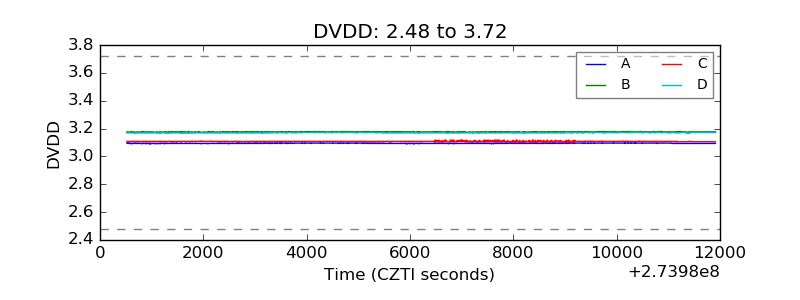 |
| Temperature 1 | 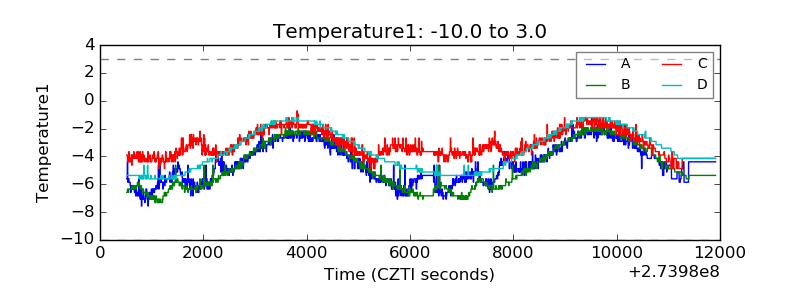 |
| Veto HV Monitor | 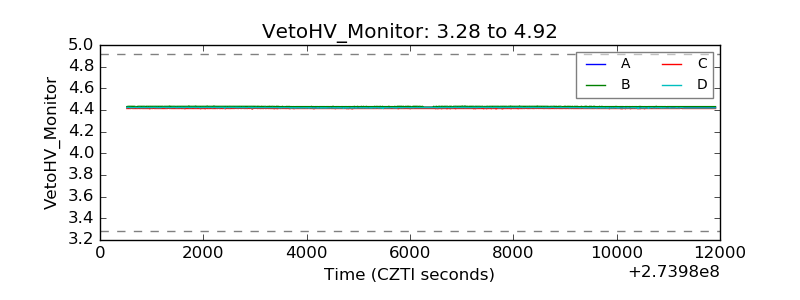 |
| Veto LLD | 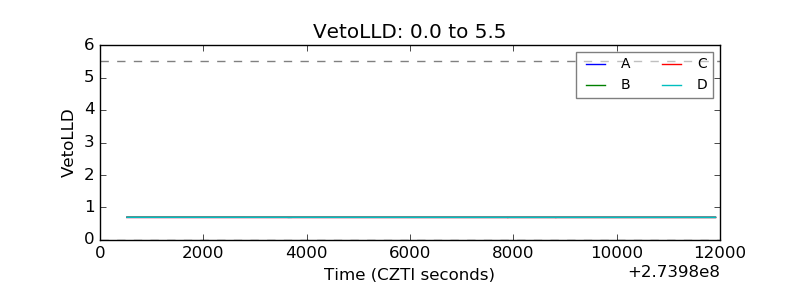 |
| Alpha Counter | 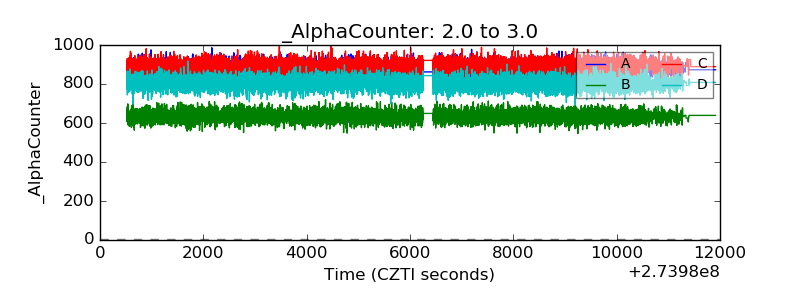 |
| _CPM_Rate | 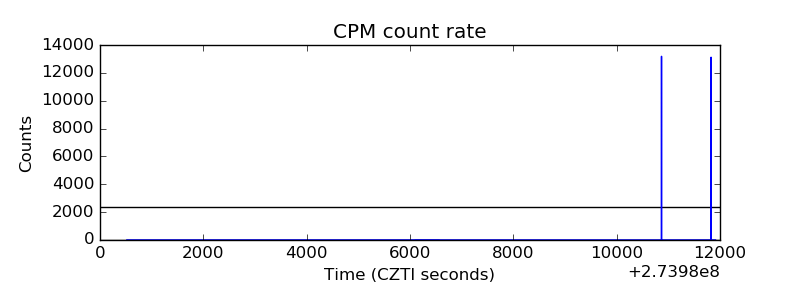 |
| CZT Counter | 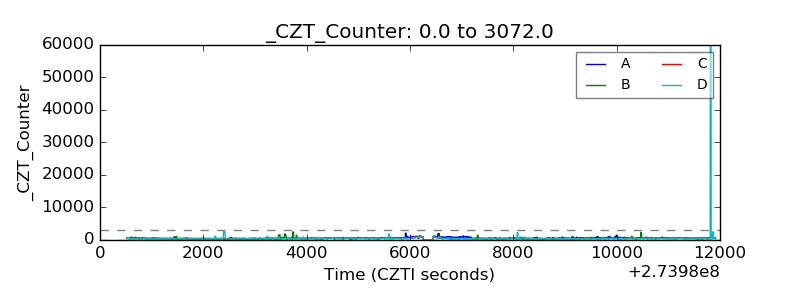 |
| +2.5 Volts monitor | 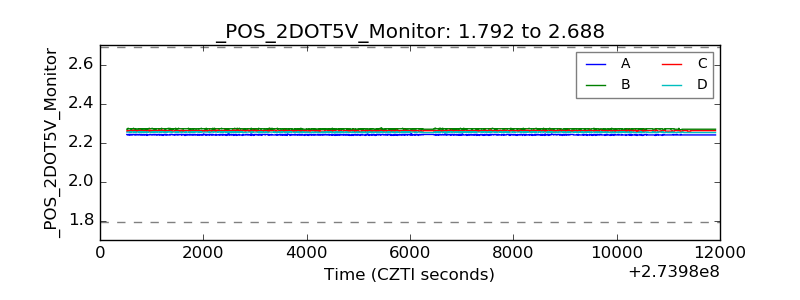 |
| +5 Volts monitor | 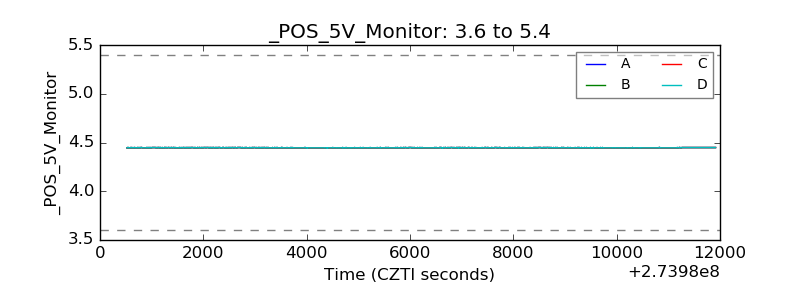 |
| _ROLL_ROT | 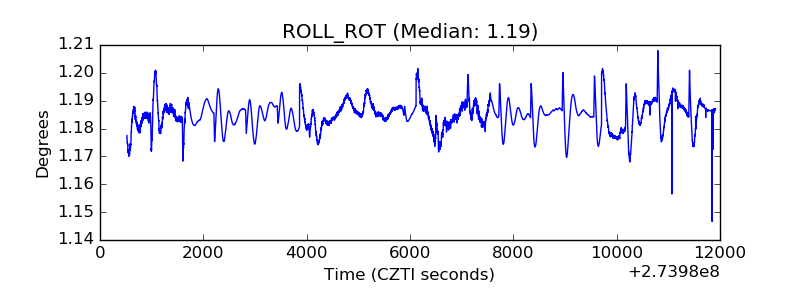 |
| _Roll_DEC | 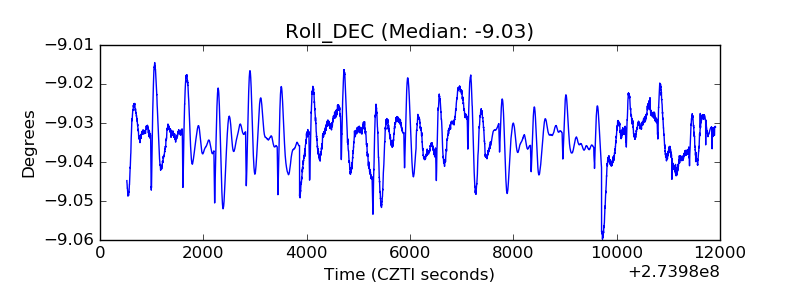 |
| _Roll_RA | 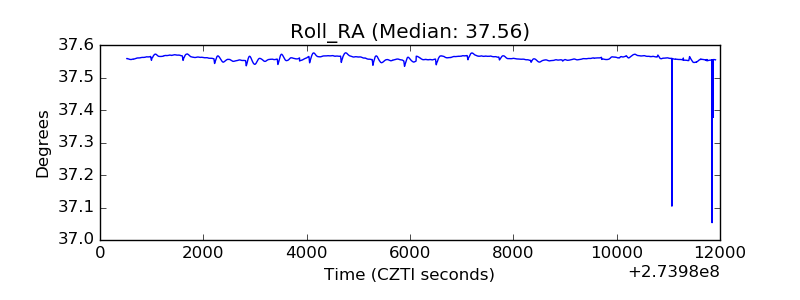 |
| Veto Counter | 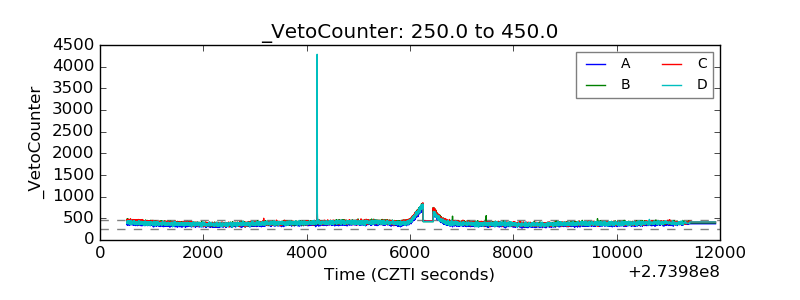 |