| Param | Original file | Final file |
|---|---|---|
| Filename | modeM0/AS1A04_143T01_9000002344_15913cztM0_level2.evt | modeM0/AS1A04_143T01_9000002344_15913cztM0_level2_quad_clean.evt |
| Size (bytes) | 536,569,920 | 103,233,600 |
| Size | 511.7 MB | 98.5 MB |
| Events in quadrant A | 4,450,743 | 649,413 |
| Events in quadrant B | 3,807,229 | 673,567 |
| Events in quadrant C | 3,793,781 | 640,935 |
| Events in quadrant D | 3,680,130 | 631,599 |
| Mode SS | |||
|---|---|---|---|
| Quadrant | BADHDUFLAG | Total packets | Discarded packets |
| A | 0 | 158 | 2 |
| B | 0 | 158 | 6 |
| C | 0 | 158 | 4 |
| D | 0 | 158 | 4 |
| Mode M0 | |||
|---|---|---|---|
| Quadrant | BADHDUFLAG | Total packets | Discarded packets |
| A | 0 | 18583 | 466 |
| B | 0 | 16740 | 460 |
| C | 0 | 16487 | 446 |
| D | 0 | 16764 | 435 |
| Mode M9 | |||
|---|---|---|---|
| Quadrant | BADHDUFLAG | Total packets | Discarded packets |
| A | 0 | 4 | 0 |
| B | 0 | 4 | 0 |
| C | 0 | 4 | 0 |
| D | 0 | 4 | 0 |
| Quadrant | Total seconds | Saturated seconds | Saturation percentage |
|---|---|---|---|
| A | 7619 | 445 | 5.840662% |
| B | 7623 | 344 | 4.512659% |
| C | 7621 | 334 | 4.382627% |
| D | 7627 | 326 | 4.274289% |
Noise dominated data is calculated using 1-second bins in cleaned event files. If a bin has >2000 counts, and if more than 50% of those come from <1% of pixels, then it is considered to be noise-dominated and hence unusable.
| Quadrant | # 1 sec bins | Bins with >0 counts | Bins with >2000 counts | High rate bins dominated by noise | Noise dominated (total time) | Noise dominated (detector-on time) | Marked lightcurve |
|---|---|---|---|---|---|---|---|
| A | 8179 | 7708 | 51 | 51 | 0.62% | 0.66% | 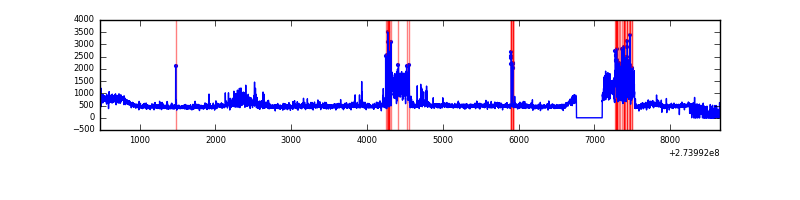 |
| B | 8183 | 7703 | 0 | 0 | 0.00% | 0.00% |  |
| C | 8182 | 7688 | 1 | 1 | 0.01% | 0.01% | 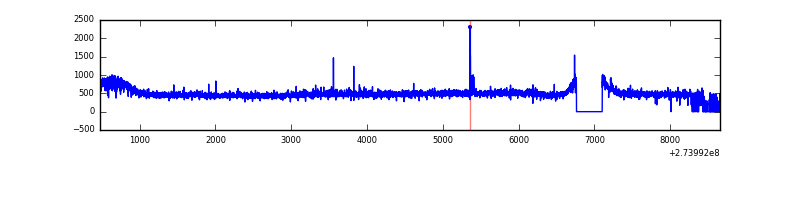 |
| D | 8170 | 7704 | 51 | 51 | 0.62% | 0.66% | 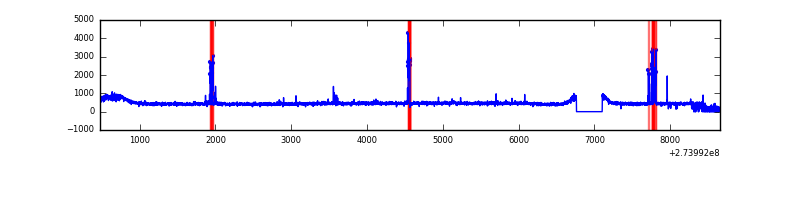 |
Top three noisy pixels from each quadrant. If the there are fewer than three noisy pixels in the level2.evt file, extra rows are filled as -1
| Pixel properties | Quadrant properties | ||||||
|---|---|---|---|---|---|---|---|
| Quadrant | DetID | PixID | Counts | Sigma | Mean | Median | Sigma |
| A | 15 | 239 | 839083 | 4428.75 | 926 | 904 | 189.3 |
| A | 9 | 143 | 43416 | 224.62 | 926 | 904 | 189.3 |
| A | 0 | 226 | 8193 | 38.51 | 926 | 904 | 189.3 |
| B | 4 | 216 | 49117 | 263.88 | 932 | 905 | 182.7 |
| B | 4 | 173 | 45355 | 243.29 | 932 | 905 | 182.7 |
| B | 5 | 236 | 27759 | 146.98 | 932 | 905 | 182.7 |
| C | 14 | 238 | 134895 | 630.65 | 898 | 900 | 212.5 |
| C | 3 | 233 | 91412 | 426.0 | 898 | 900 | 212.5 |
| C | 0 | 207 | 34813 | 159.61 | 898 | 900 | 212.5 |
| D | 10 | 70 | 121223 | 537.35 | 914 | 885 | 223.9 |
| D | 13 | 172 | 70641 | 311.49 | 914 | 885 | 223.9 |
| D | 2 | 234 | 43695 | 191.16 | 914 | 885 | 223.9 |
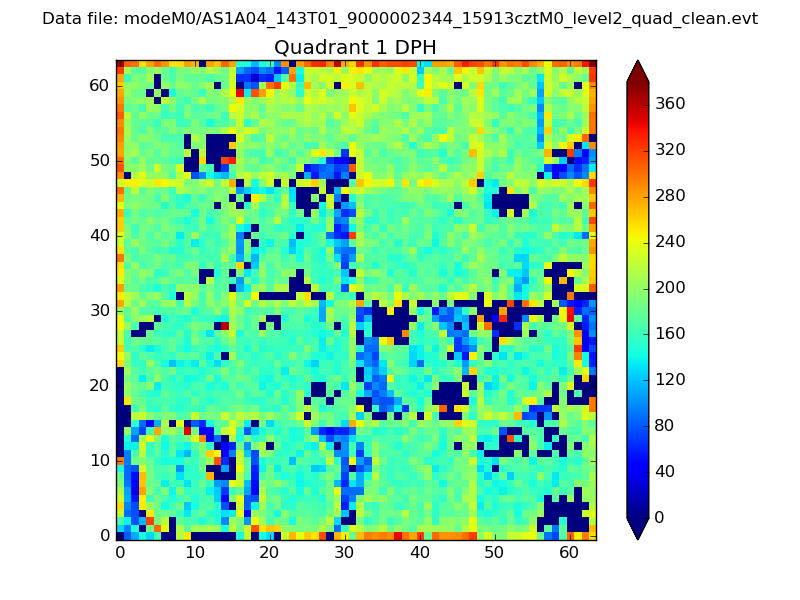
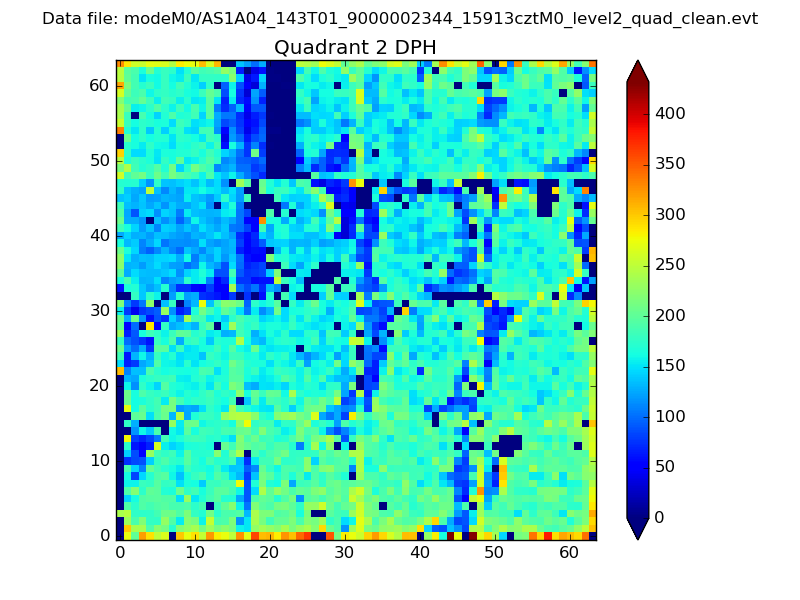
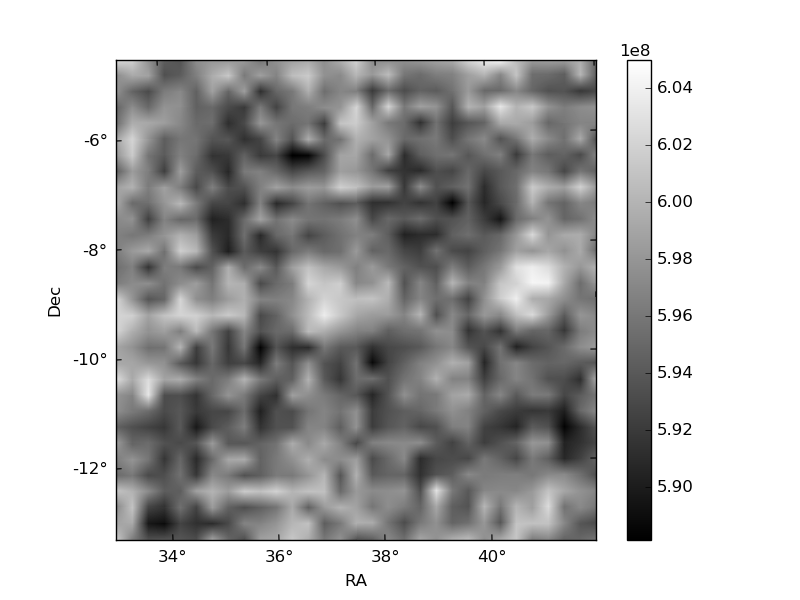
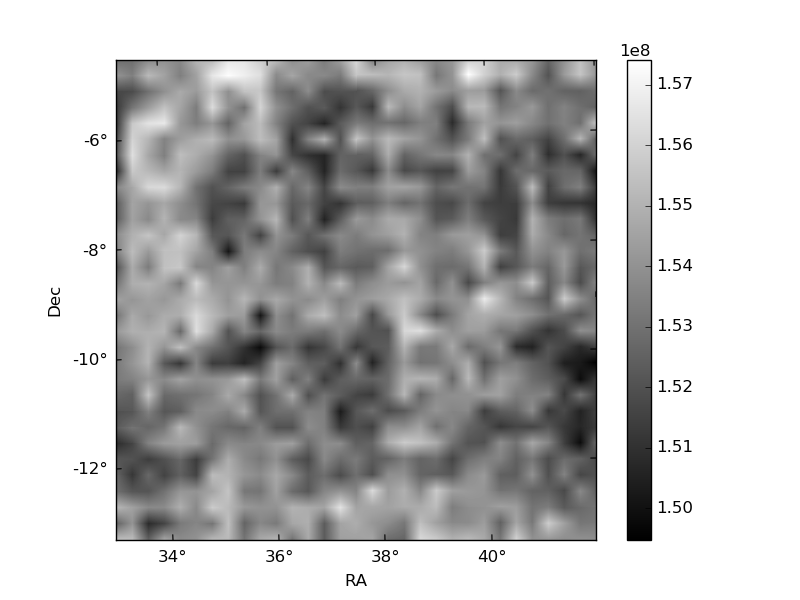
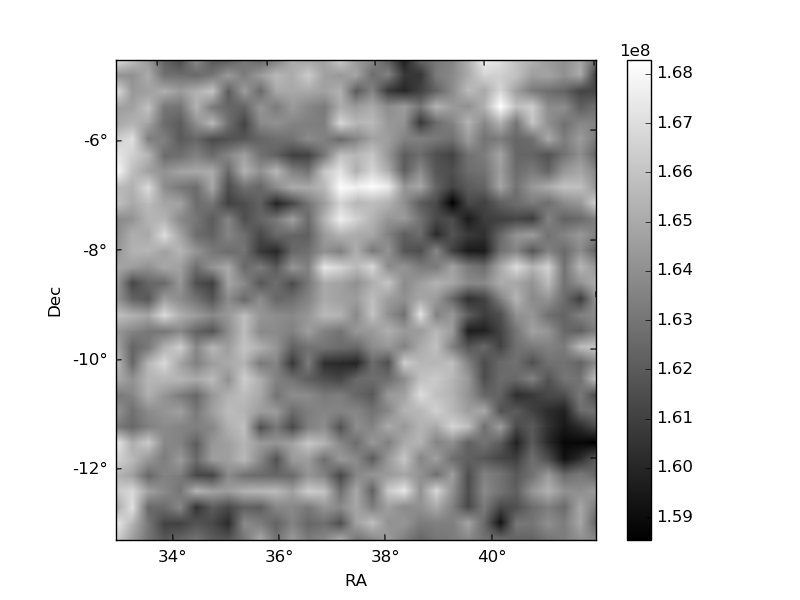
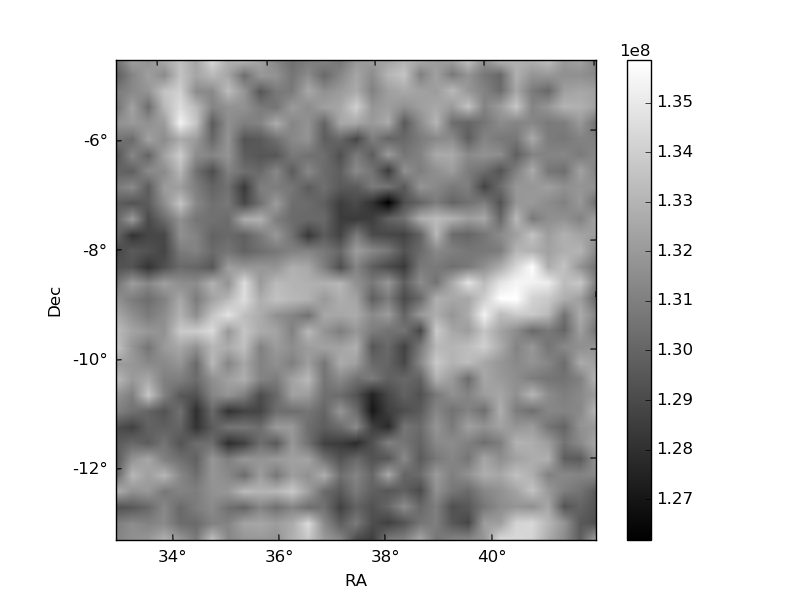
Histogram calculated using DETX and DETY for each event in the final _common_clean file
| Quadrant A | 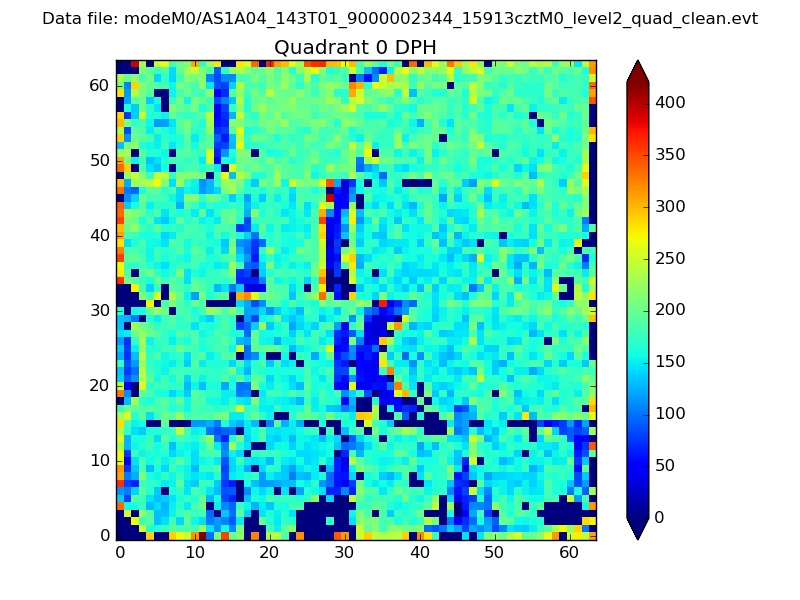 |
 |
Quadrant B |
|---|---|---|---|
| Quadrant D | 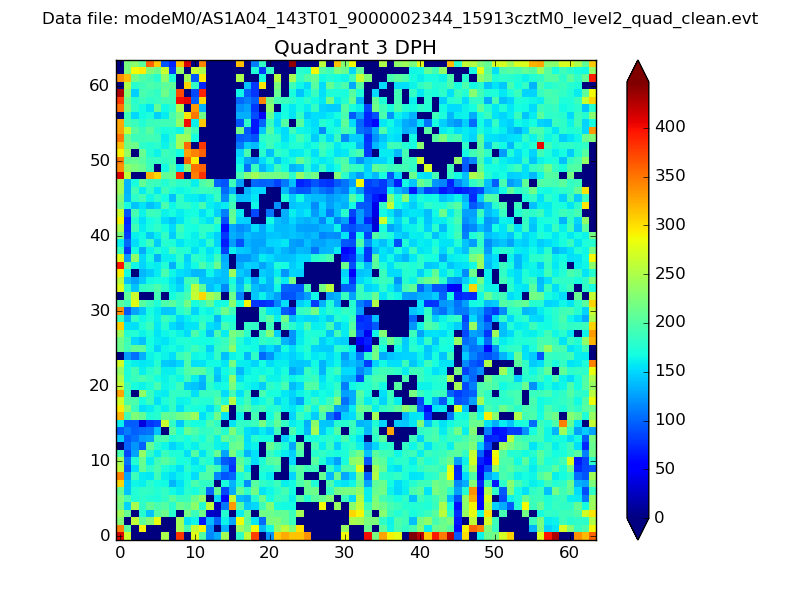 |
 |
Quadrant C |
| Plot type | Count rate plots | Images |
|---|---|---|
| Comparison with Poisson distribution Blue bars denote a histogram of data divided into 1 sec bins. Red curve is a Poisson curve with rate = median count rate of data. |
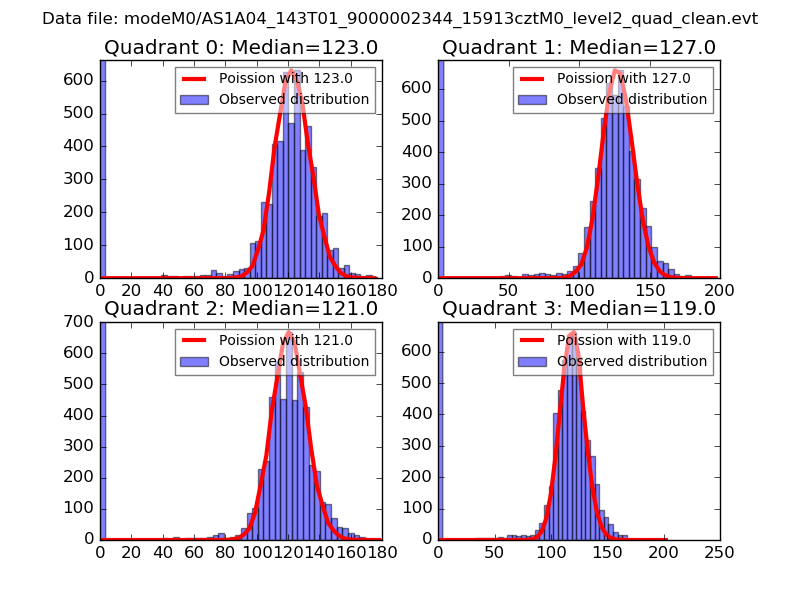 |
 |
| Quadrant-wise count rates Data is divided into 100 sec bins |
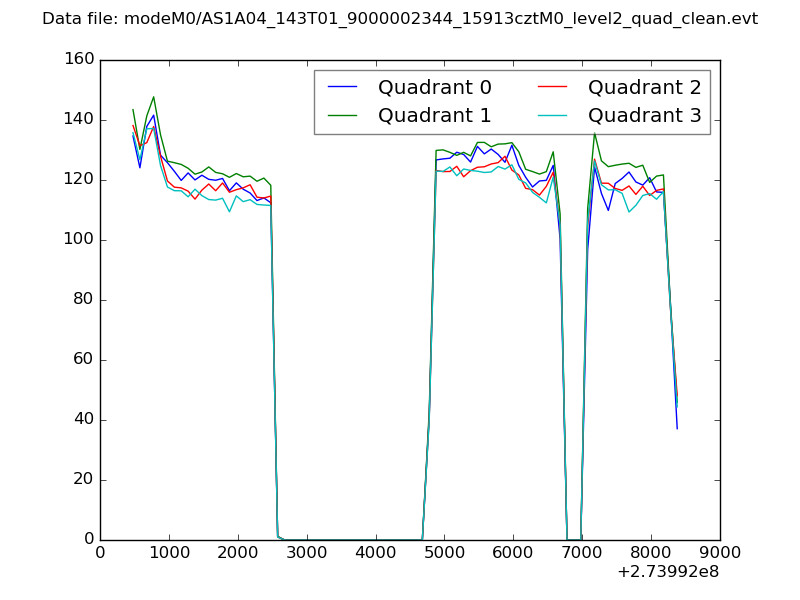 |
|
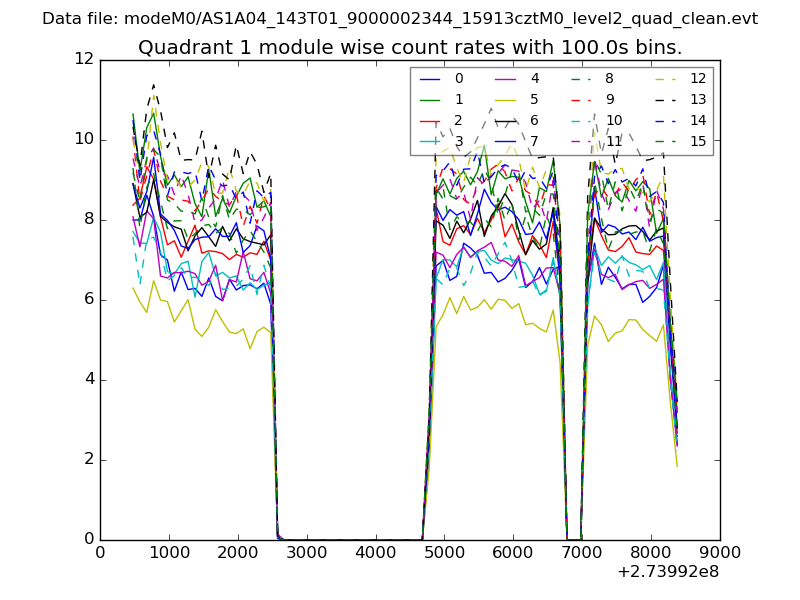
| Module-wise count rates for Quadrant A Data is divided into 100 sec bins |
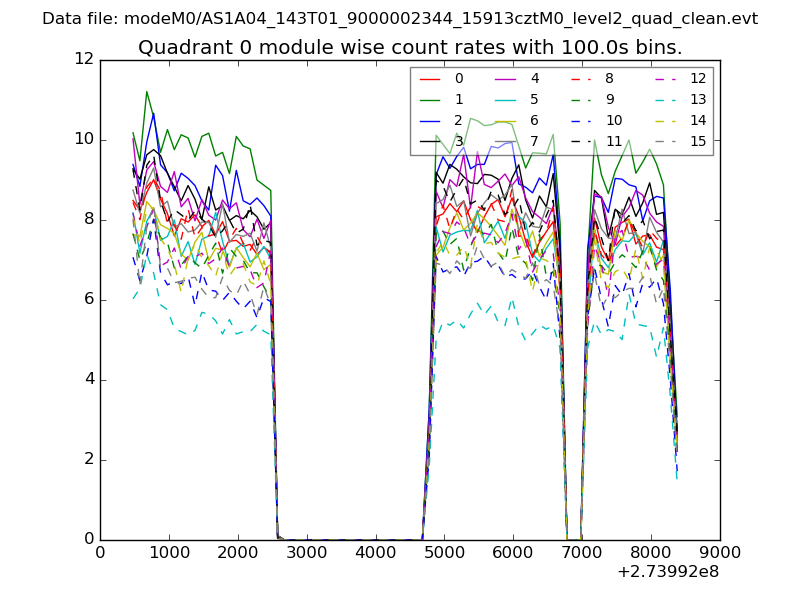 |
 |
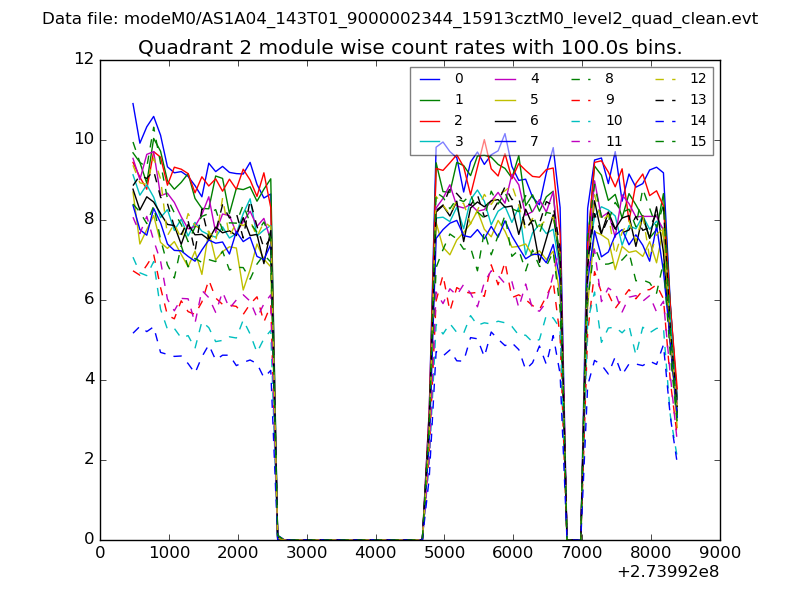
| Module-wise count rates for Quadrant B Data is divided into 100 sec bins |
 |
 |
| Module-wise count rates for Quadrant C Data is divided into 100 sec bins |
 |
 |
| Module-wise count rates for Quadrant D Data is divided into 100 sec bins |
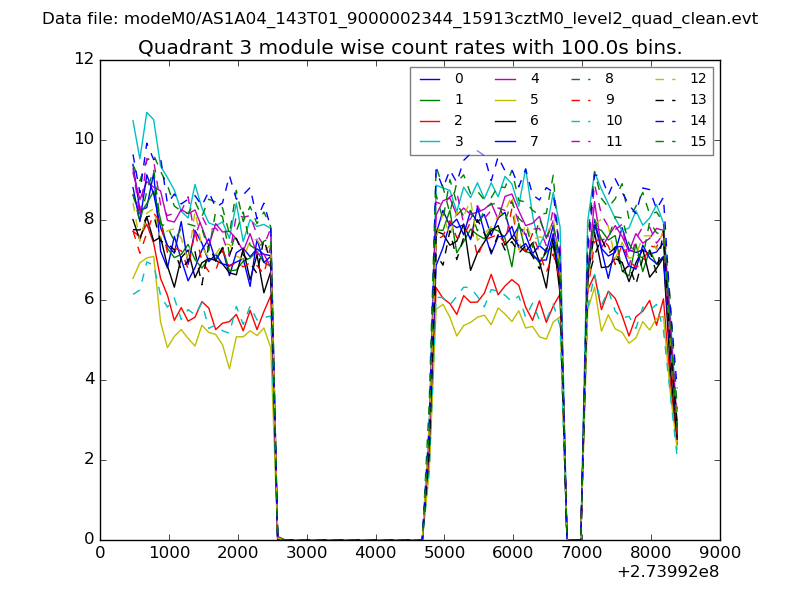 |
 |
| Parameter | Plot |
|---|---|
| CZT HV Monitor | 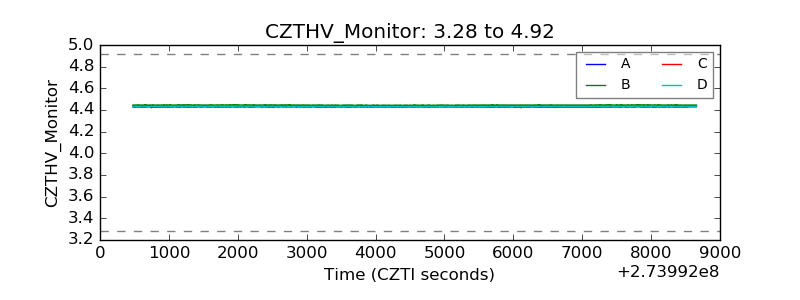 |
| D_VDD | 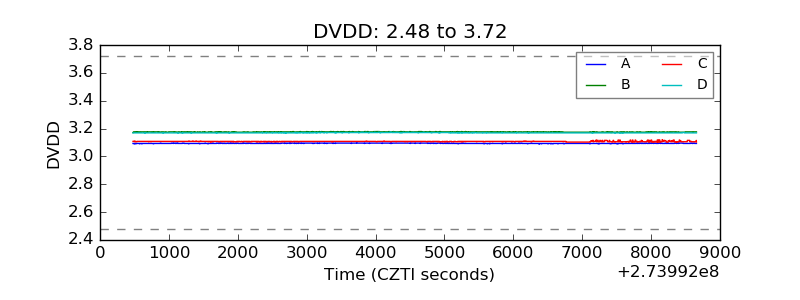 |
| Temperature 1 | 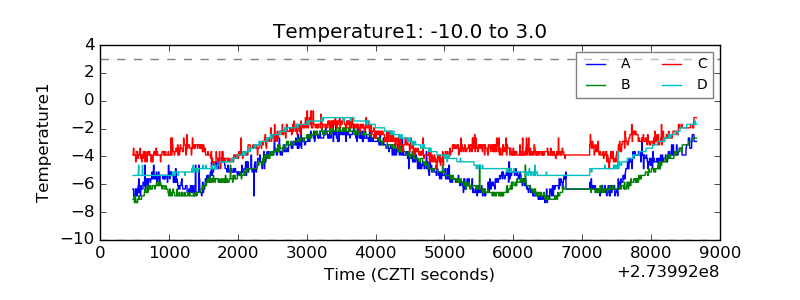 |
| Veto HV Monitor | 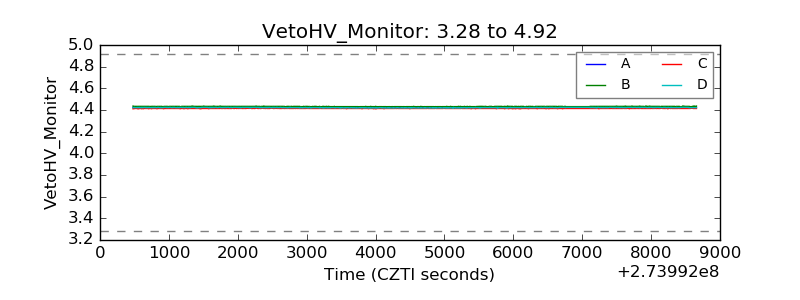 |
| Veto LLD | 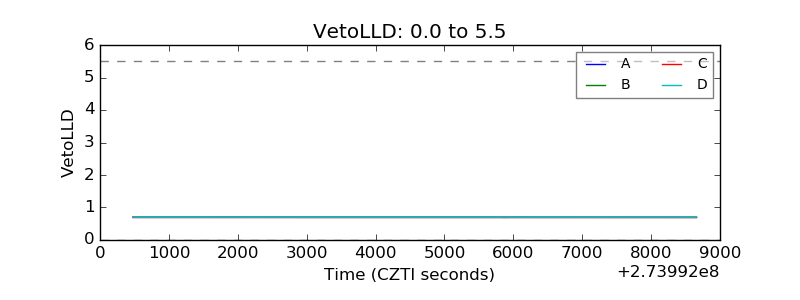 |
| Alpha Counter | 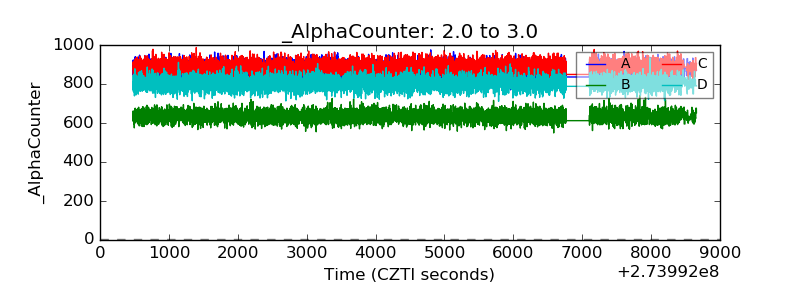 |
| _CPM_Rate | 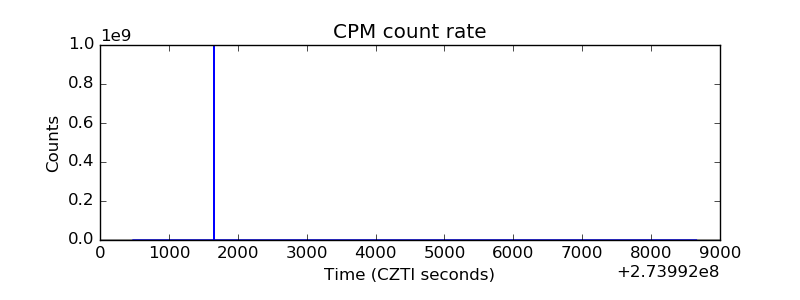 |
| CZT Counter | 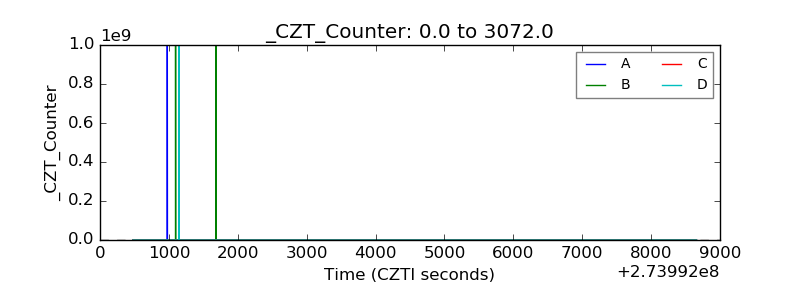 |
| +2.5 Volts monitor |  |
| +5 Volts monitor |  |
| _ROLL_ROT | 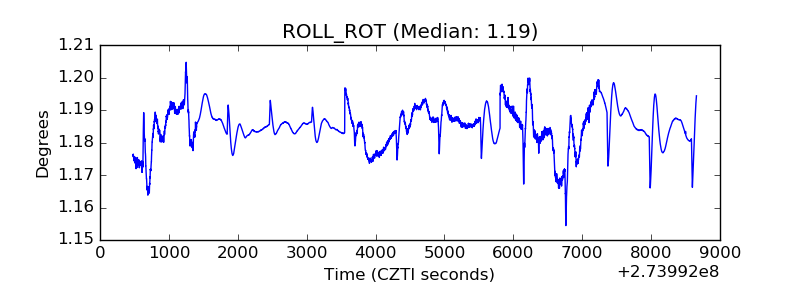 |
| _Roll_DEC |  |
| _Roll_RA | 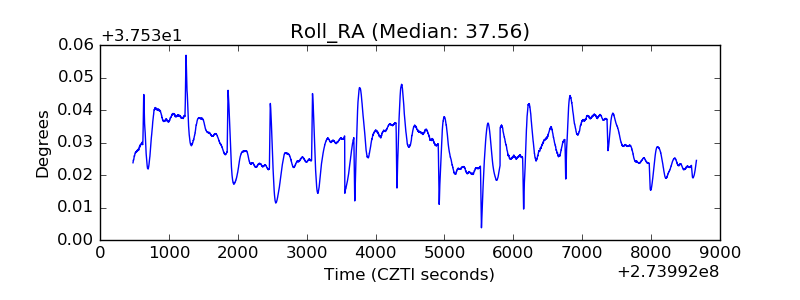 |
| Veto Counter | 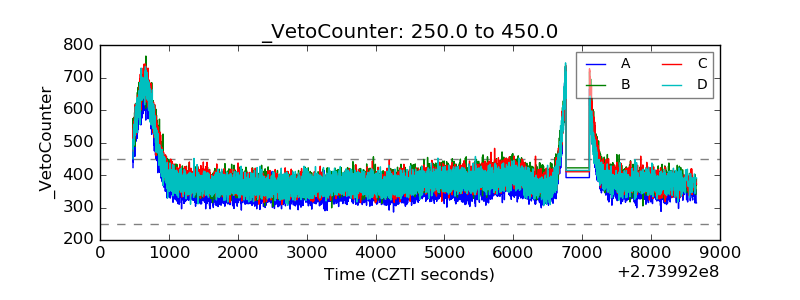 |