| Param | Original file | Final file |
|---|---|---|
| Filename | modeM0/AS1A04_143T01_9000002344_15915cztM0_level2.evt | modeM0/AS1A04_143T01_9000002344_15915cztM0_level2_quad_clean.evt |
| Size (bytes) | 945,023,040 | 140,428,800 |
| Size | 901.2 MB | 133.9 MB |
| Events in quadrant A | 9,224,476 | 832,418 |
| Events in quadrant B | 6,470,071 | 880,708 |
| Events in quadrant C | 6,022,072 | 837,967 |
| Events in quadrant D | 6,047,392 | 826,614 |
| Mode SS | |||
|---|---|---|---|
| Quadrant | BADHDUFLAG | Total packets | Discarded packets |
| A | 0 | 258 | 0 |
| B | 0 | 258 | 0 |
| C | 0 | 258 | 0 |
| D | 0 | 258 | 0 |
| Mode M0 | |||
|---|---|---|---|
| Quadrant | BADHDUFLAG | Total packets | Discarded packets |
| A | 0 | 35868 | 3 |
| B | 0 | 27143 | 2 |
| C | 0 | 25748 | 2 |
| D | 0 | 26531 | 2 |
| Mode M9 | |||
|---|---|---|---|
| Quadrant | BADHDUFLAG | Total packets | Discarded packets |
| A | 0 | 12 | 0 |
| B | 0 | 12 | 0 |
| C | 0 | 12 | 0 |
| D | 0 | 12 | 0 |
| Quadrant | Total seconds | Saturated seconds | Saturation percentage |
|---|---|---|---|
| A | 12650 | 830 | 6.561265% |
| B | 12650 | 199 | 1.573123% |
| C | 12650 | 164 | 1.296443% |
| D | 12650 | 182 | 1.438735% |
Noise dominated data is calculated using 1-second bins in cleaned event files. If a bin has >2000 counts, and if more than 50% of those come from <1% of pixels, then it is considered to be noise-dominated and hence unusable.
| Quadrant | # 1 sec bins | Bins with >0 counts | Bins with >2000 counts | High rate bins dominated by noise | Noise dominated (total time) | Noise dominated (detector-on time) | Marked lightcurve |
|---|---|---|---|---|---|---|---|
| A | 13896 | 12651 | 455 | 455 | 3.27% | 3.60% | 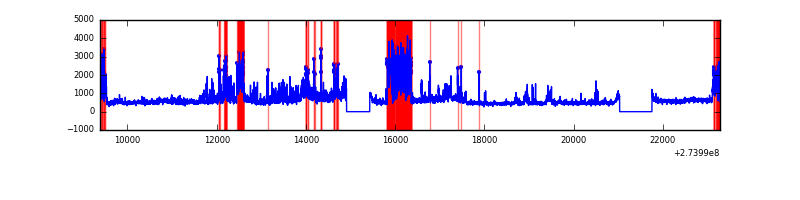 |
| B | 13896 | 12651 | 45 | 45 | 0.32% | 0.36% | 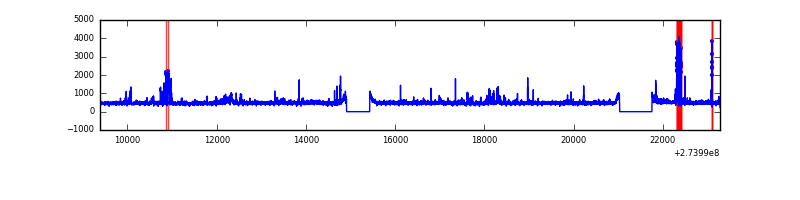 |
| C | 13896 | 12651 | 0 | 0 | 0.00% | 0.00% | 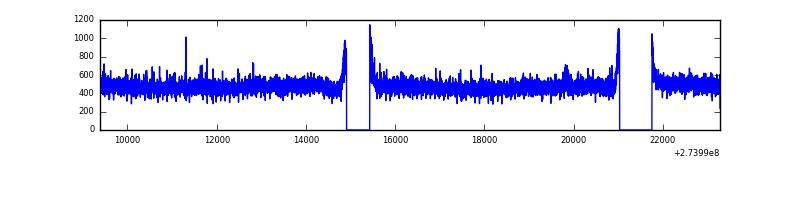 |
| D | 13896 | 12651 | 57 | 57 | 0.41% | 0.45% | 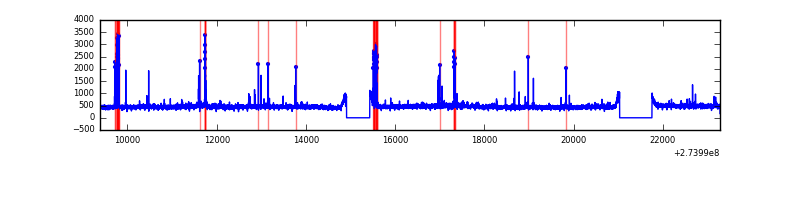 |
Top three noisy pixels from each quadrant. If the there are fewer than three noisy pixels in the level2.evt file, extra rows are filled as -1
| Pixel properties | Quadrant properties | ||||||
|---|---|---|---|---|---|---|---|
| Quadrant | DetID | PixID | Counts | Sigma | Mean | Median | Sigma |
| A | 15 | 239 | 3519856 | 11902.26 | 1471 | 1436 | 295.6 |
| A | 15 | 157 | 34236 | 110.96 | 1471 | 1436 | 295.6 |
| A | 9 | 143 | 24252 | 77.18 | 1471 | 1436 | 295.6 |
| B | 4 | 142 | 215184 | 737.65 | 1509 | 1468 | 289.7 |
| B | 4 | 216 | 132919 | 453.71 | 1509 | 1468 | 289.7 |
| B | 4 | 173 | 61053 | 205.66 | 1509 | 1468 | 289.7 |
| C | 14 | 238 | 221770 | 644.02 | 1455 | 1463 | 342.1 |
| C | 3 | 233 | 86209 | 247.74 | 1455 | 1463 | 342.1 |
| C | 0 | 207 | 15884 | 42.16 | 1455 | 1463 | 342.1 |
| D | 10 | 70 | 156179 | 425.38 | 1481 | 1434 | 363.8 |
| D | 1 | 52 | 118020 | 320.49 | 1481 | 1434 | 363.8 |
| D | 13 | 172 | 99849 | 270.54 | 1481 | 1434 | 363.8 |
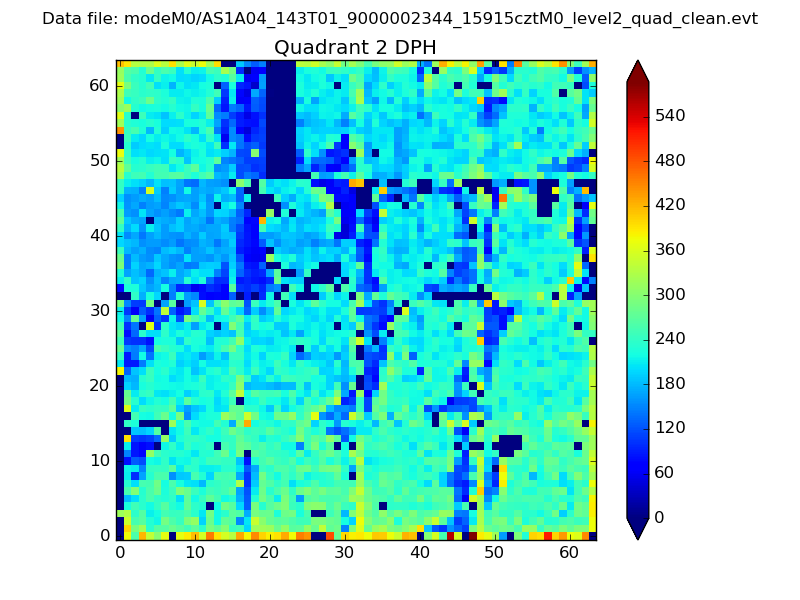
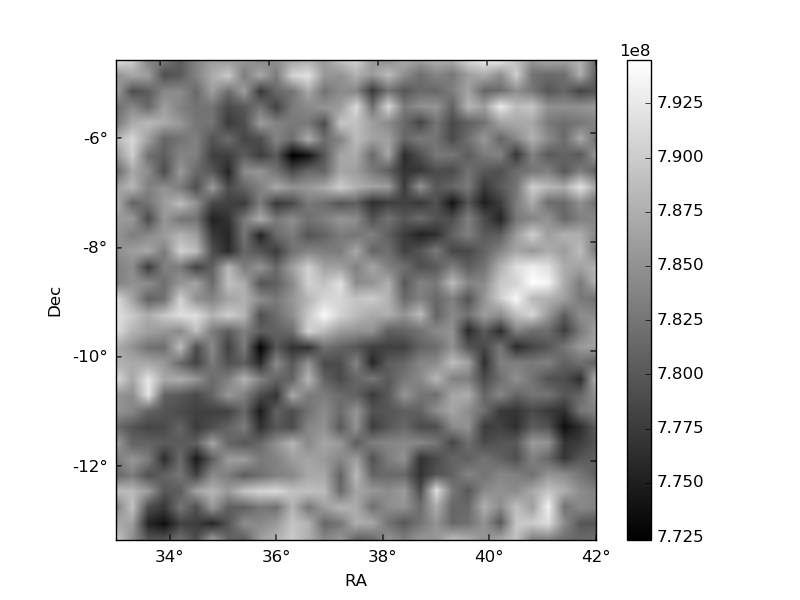
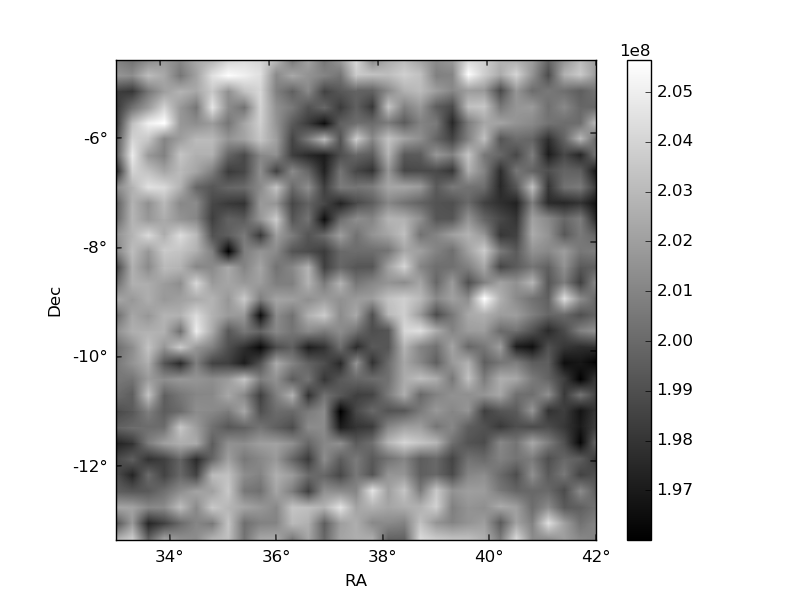
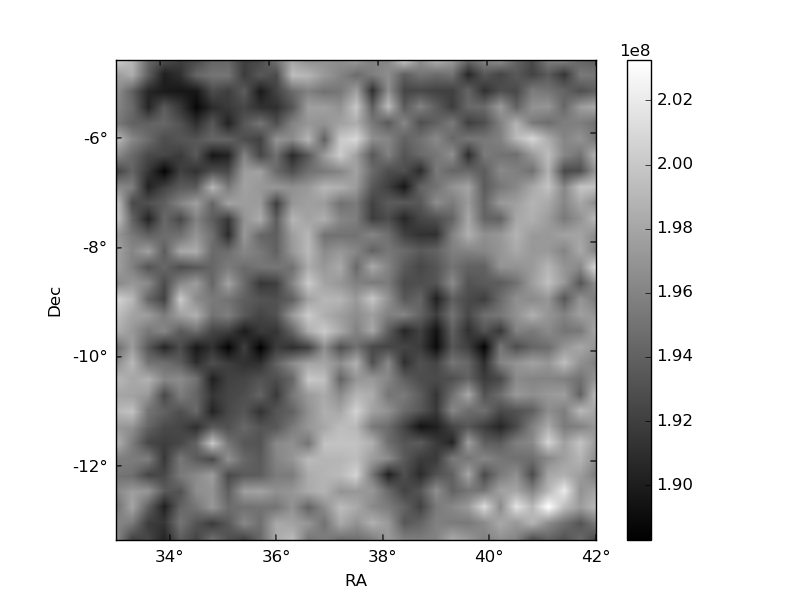
Histogram calculated using DETX and DETY for each event in the final _common_clean file
| Quadrant A | 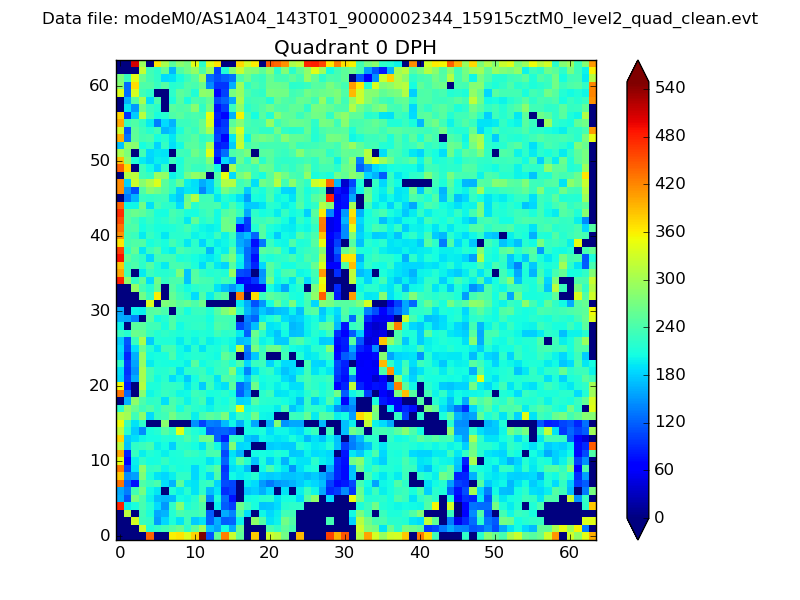 |
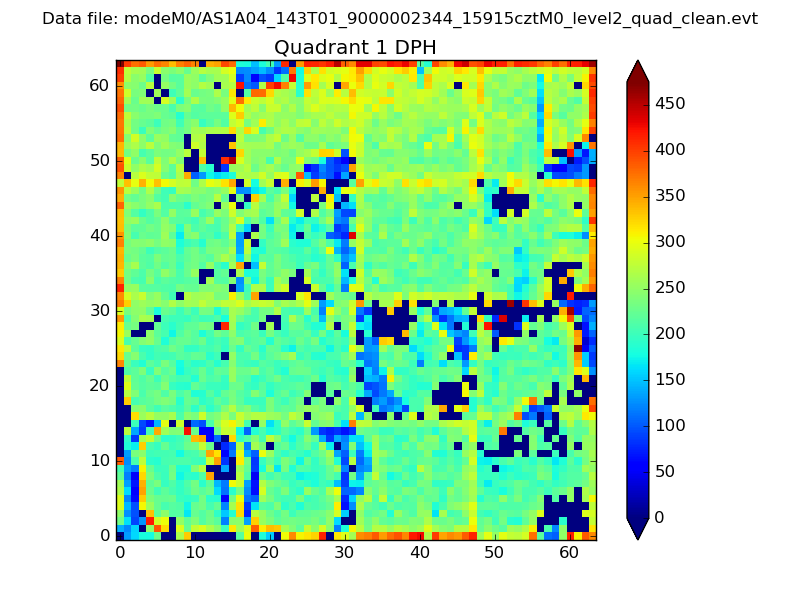 |
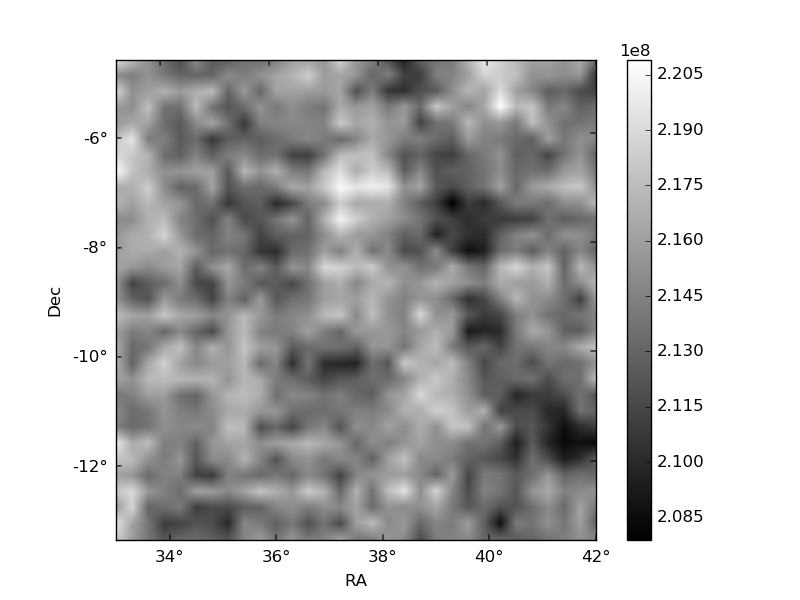
Quadrant B |
|---|---|---|---|
| Quadrant D | 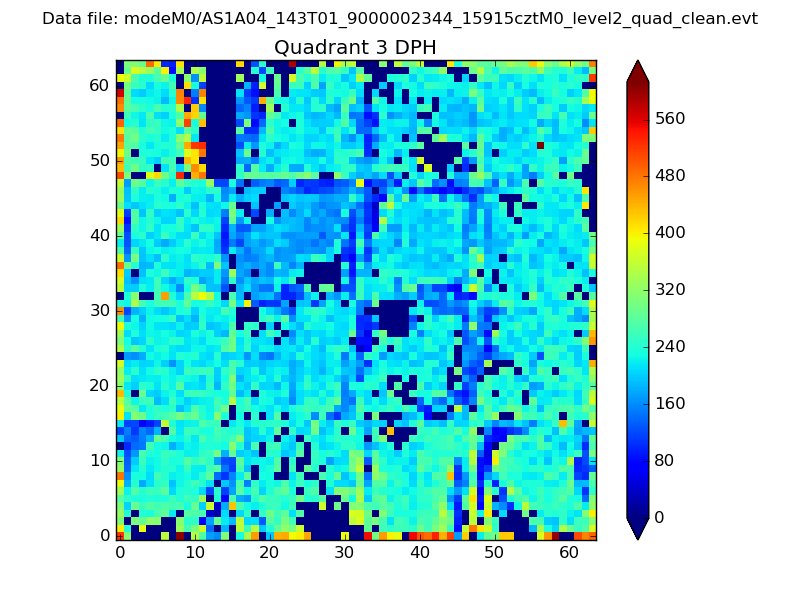 |
 |
Quadrant C |
| Plot type | Count rate plots | Images |
|---|---|---|
| Comparison with Poisson distribution Blue bars denote a histogram of data divided into 1 sec bins. Red curve is a Poisson curve with rate = median count rate of data. |
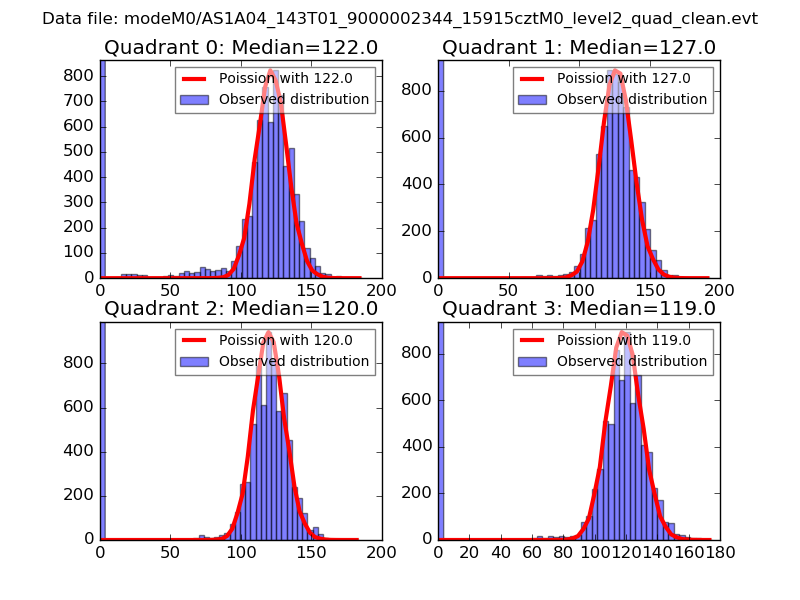 |
 |
| Quadrant-wise count rates Data is divided into 100 sec bins |
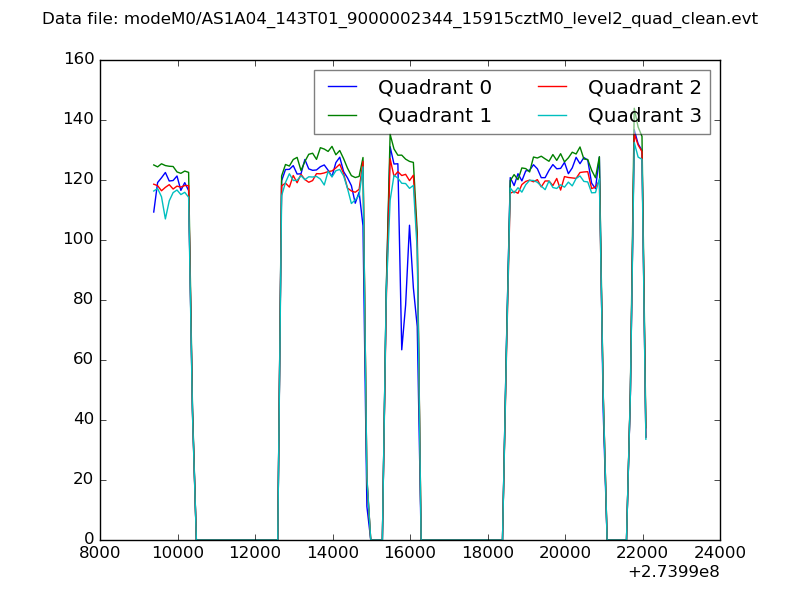 |
|
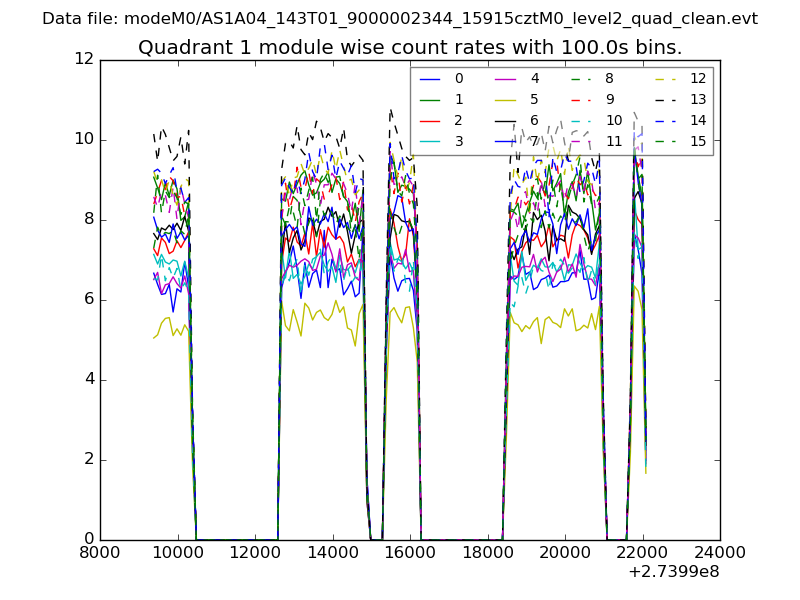
| Module-wise count rates for Quadrant A Data is divided into 100 sec bins |
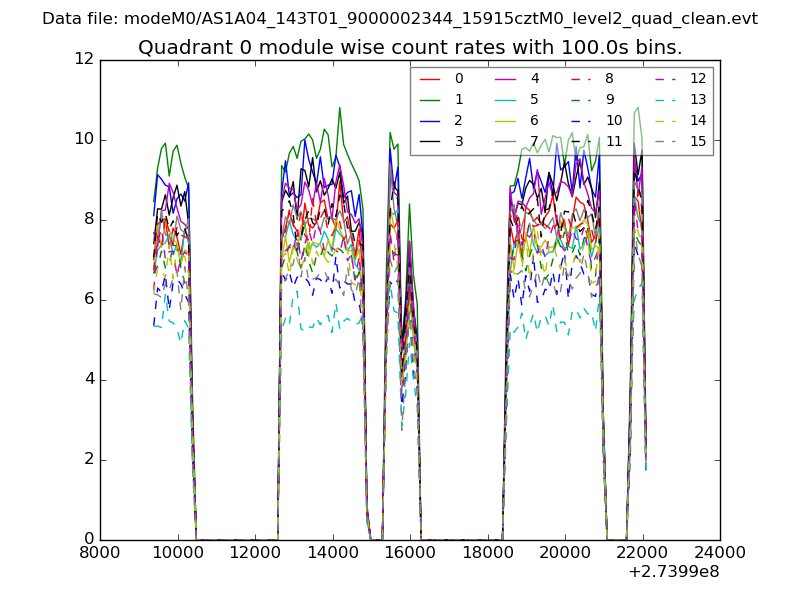 |
 |
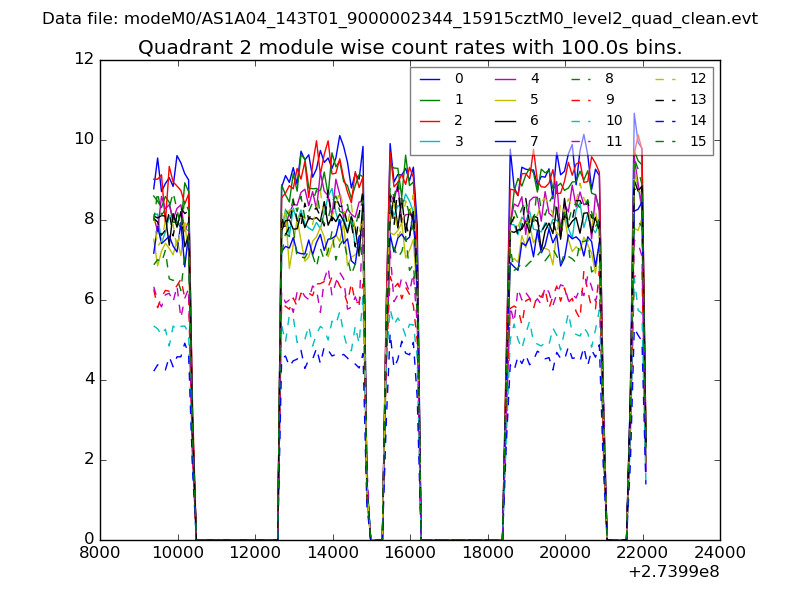
| Module-wise count rates for Quadrant B Data is divided into 100 sec bins |
 |
 |
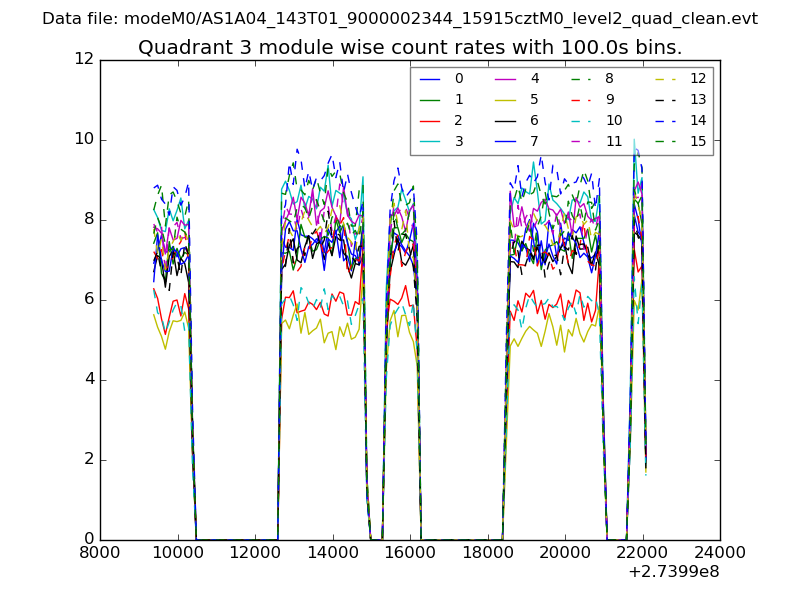
| Module-wise count rates for Quadrant C Data is divided into 100 sec bins |
 |
 |
| Module-wise count rates for Quadrant D Data is divided into 100 sec bins |
 |
 |
| Parameter | Plot |
|---|---|
| CZT HV Monitor | 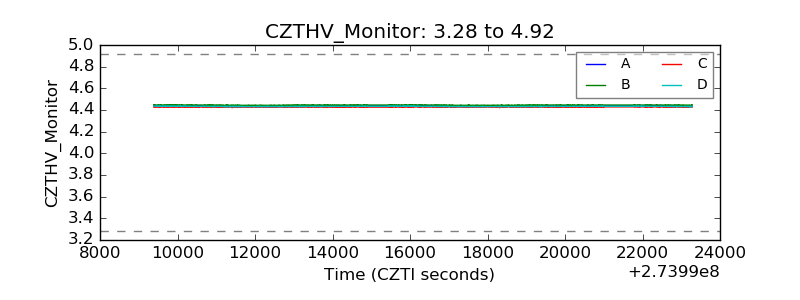 |
| D_VDD | 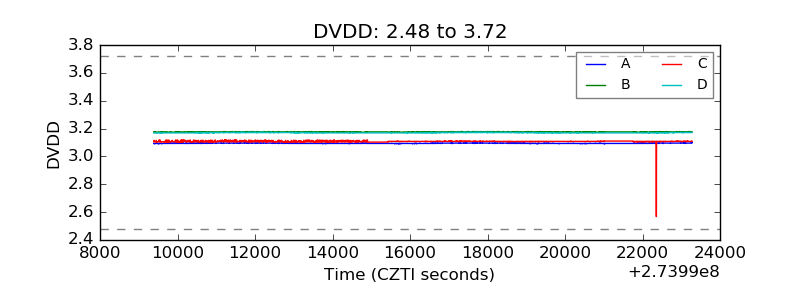 |
| Temperature 1 | 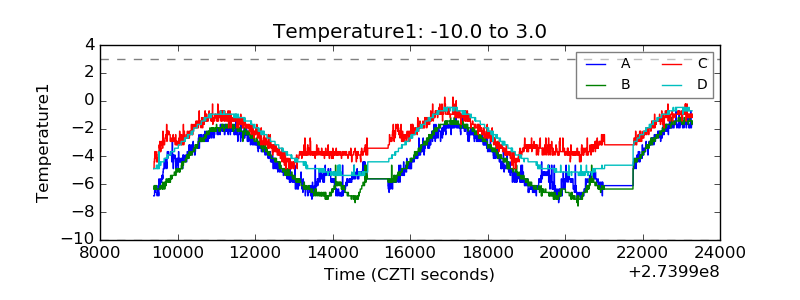 |
| Veto HV Monitor | 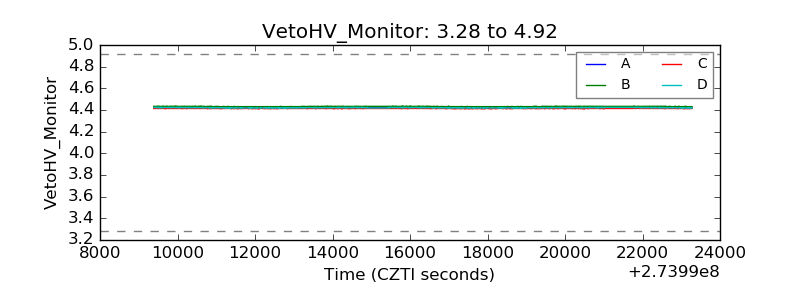 |
| Veto LLD | 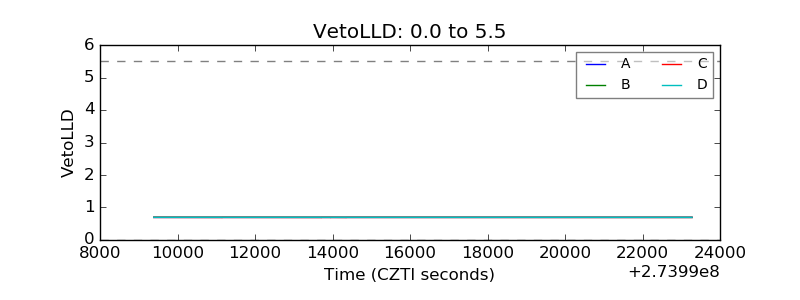 |
| Alpha Counter | 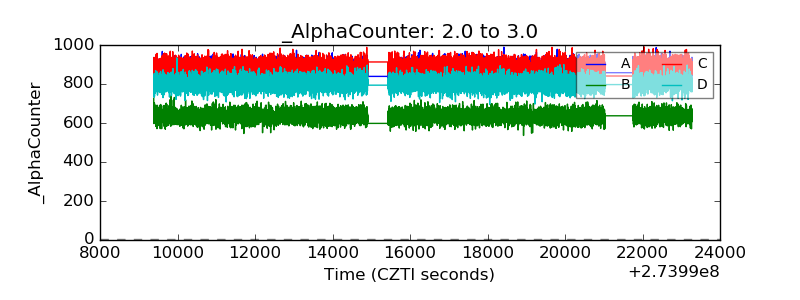 |
| _CPM_Rate | 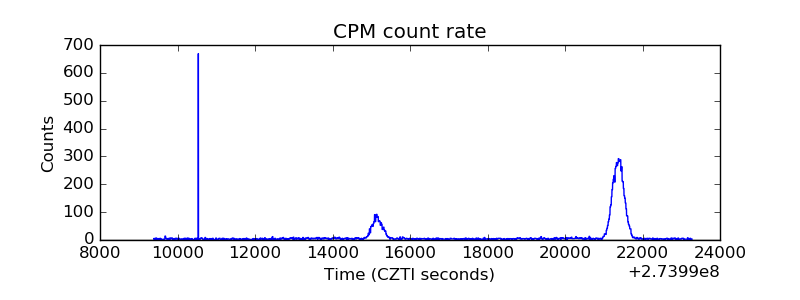 |
| CZT Counter | 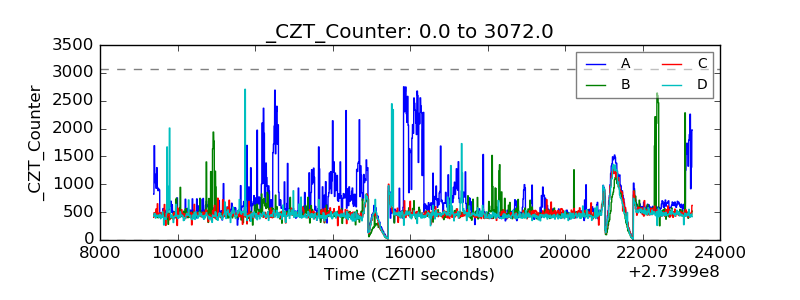 |
| +2.5 Volts monitor |  |
| +5 Volts monitor |  |
| _ROLL_ROT | 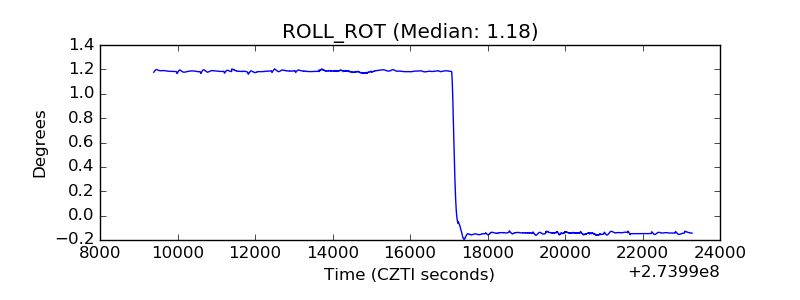 |
| _Roll_DEC | 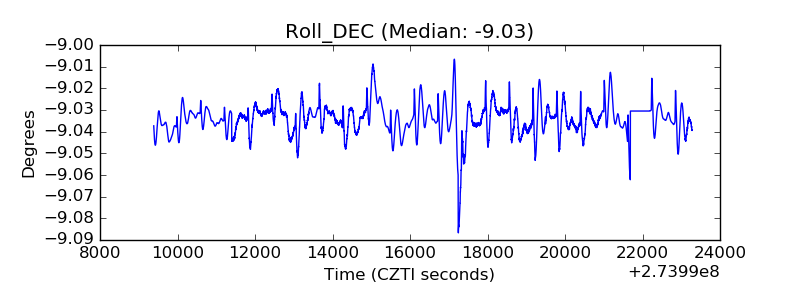 |
| _Roll_RA | 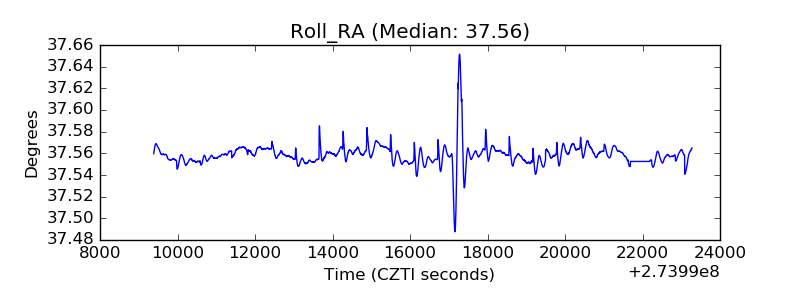 |
| Veto Counter | 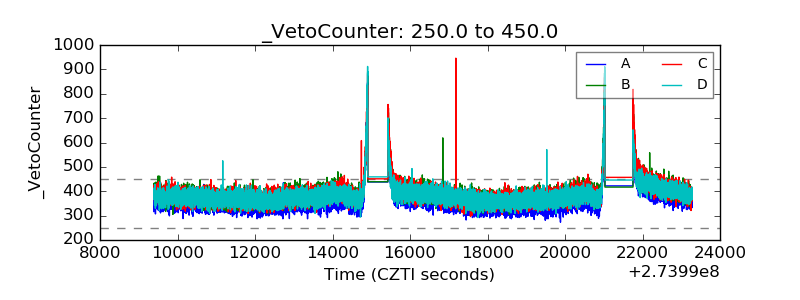 |