| Param | Original file | Final file |
|---|---|---|
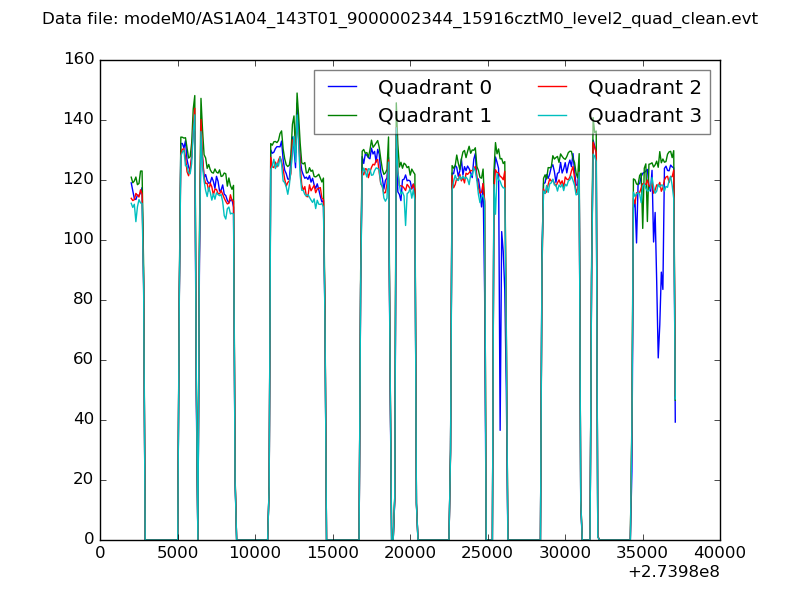
| Filename | modeM0/AS1A04_143T01_9000002344_15916cztM0_level2.evt | modeM0/AS1A04_143T01_9000002344_15916cztM0_level2_quad_clean.evt |
| Size (bytes) | 2,567,750,400 | 396,357,120 |
| Size | 2.4 GB | 378.0 MB |
| Events in quadrant A | 23,991,352 | 2,373,452 |
| Events in quadrant B | 17,874,343 | 2,506,759 |
| Events in quadrant C | 16,873,339 | 2,384,490 |
| Events in quadrant D | 16,679,082 | 2,350,501 |
| Mode SS | |||
|---|---|---|---|
| Quadrant | BADHDUFLAG | Total packets | Discarded packets |
| A | 0 | 704 | 0 |
| B | 0 | 704 | 0 |
| C | 0 | 704 | 0 |
| D | 0 | 704 | 0 |
| Mode M0 | |||
|---|---|---|---|
| Quadrant | BADHDUFLAG | Total packets | Discarded packets |
| A | 0 | 94103 | 6 |
| B | 0 | 75209 | 5 |
| C | 0 | 71858 | 5 |
| D | 0 | 73427 | 5 |
| Mode M9 | |||
|---|---|---|---|
| Quadrant | BADHDUFLAG | Total packets | Discarded packets |
| A | 0 | 27 | 0 |
| B | 0 | 27 | 0 |
| C | 0 | 27 | 0 |
| D | 0 | 27 | 0 |
| Quadrant | Total seconds | Saturated seconds | Saturation percentage |
|---|---|---|---|
| A | 34769 | 2335 | 6.715753% |
| B | 34769 | 873 | 2.510857% |
| C | 34769 | 754 | 2.168598% |
| D | 34769 | 724 | 2.082315% |
Noise dominated data is calculated using 1-second bins in cleaned event files. If a bin has >2000 counts, and if more than 50% of those come from <1% of pixels, then it is considered to be noise-dominated and hence unusable.
| Quadrant | # 1 sec bins | Bins with >0 counts | Bins with >2000 counts | High rate bins dominated by noise | Noise dominated (total time) | Noise dominated (detector-on time) | Marked lightcurve |
|---|---|---|---|---|---|---|---|
| A | 37460 | 34772 | 1005 | 1005 | 2.68% | 2.89% | 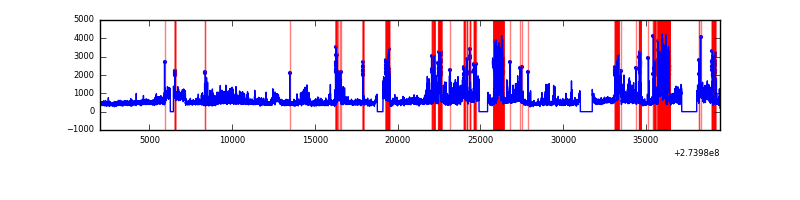 |
| B | 37460 | 34772 | 133 | 133 | 0.36% | 0.38% | 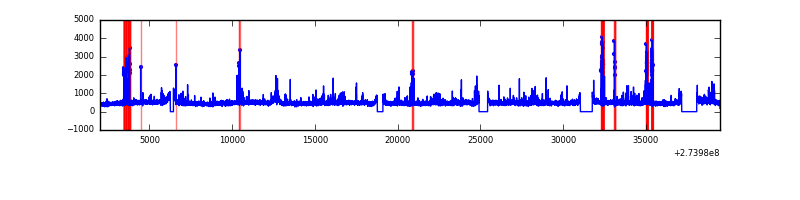 |
| C | 37460 | 34772 | 4 | 4 | 0.01% | 0.01% |  |
| D | 37460 | 34771 | 149 | 149 | 0.40% | 0.43% | 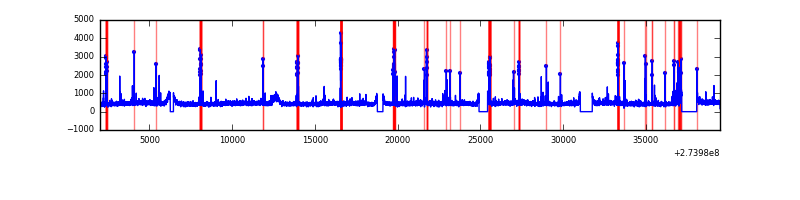 |
Top three noisy pixels from each quadrant. If the there are fewer than three noisy pixels in the level2.evt file, extra rows are filled as -1
| Pixel properties | Quadrant properties | ||||||
|---|---|---|---|---|---|---|---|
| Quadrant | DetID | PixID | Counts | Sigma | Mean | Median | Sigma |
| A | 15 | 239 | 8063031 | 9757.2 | 4110 | 4014 | 826.0 |
| A | 9 | 143 | 92113 | 106.66 | 4110 | 4014 | 826.0 |
| A | 15 | 157 | 37047 | 39.99 | 4110 | 4014 | 826.0 |
| B | 4 | 142 | 400031 | 490.06 | 4213 | 4102 | 807.9 |
| B | 4 | 216 | 257174 | 313.24 | 4213 | 4102 | 807.9 |
| B | 0 | 229 | 232694 | 282.94 | 4213 | 4102 | 807.9 |
| C | 14 | 238 | 616069 | 643.95 | 4054 | 4073 | 950.4 |
| C | 3 | 233 | 331152 | 344.16 | 4054 | 4073 | 950.4 |
| C | 0 | 207 | 60773 | 59.66 | 4054 | 4073 | 950.4 |
| D | 10 | 70 | 407625 | 400.71 | 4128 | 4010 | 1007.2 |
| D | 13 | 172 | 244278 | 238.54 | 4128 | 4010 | 1007.2 |
| D | 1 | 52 | 191978 | 186.61 | 4128 | 4010 | 1007.2 |
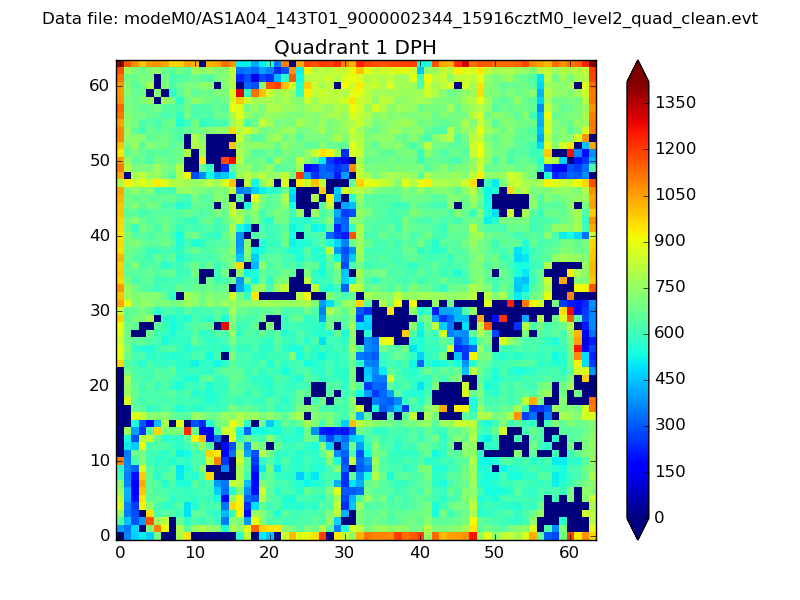
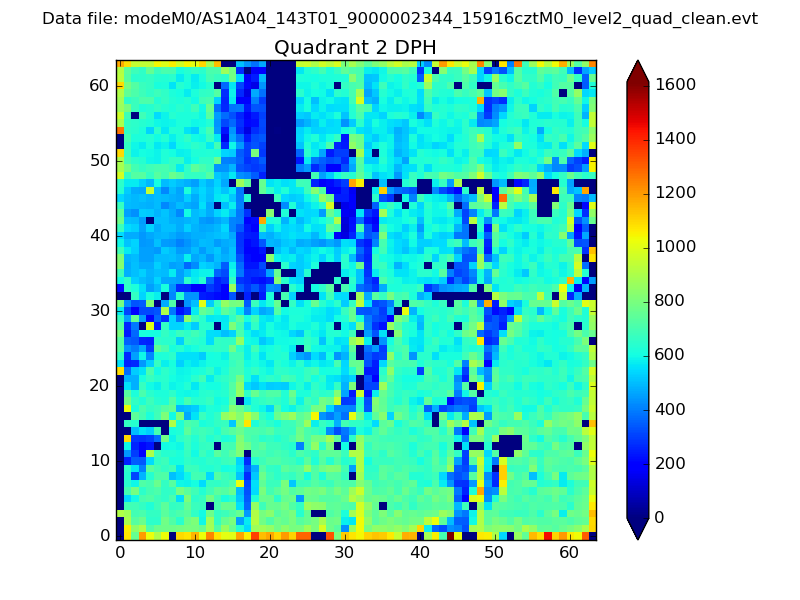
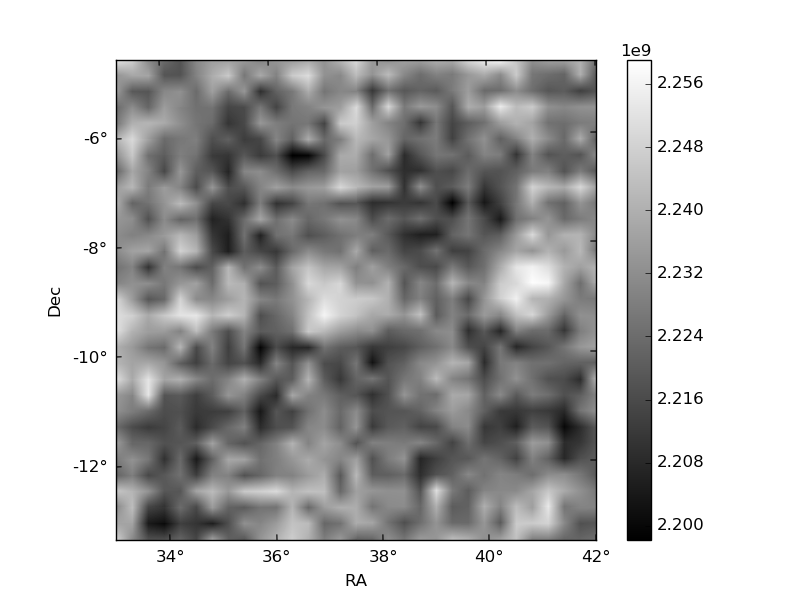
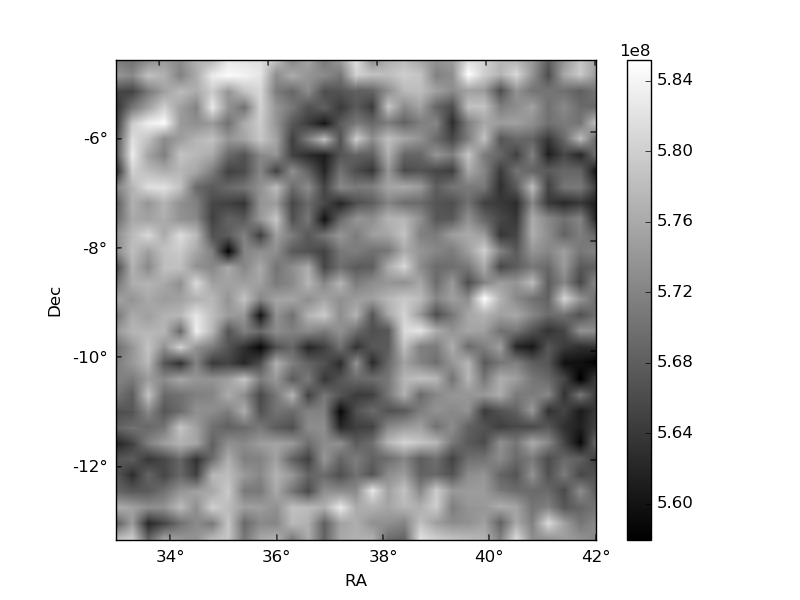
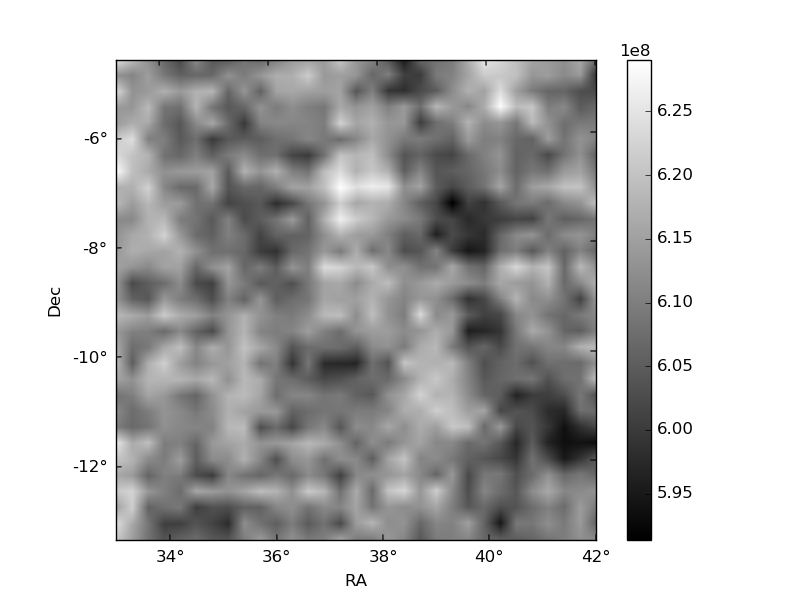
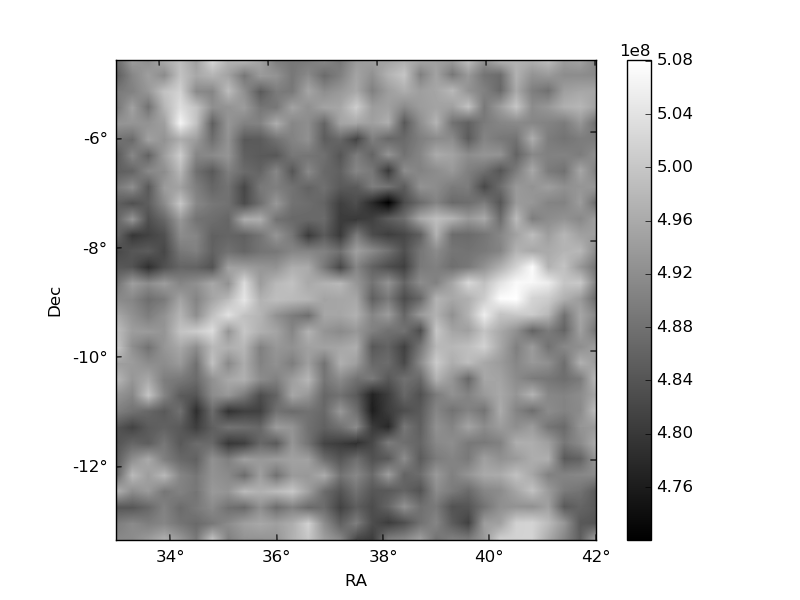
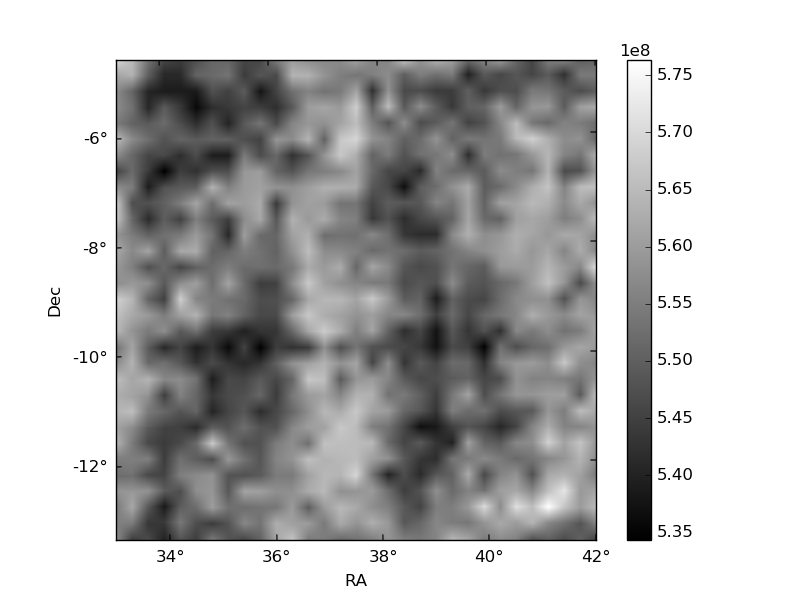
Histogram calculated using DETX and DETY for each event in the final _common_clean file
| Quadrant A | 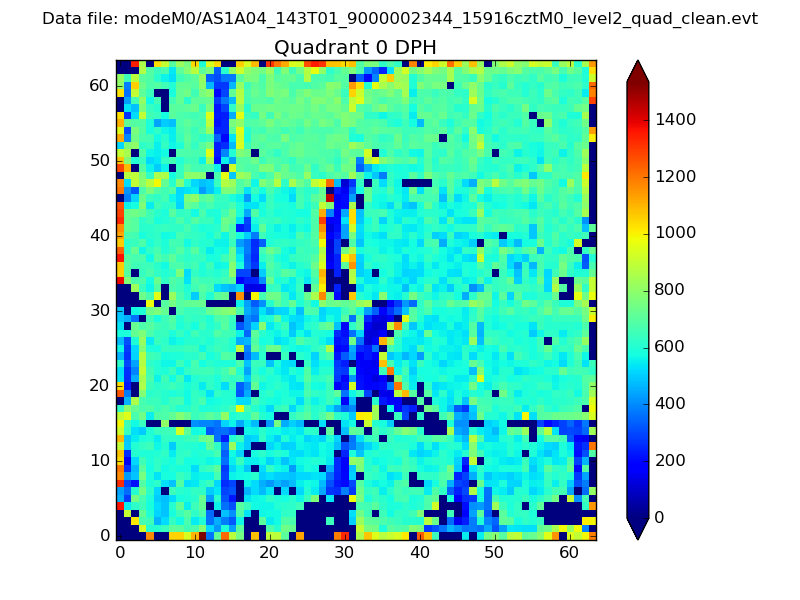 |
 |
Quadrant B |
|---|---|---|---|
| Quadrant D | 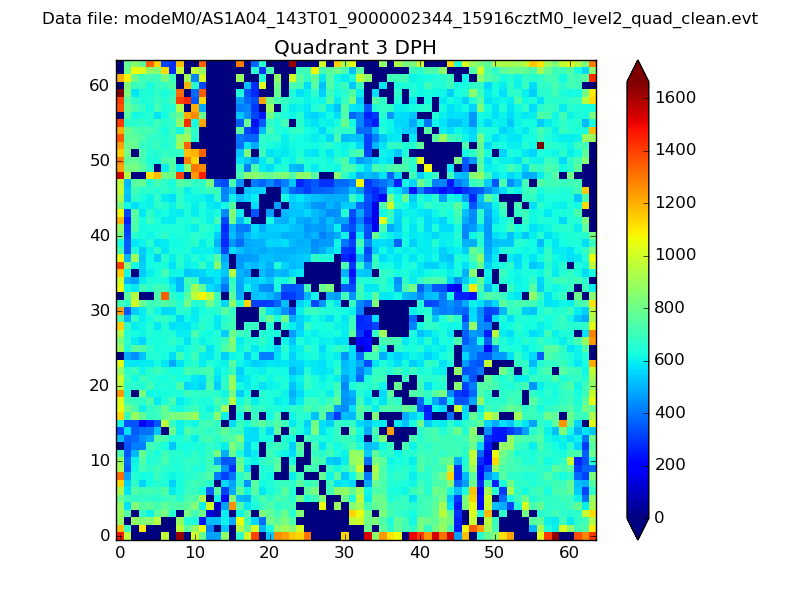 |
 |
Quadrant C |
| Plot type | Count rate plots | Images |
|---|---|---|
| Comparison with Poisson distribution Blue bars denote a histogram of data divided into 1 sec bins. Red curve is a Poisson curve with rate = median count rate of data. |
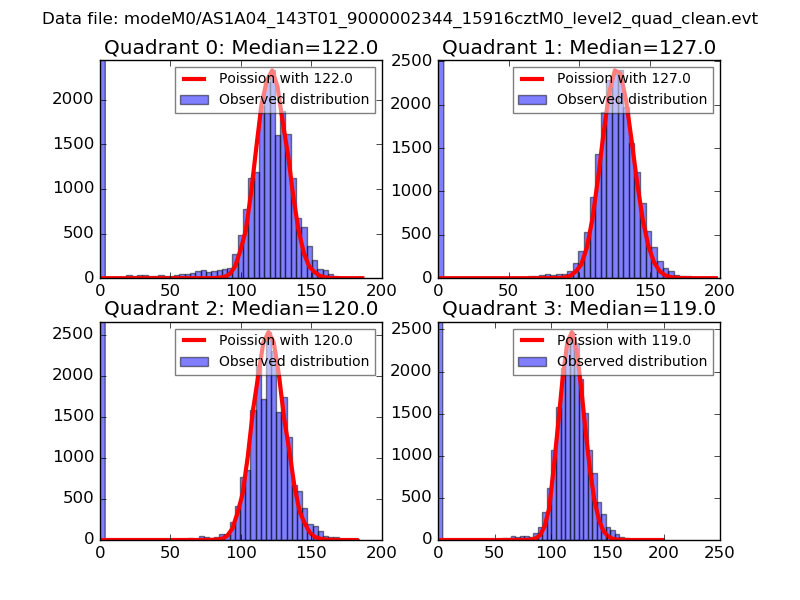 |
 |
| Quadrant-wise count rates Data is divided into 100 sec bins |
 |
|
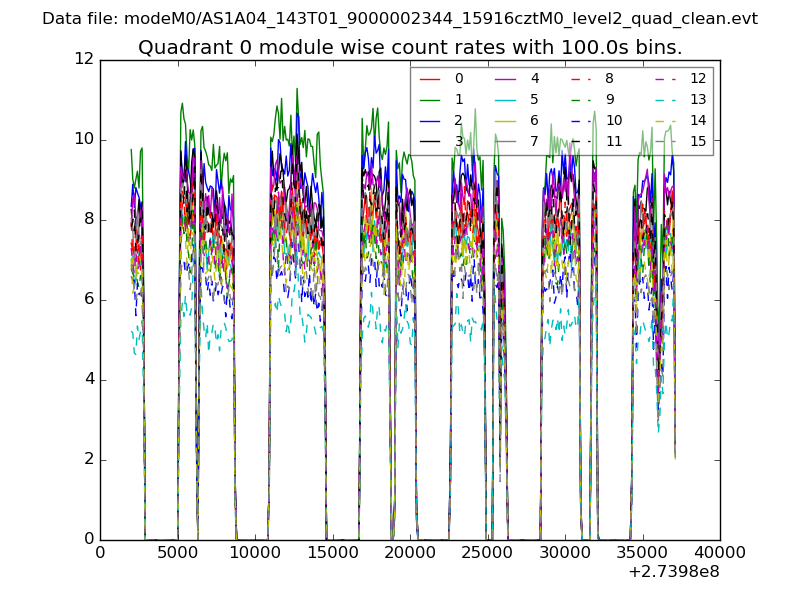
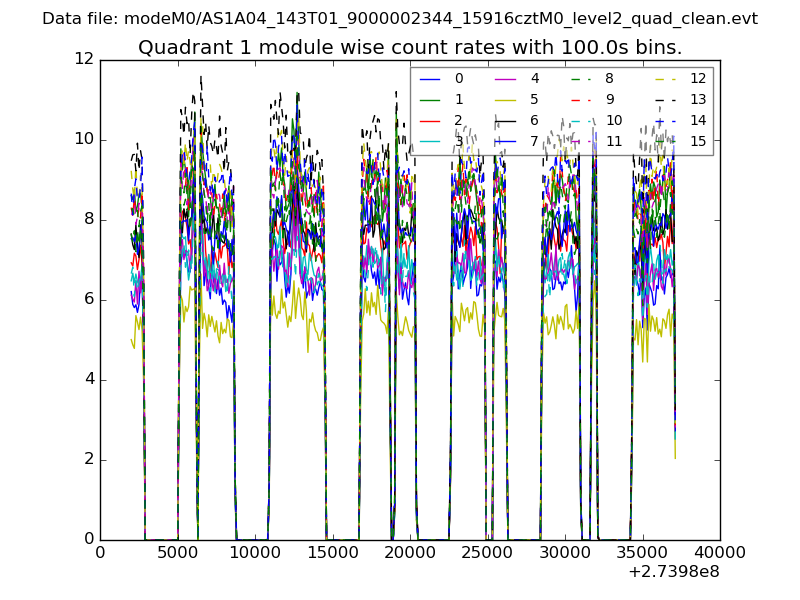
| Module-wise count rates for Quadrant A Data is divided into 100 sec bins |
 |
 |
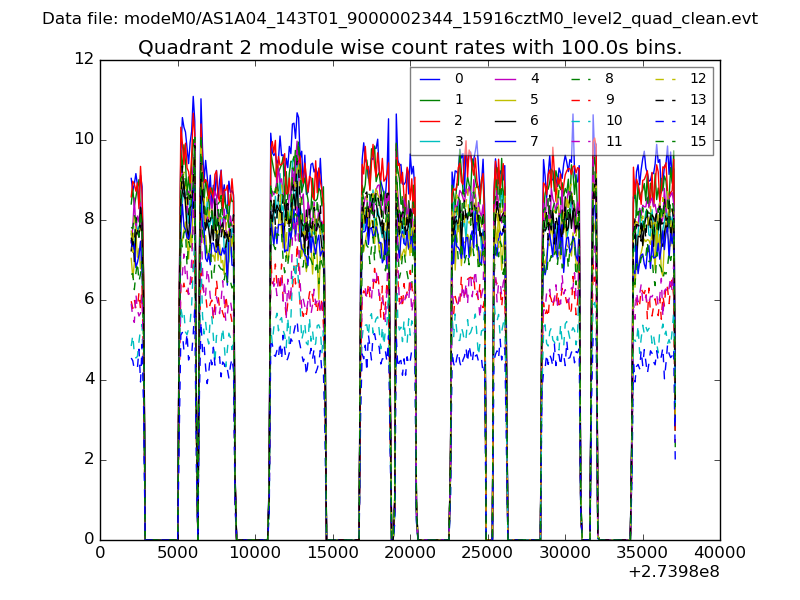
| Module-wise count rates for Quadrant B Data is divided into 100 sec bins |
 |
 |
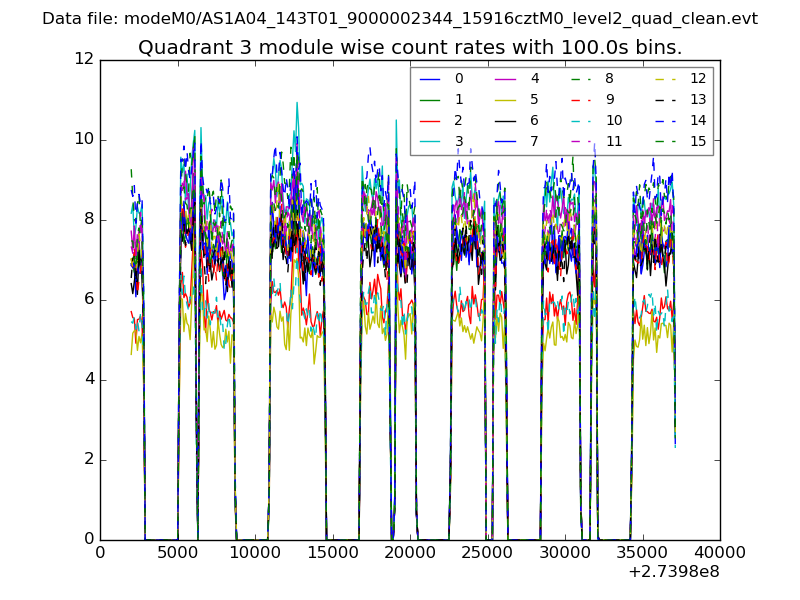
| Module-wise count rates for Quadrant C Data is divided into 100 sec bins |
 |
 |
| Module-wise count rates for Quadrant D Data is divided into 100 sec bins |
 |
 |
| Parameter | Plot |
|---|---|
| CZT HV Monitor | 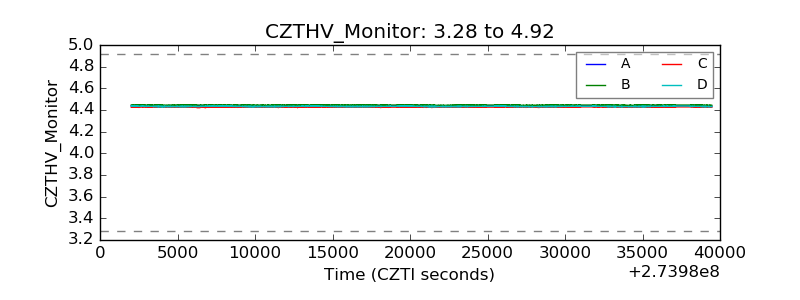 |
| D_VDD | 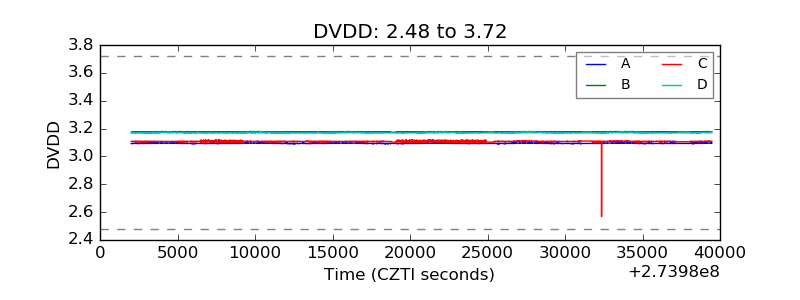 |
| Temperature 1 | 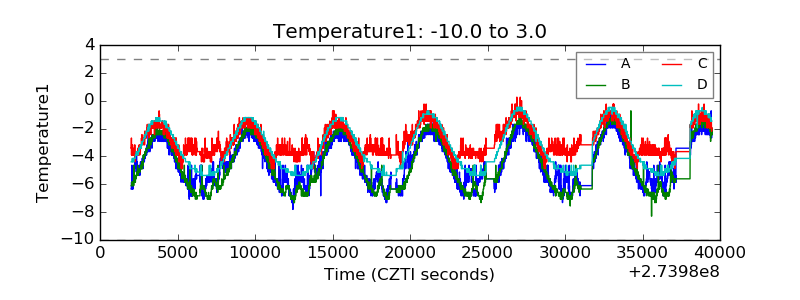 |
| Veto HV Monitor |  |
| Veto LLD | 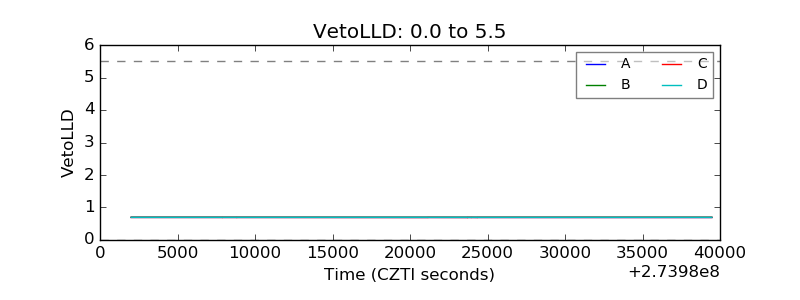 |
| Alpha Counter | 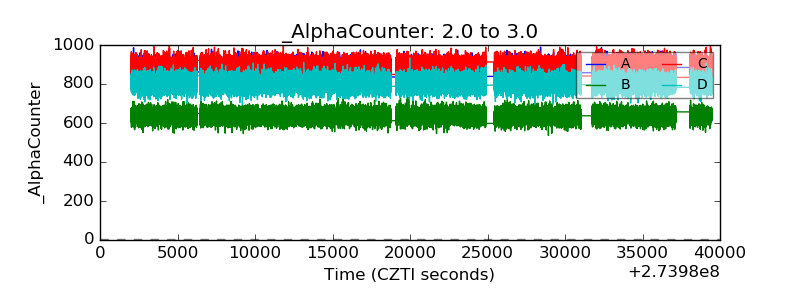 |
| _CPM_Rate | 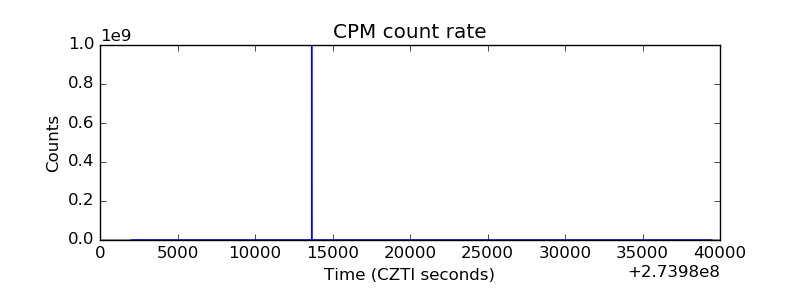 |
| CZT Counter | 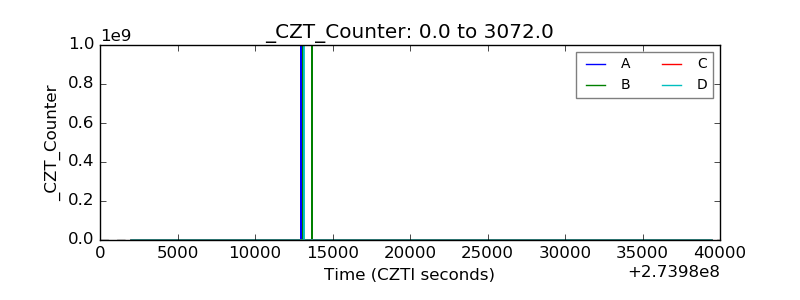 |
| +2.5 Volts monitor |  |
| +5 Volts monitor |  |
| _ROLL_ROT | 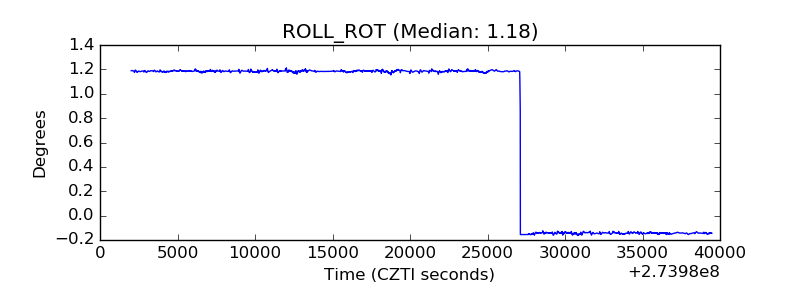 |
| _Roll_DEC | 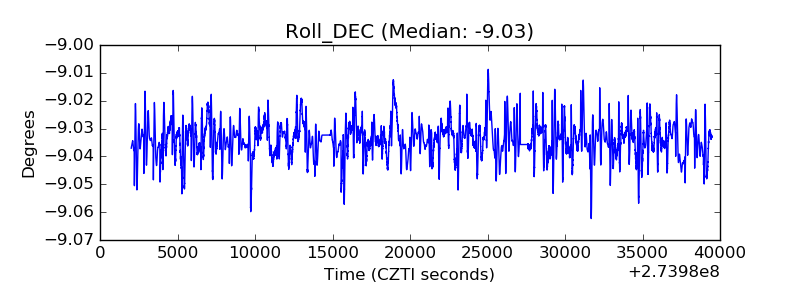 |
| _Roll_RA | 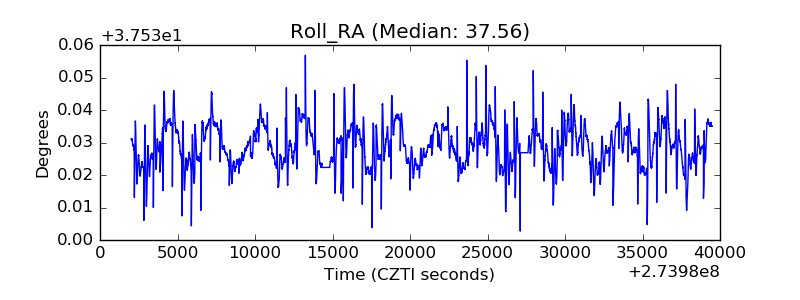 |
| Veto Counter | 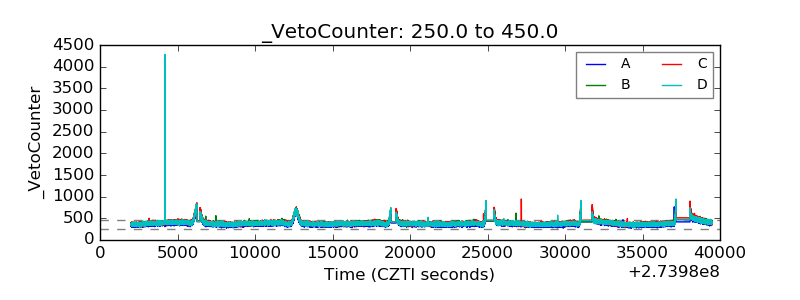 |