| Param | Original file | Final file |
|---|---|---|
| Filename | modeM0/AS1A04_143T01_9000002344_15917cztM0_level2.evt | modeM0/AS1A04_143T01_9000002344_15917cztM0_level2_quad_clean.evt |
| Size (bytes) | 589,769,280 | 63,100,800 |
| Size | 562.4 MB | 60.2 MB |
| Events in quadrant A | 7,330,411 | 324,831 |
| Events in quadrant B | 3,497,306 | 388,287 |
| Events in quadrant C | 3,352,878 | 369,523 |
| Events in quadrant D | 3,233,985 | 367,511 |
| Mode SS | |||
|---|---|---|---|
| Quadrant | BADHDUFLAG | Total packets | Discarded packets |
| A | 0 | 136 | 0 |
| B | 0 | 136 | 0 |
| C | 0 | 136 | 0 |
| D | 0 | 136 | 0 |
| Mode M0 | |||
|---|---|---|---|
| Quadrant | BADHDUFLAG | Total packets | Discarded packets |
| A | 0 | 26238 | 3 |
| B | 0 | 14824 | 2 |
| C | 0 | 14071 | 2 |
| D | 0 | 14088 | 2 |
| Mode M9 | |||
|---|---|---|---|
| Quadrant | BADHDUFLAG | Total packets | Discarded packets |
| A | 0 | 15 | 0 |
| B | 0 | 15 | 0 |
| C | 0 | 15 | 0 |
| D | 0 | 16 | 0 |
| Quadrant | Total seconds | Saturated seconds | Saturation percentage |
|---|---|---|---|
| A | 6586 | 1061 | 16.109930% |
| B | 6586 | 67 | 1.017309% |
| C | 6586 | 108 | 1.639842% |
| D | 6586 | 67 | 1.017309% |
Noise dominated data is calculated using 1-second bins in cleaned event files. If a bin has >2000 counts, and if more than 50% of those come from <1% of pixels, then it is considered to be noise-dominated and hence unusable.
| Quadrant | # 1 sec bins | Bins with >0 counts | Bins with >2000 counts | High rate bins dominated by noise | Noise dominated (total time) | Noise dominated (detector-on time) | Marked lightcurve |
|---|---|---|---|---|---|---|---|
| A | 7647 | 6587 | 778 | 778 | 10.17% | 11.81% | 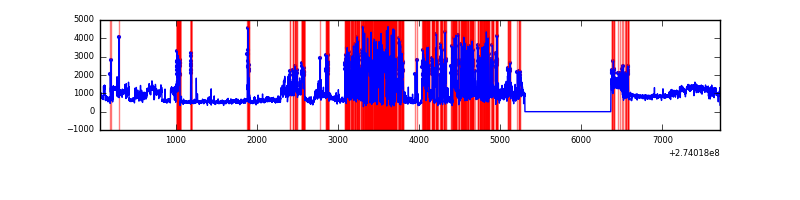 |
| B | 7647 | 6587 | 1 | 1 | 0.01% | 0.02% | 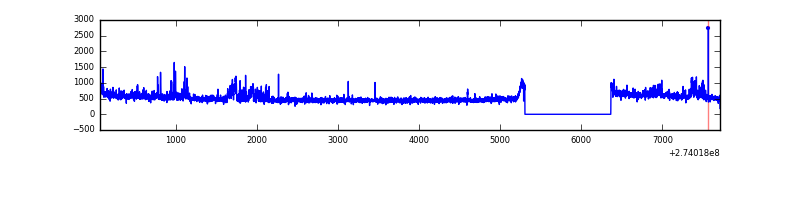 |
| C | 7647 | 6587 | 0 | 0 | 0.00% | 0.00% | 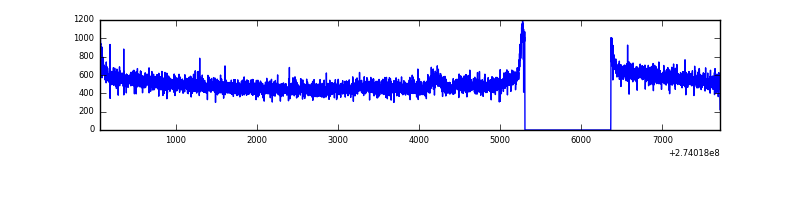 |
| D | 7647 | 6587 | 7 | 7 | 0.09% | 0.11% | 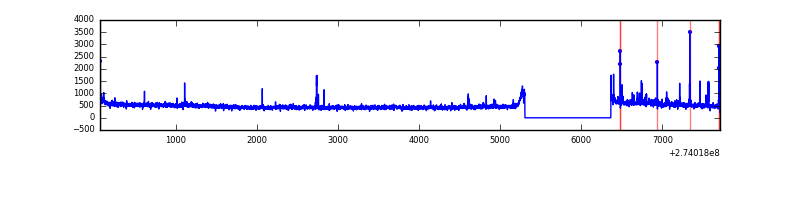 |
Top three noisy pixels from each quadrant. If the there are fewer than three noisy pixels in the level2.evt file, extra rows are filled as -1
| Pixel properties | Quadrant properties | ||||||
|---|---|---|---|---|---|---|---|
| Quadrant | DetID | PixID | Counts | Sigma | Mean | Median | Sigma |
| A | 15 | 239 | 4286343 | 27160.7 | 781 | 765 | 157.8 |
| A | 9 | 143 | 43592 | 271.42 | 781 | 765 | 157.8 |
| A | 0 | 226 | 6949 | 39.19 | 781 | 765 | 157.8 |
| B | 4 | 216 | 89400 | 557.4 | 830 | 809 | 158.9 |
| B | 5 | 236 | 43057 | 265.81 | 830 | 809 | 158.9 |
| B | 0 | 229 | 37715 | 232.2 | 830 | 809 | 158.9 |
| C | 14 | 238 | 123059 | 660.2 | 796 | 800 | 185.2 |
| C | 3 | 233 | 119613 | 641.59 | 796 | 800 | 185.2 |
| C | 13 | 61 | 5536 | 25.57 | 796 | 800 | 185.2 |
| D | 5 | 51 | 60142 | 297.28 | 813 | 788 | 199.7 |
| D | 2 | 234 | 32574 | 159.2 | 813 | 788 | 199.7 |
| D | 13 | 172 | 25173 | 122.13 | 813 | 788 | 199.7 |
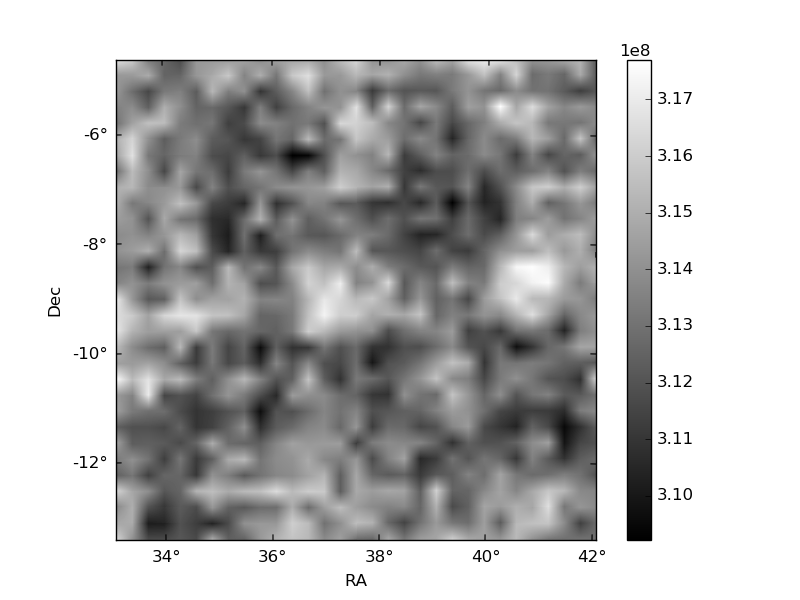
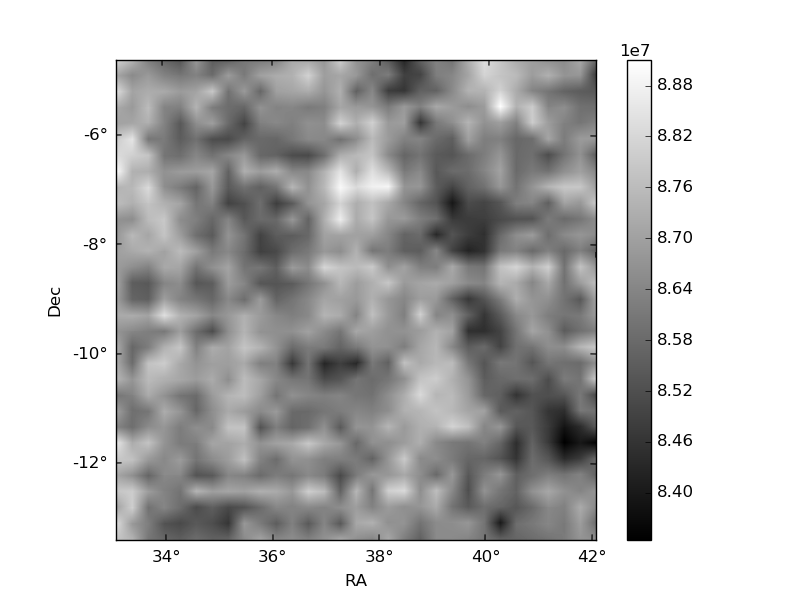
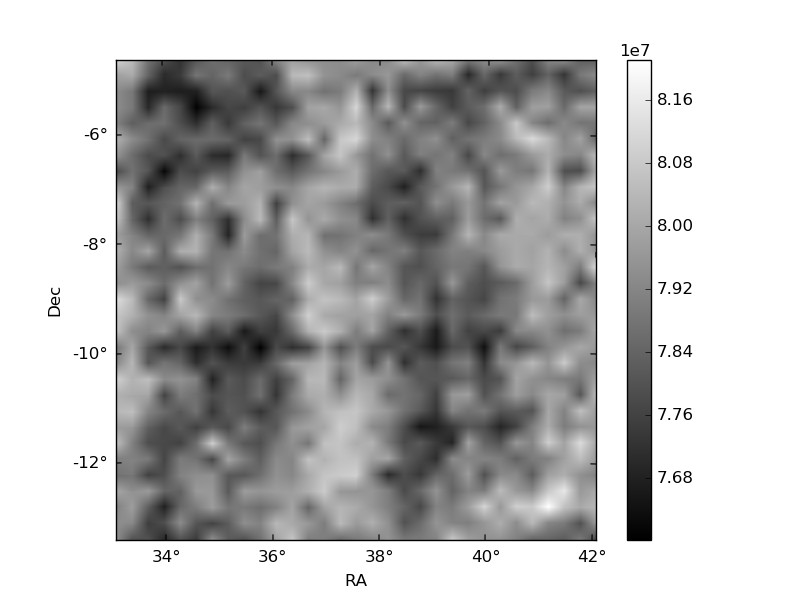
Histogram calculated using DETX and DETY for each event in the final _common_clean file
| Quadrant A | 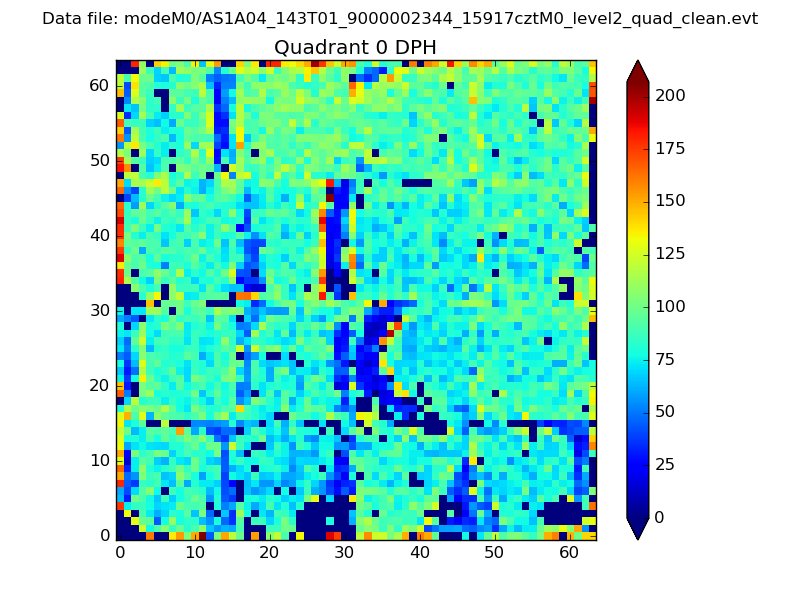 |
 |
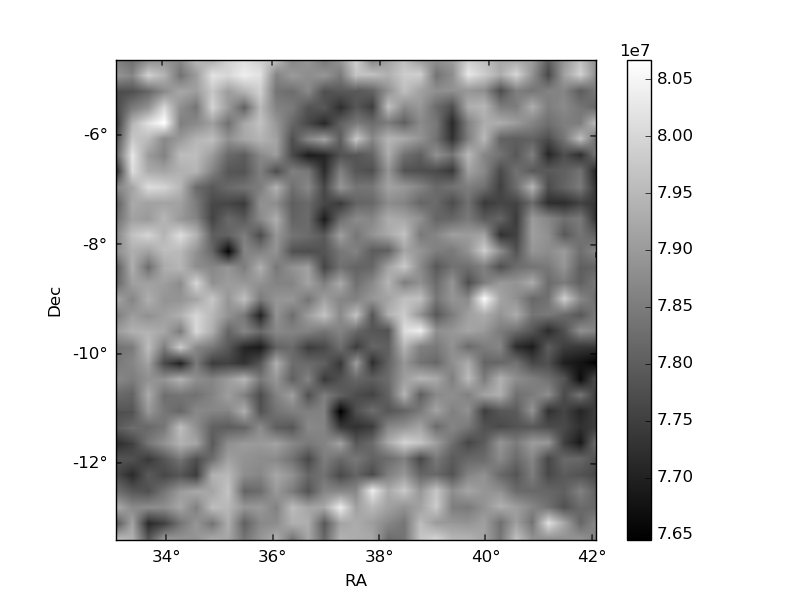
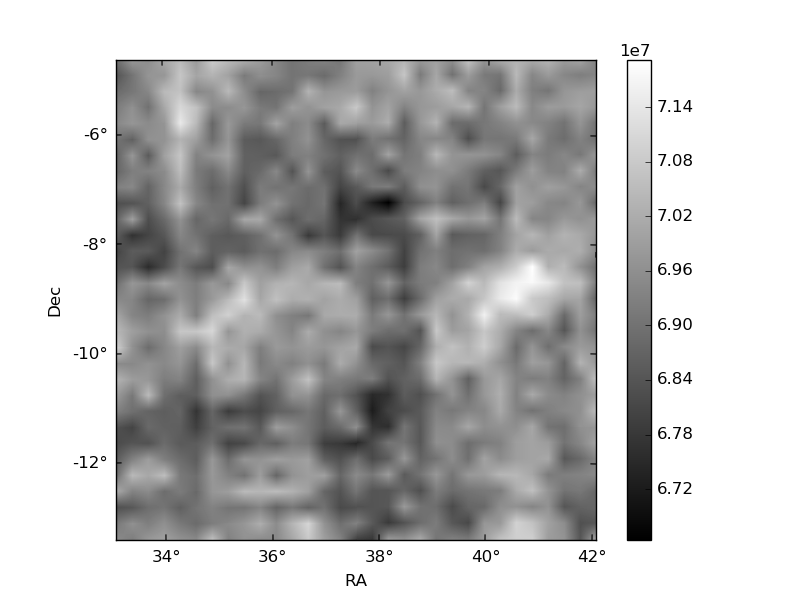
Quadrant B |
|---|---|---|---|
| Quadrant D | 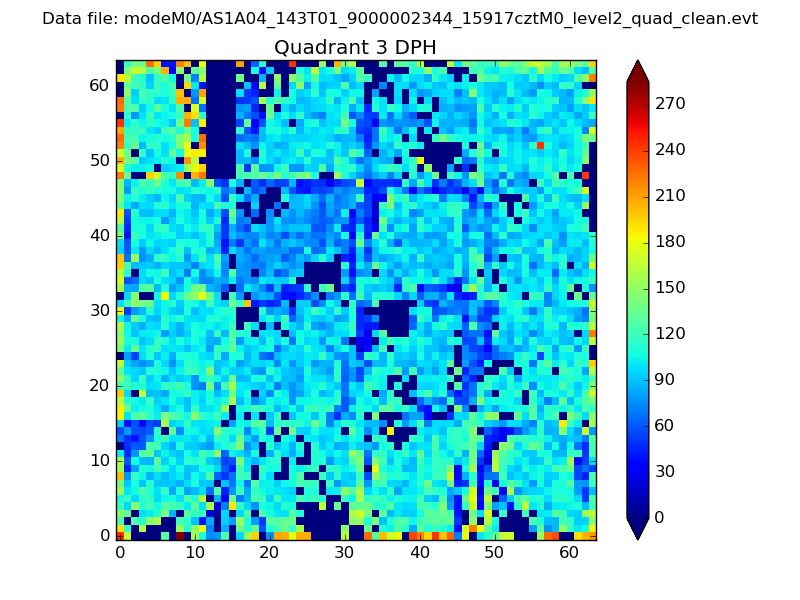 |
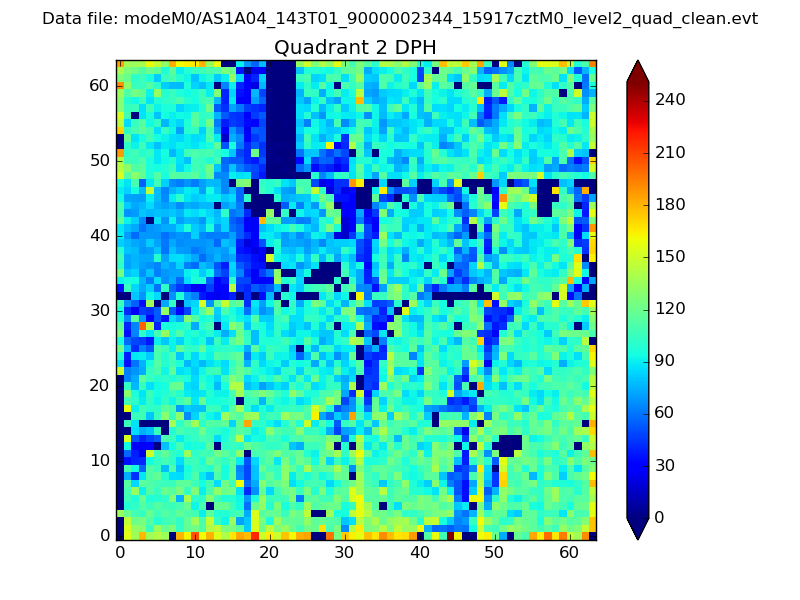 |
Quadrant C |
| Plot type | Count rate plots | Images |
|---|---|---|
| Comparison with Poisson distribution Blue bars denote a histogram of data divided into 1 sec bins. Red curve is a Poisson curve with rate = median count rate of data. |
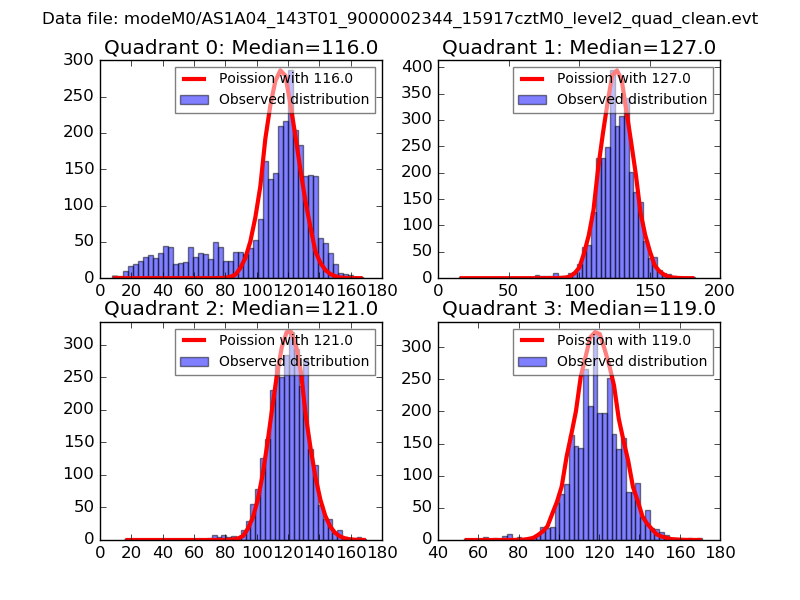 |
 |
| Quadrant-wise count rates Data is divided into 100 sec bins |
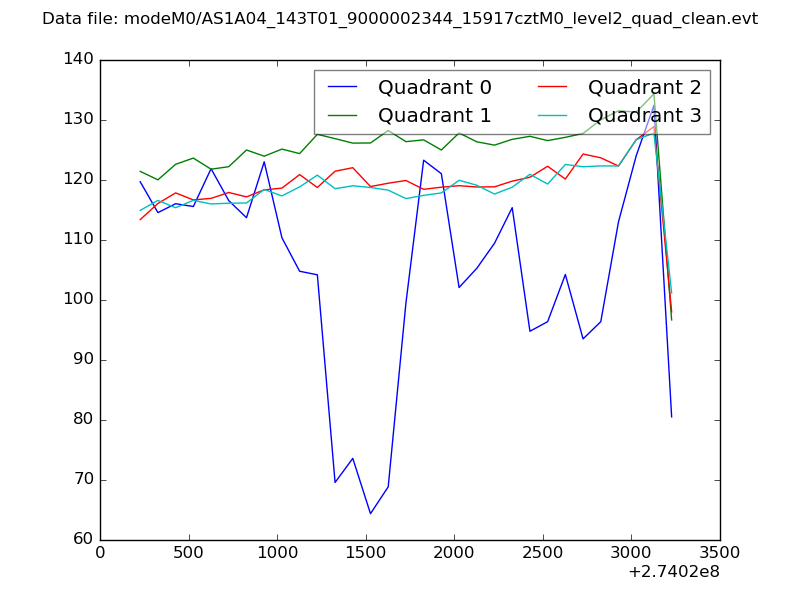 |
|
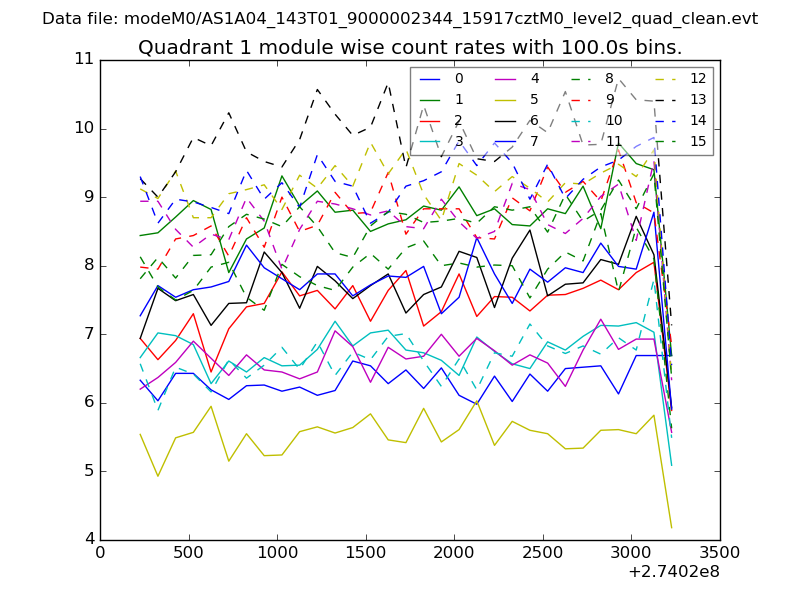
| Module-wise count rates for Quadrant A Data is divided into 100 sec bins |
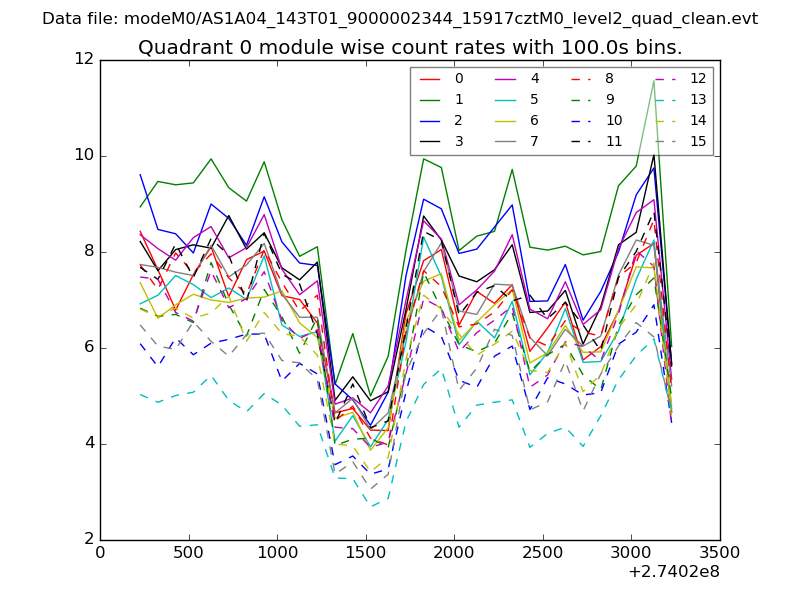 |
 |
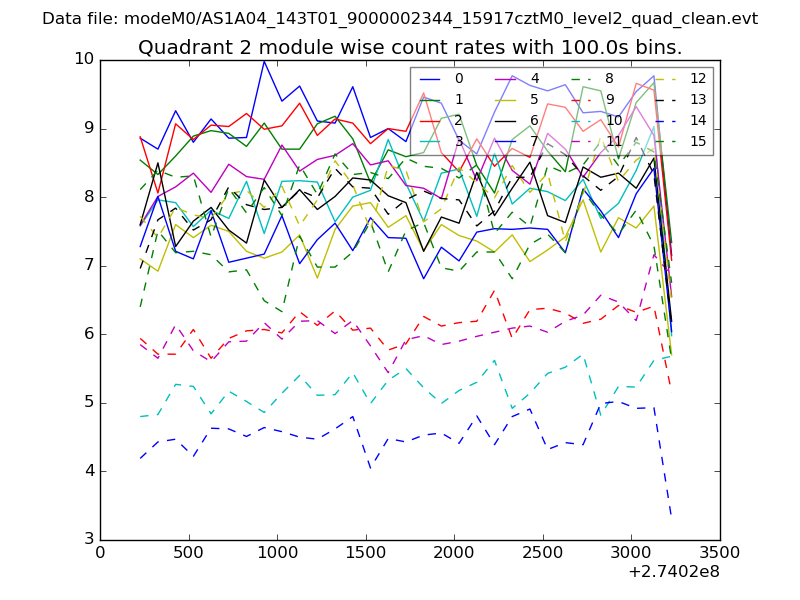
| Module-wise count rates for Quadrant B Data is divided into 100 sec bins |
 |
 |
| Module-wise count rates for Quadrant C Data is divided into 100 sec bins |
 |
 |
| Module-wise count rates for Quadrant D Data is divided into 100 sec bins |
 |
 |
| Parameter | Plot |
|---|---|
| CZT HV Monitor | 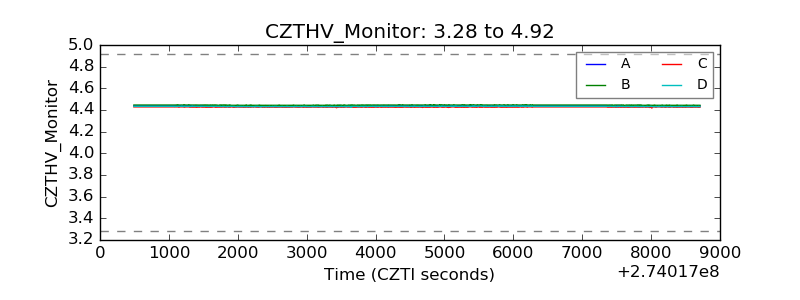 |
| D_VDD | 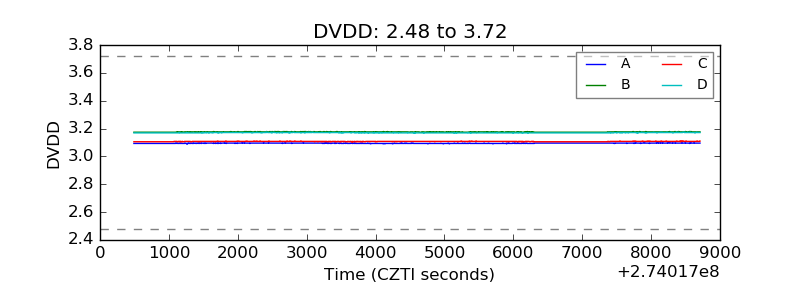 |
| Temperature 1 | 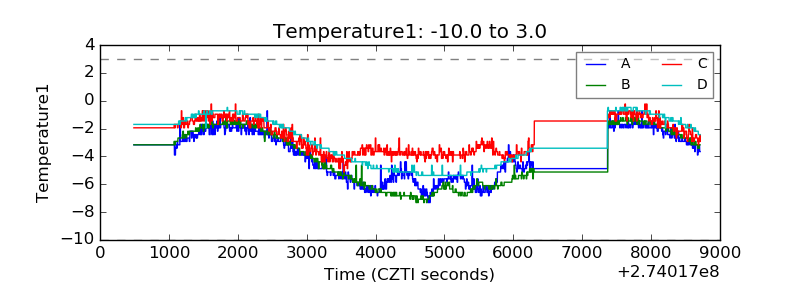 |
| Veto HV Monitor | 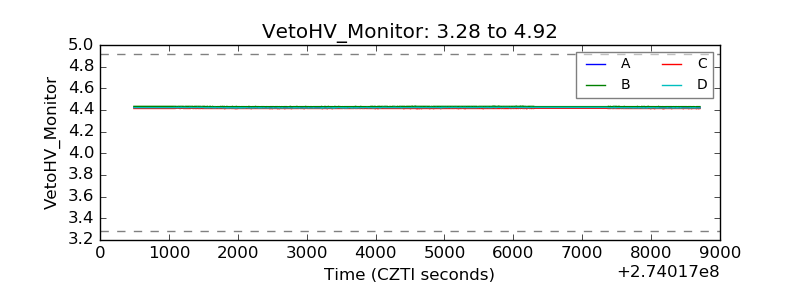 |
| Veto LLD |  |
| Alpha Counter | 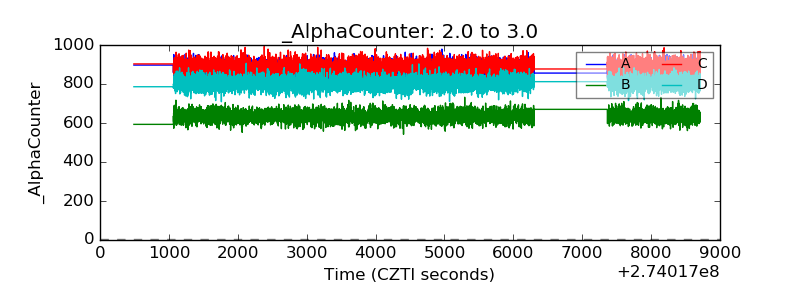 |
| _CPM_Rate | 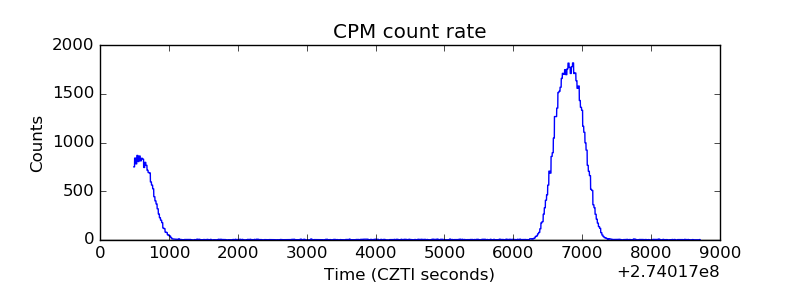 |
| CZT Counter | 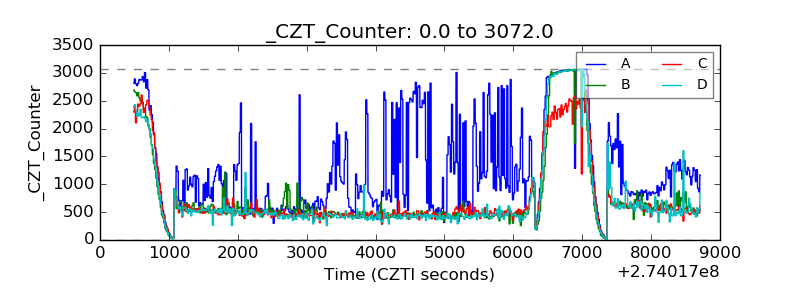 |
| +2.5 Volts monitor |  |
| +5 Volts monitor |  |
| _ROLL_ROT | 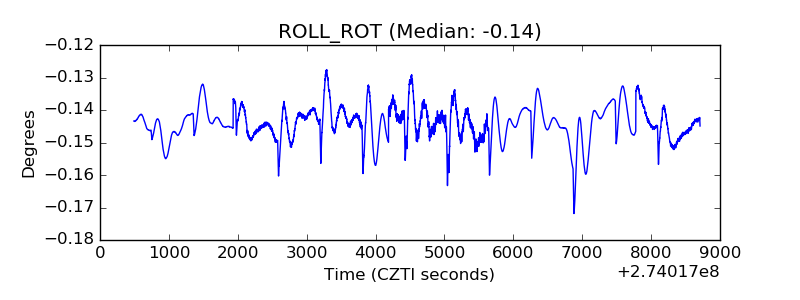 |
| _Roll_DEC | 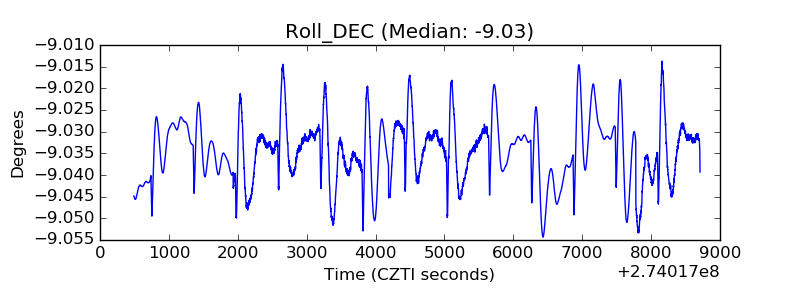 |
| _Roll_RA | 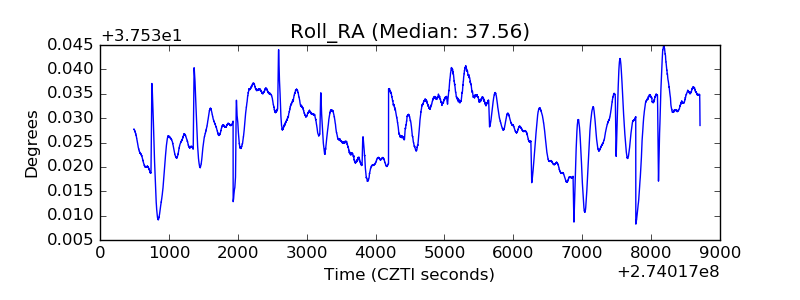 |
| Veto Counter | 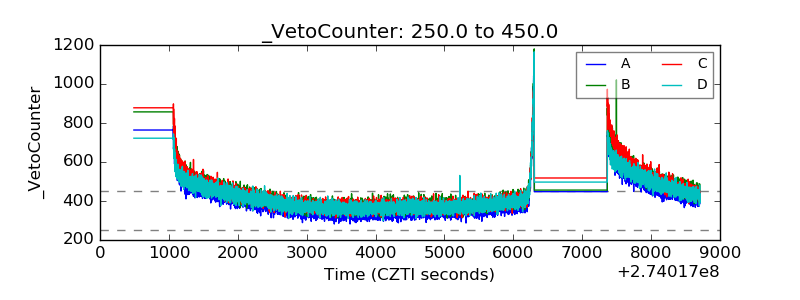 |