| Param | Original file | Final file |
|---|---|---|
| Filename | modeM0/AS1A04_143T01_9000002344_15921cztM0_level2.evt | modeM0/AS1A04_143T01_9000002344_15921cztM0_level2_quad_clean.evt |
| Size (bytes) | 536,330,880 | 93,899,520 |
| Size | 511.5 MB | 89.5 MB |
| Events in quadrant A | 5,866,529 | 586,411 |
| Events in quadrant B | 3,375,885 | 640,938 |
| Events in quadrant C | 3,401,546 | 602,445 |
| Events in quadrant D | 3,186,155 | 588,598 |
| Mode SS | |||
|---|---|---|---|
| Quadrant | BADHDUFLAG | Total packets | Discarded packets |
| A | 0 | 122 | 0 |
| B | 0 | 122 | 0 |
| C | 0 | 122 | 0 |
| D | 0 | 122 | 0 |
| Mode M0 | |||
|---|---|---|---|
| Quadrant | BADHDUFLAG | Total packets | Discarded packets |
| A | 0 | 21435 | 3 |
| B | 0 | 13940 | 2 |
| C | 0 | 14022 | 2 |
| D | 0 | 13388 | 2 |
| Mode M9 | |||
|---|---|---|---|
| Quadrant | BADHDUFLAG | Total packets | Discarded packets |
| A | 0 | 25 | 0 |
| B | 0 | 25 | 0 |
| C | 0 | 25 | 0 |
| D | 0 | 26 | 0 |
| Quadrant | Total seconds | Saturated seconds | Saturation percentage |
|---|---|---|---|
| A | 6093 | 905 | 14.853110% |
| B | 6093 | 102 | 1.674052% |
| C | 6093 | 92 | 1.509929% |
| D | 6093 | 55 | 0.902675% |
Noise dominated data is calculated using 1-second bins in cleaned event files. If a bin has >2000 counts, and if more than 50% of those come from <1% of pixels, then it is considered to be noise-dominated and hence unusable.
| Quadrant | # 1 sec bins | Bins with >0 counts | Bins with >2000 counts | High rate bins dominated by noise | Noise dominated (total time) | Noise dominated (detector-on time) | Marked lightcurve |
|---|---|---|---|---|---|---|---|
| A | 7454 | 6095 | 598 | 598 | 8.02% | 9.81% | 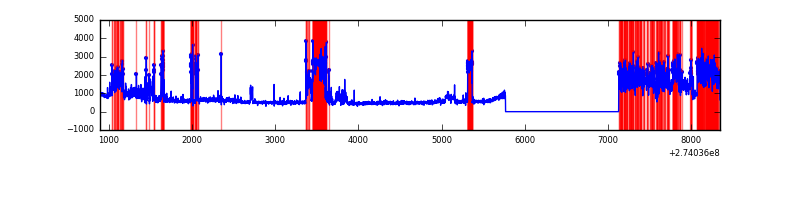 |
| B | 7454 | 6094 | 11 | 11 | 0.15% | 0.18% | 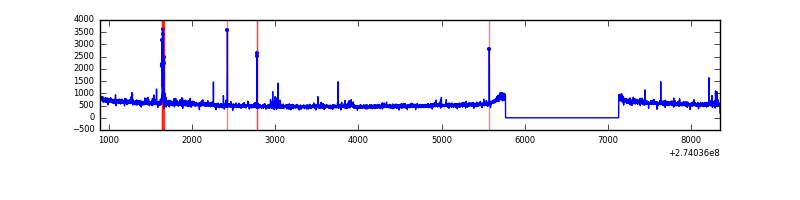 |
| C | 7454 | 6094 | 0 | 0 | 0.00% | 0.00% | 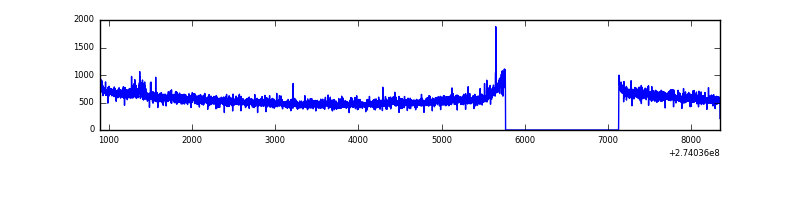 |
| D | 7454 | 6095 | 20 | 20 | 0.27% | 0.33% | 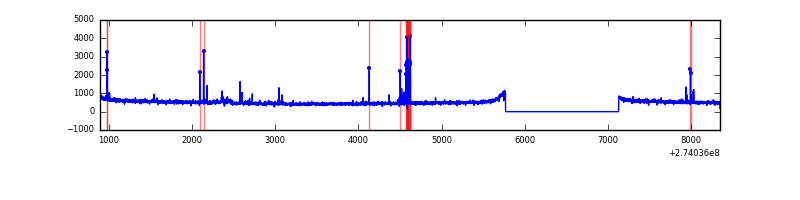 |
Top three noisy pixels from each quadrant. If the there are fewer than three noisy pixels in the level2.evt file, extra rows are filled as -1
| Pixel properties | Quadrant properties | ||||||
|---|---|---|---|---|---|---|---|
| Quadrant | DetID | PixID | Counts | Sigma | Mean | Median | Sigma |
| A | 15 | 239 | 2779516 | 17638.57 | 791 | 779 | 157.5 |
| A | 13 | 248 | 44045 | 274.64 | 791 | 779 | 157.5 |
| A | 0 | 226 | 7143 | 40.4 | 791 | 779 | 157.5 |
| B | 0 | 182 | 32299 | 201.1 | 834 | 816 | 156.6 |
| B | 0 | 189 | 27330 | 169.36 | 834 | 816 | 156.6 |
| B | 12 | 111 | 17175 | 104.49 | 834 | 816 | 156.6 |
| C | 3 | 233 | 151728 | 818.78 | 798 | 806 | 184.3 |
| C | 14 | 238 | 123099 | 663.46 | 798 | 806 | 184.3 |
| C | 7 | 247 | 14528 | 74.44 | 798 | 806 | 184.3 |
| D | 10 | 70 | 55460 | 282.36 | 803 | 784 | 193.6 |
| D | 5 | 51 | 45344 | 230.12 | 803 | 784 | 193.6 |
| D | 2 | 234 | 30486 | 153.39 | 803 | 784 | 193.6 |
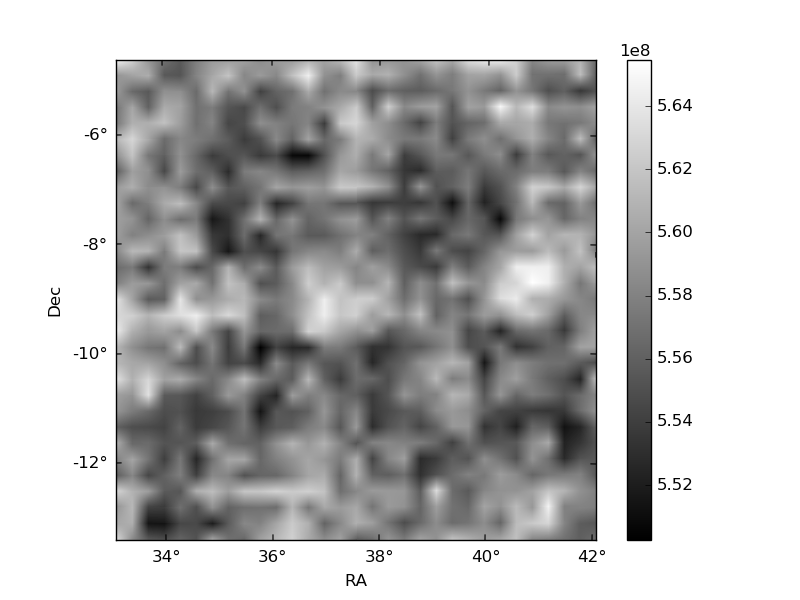
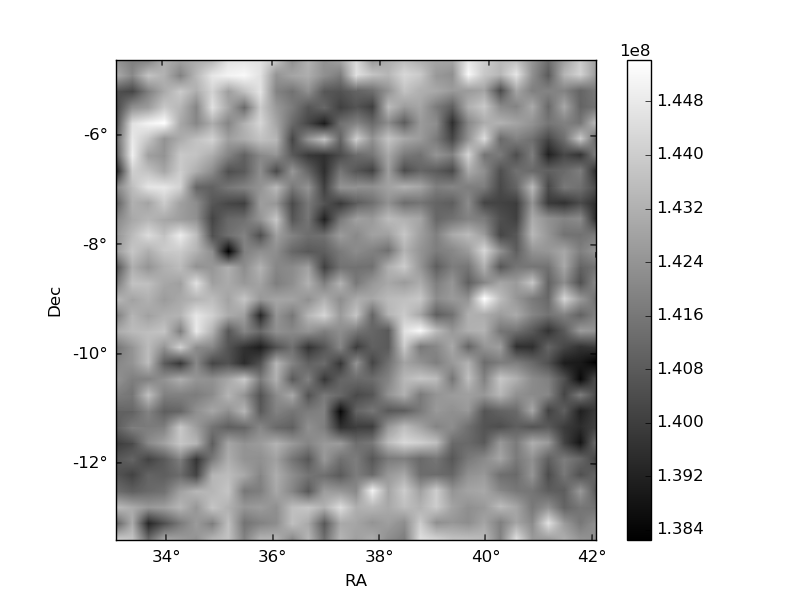
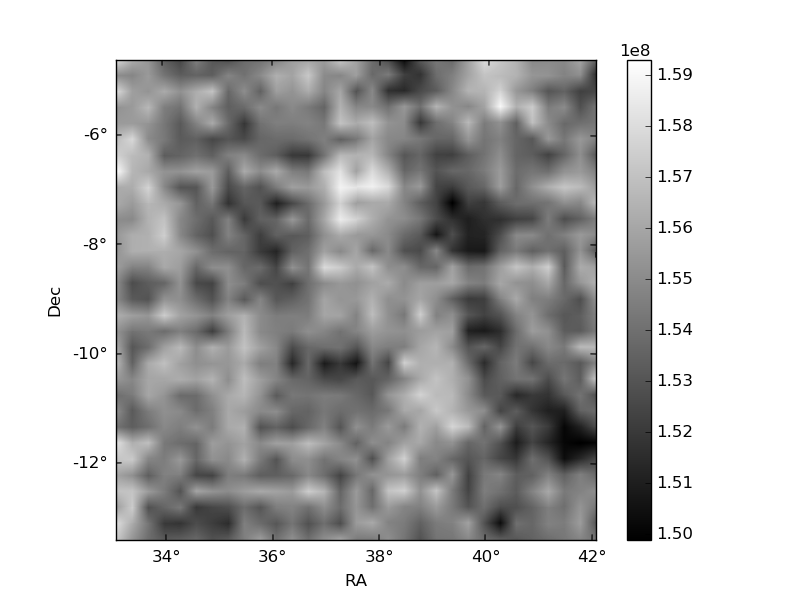
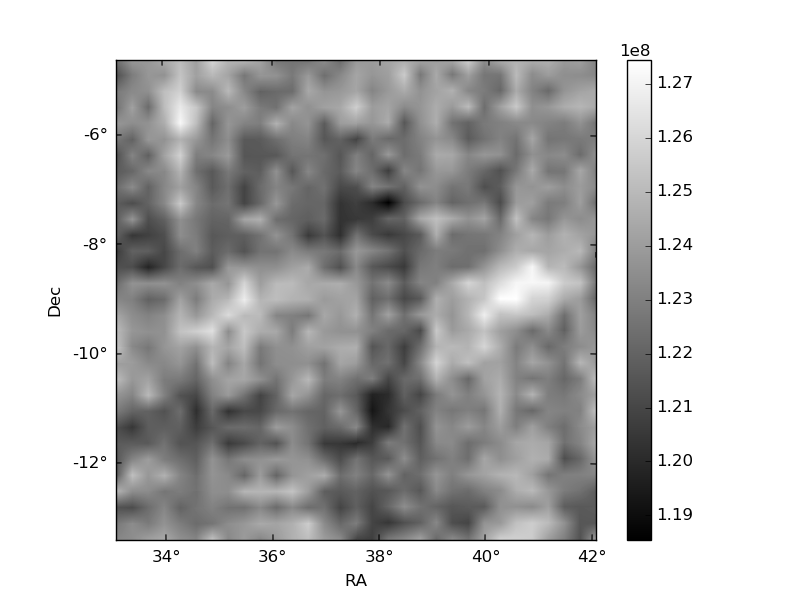
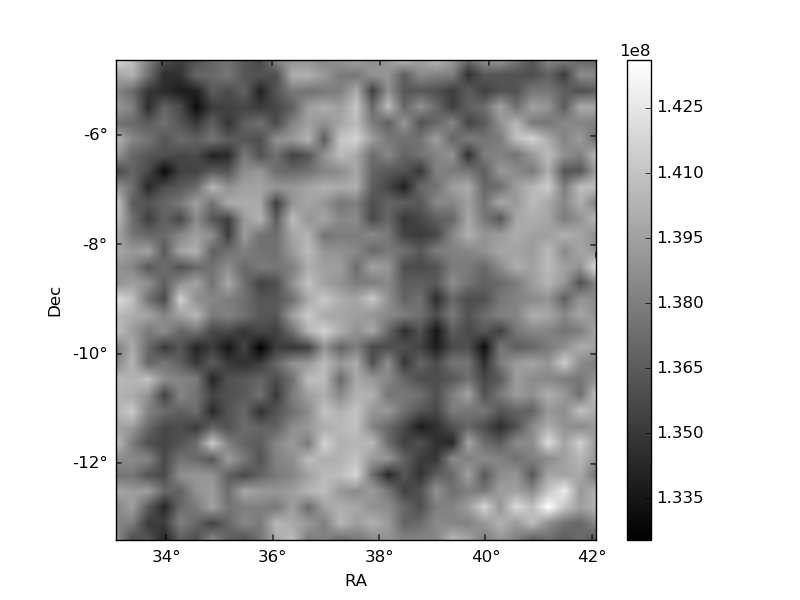
Histogram calculated using DETX and DETY for each event in the final _common_clean file
| Quadrant A | 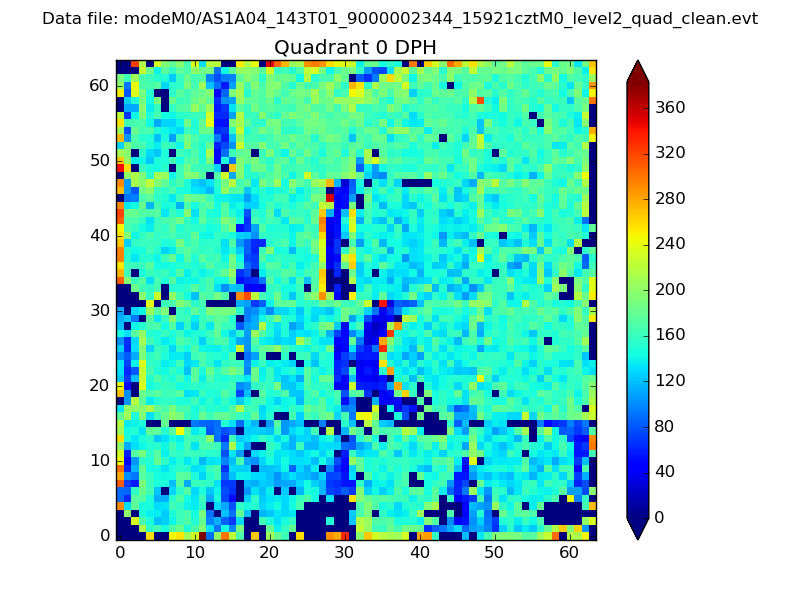 |
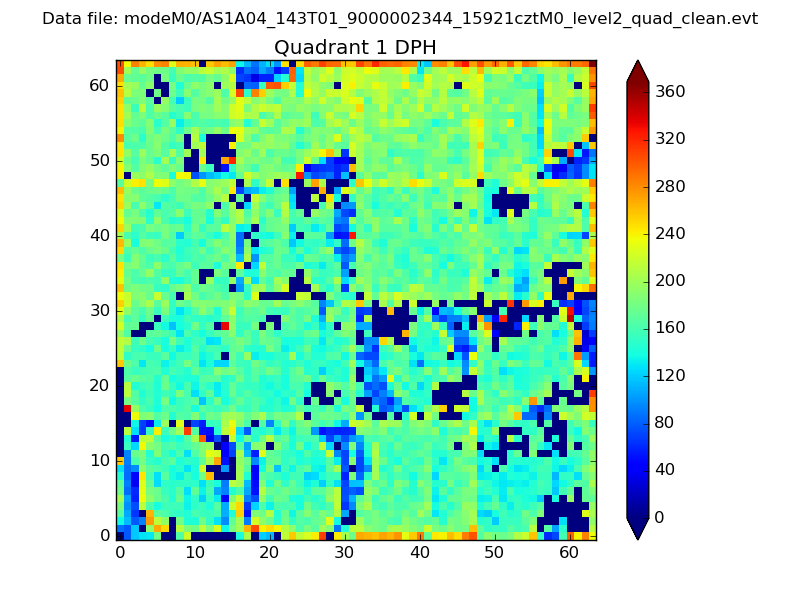 |
Quadrant B |
|---|---|---|---|
| Quadrant D | 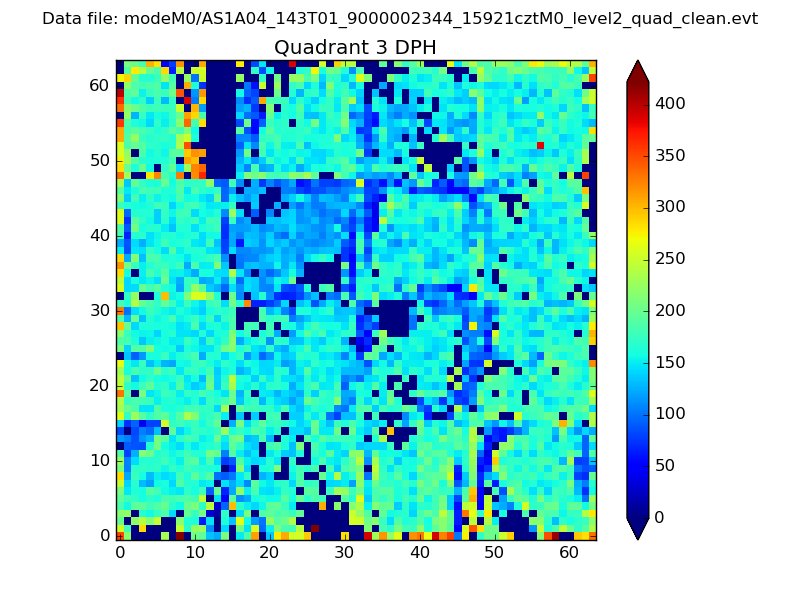 |
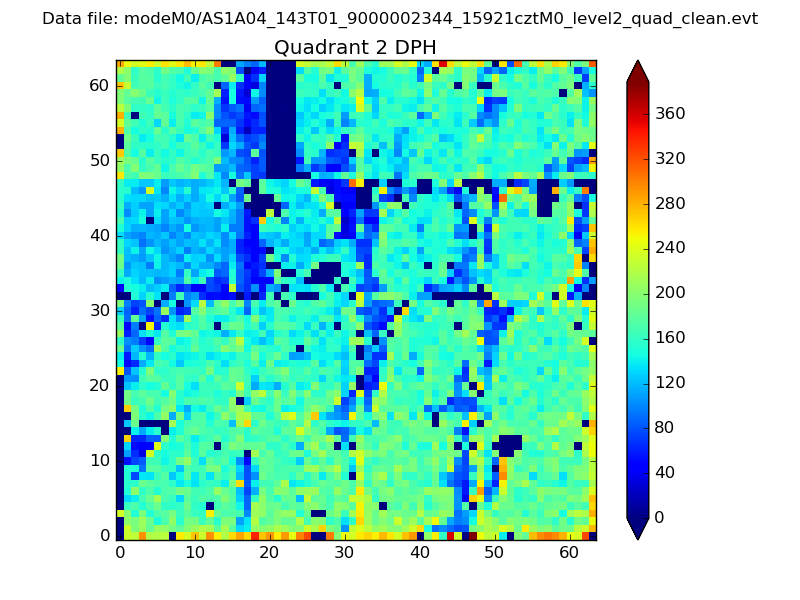 |
Quadrant C |
| Plot type | Count rate plots | Images |
|---|---|---|
| Comparison with Poisson distribution Blue bars denote a histogram of data divided into 1 sec bins. Red curve is a Poisson curve with rate = median count rate of data. |
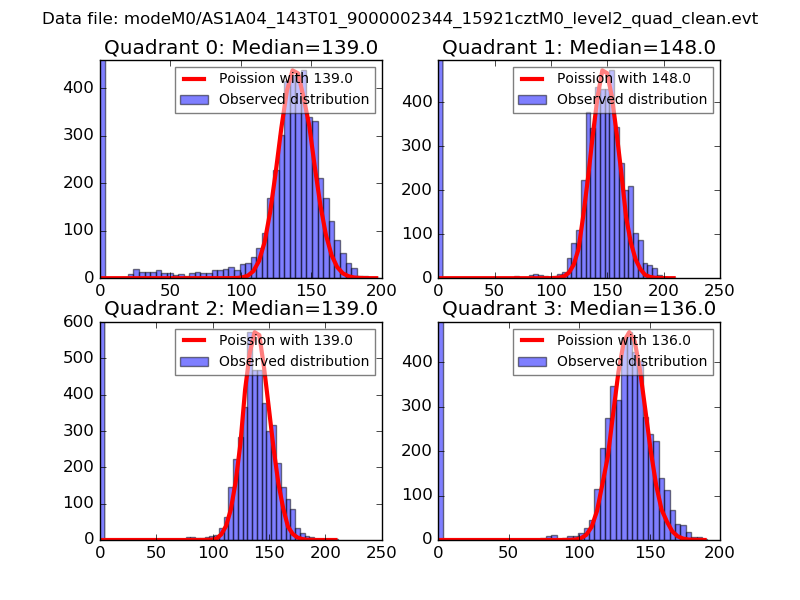 |
 |
| Quadrant-wise count rates Data is divided into 100 sec bins |
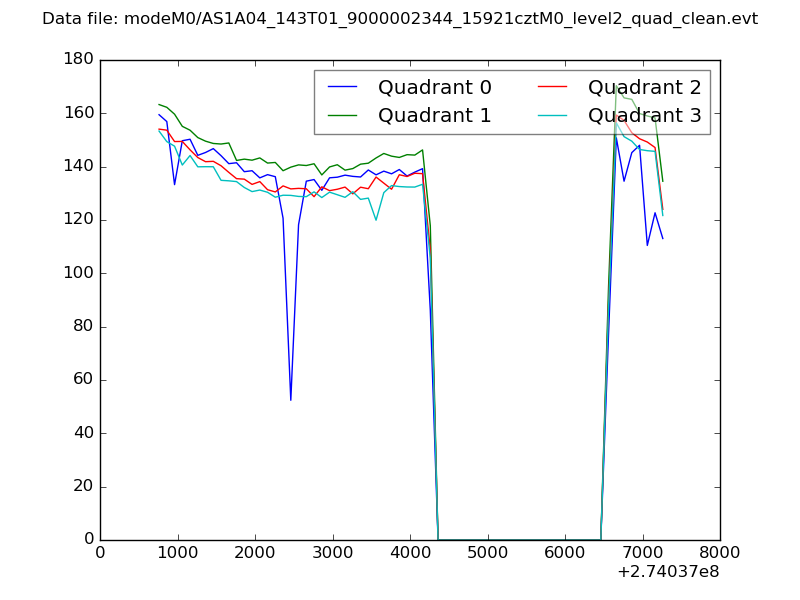 |
|
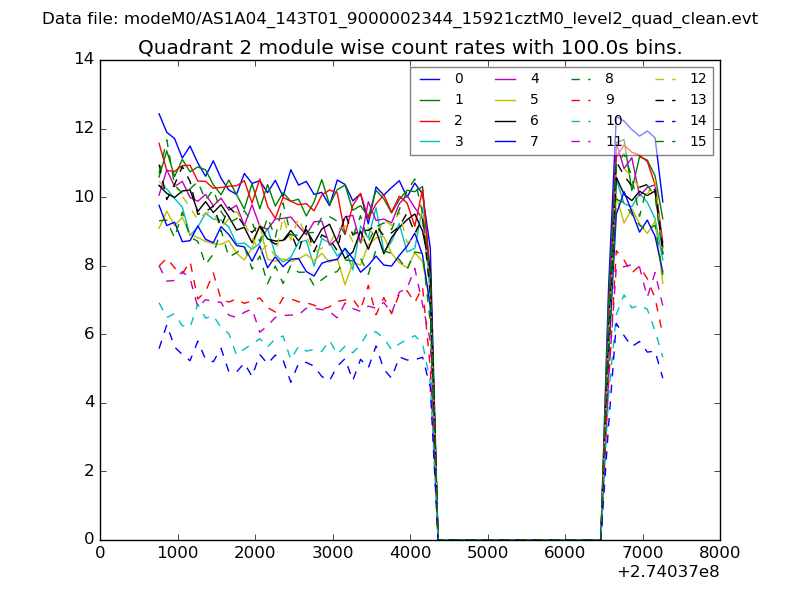
| Module-wise count rates for Quadrant A Data is divided into 100 sec bins |
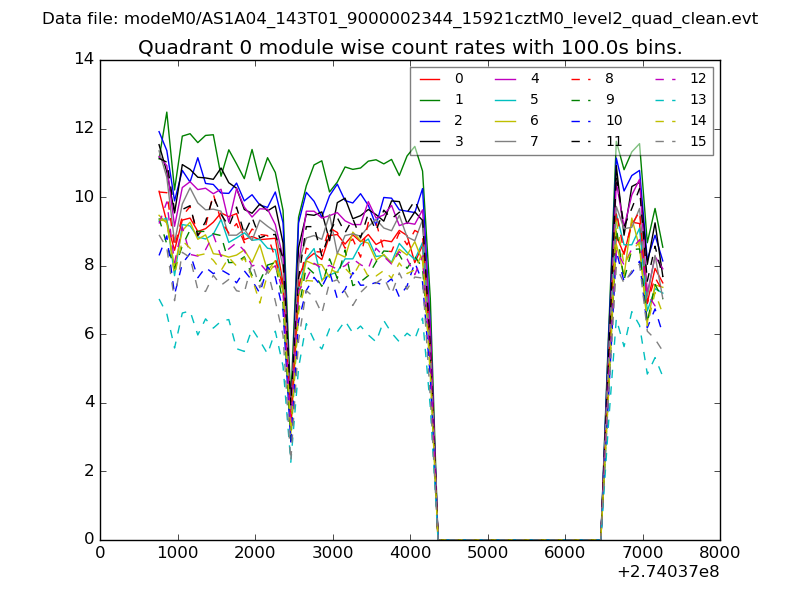 |
 |
| Module-wise count rates for Quadrant B Data is divided into 100 sec bins |
 |
 |
| Module-wise count rates for Quadrant C Data is divided into 100 sec bins |
 |
 |
| Module-wise count rates for Quadrant D Data is divided into 100 sec bins |
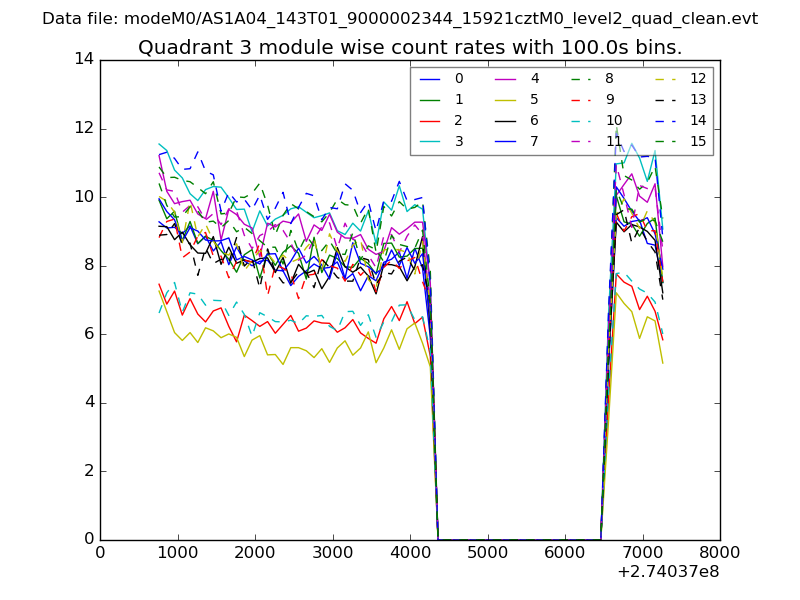 |
 |
| Parameter | Plot |
|---|---|
| CZT HV Monitor | 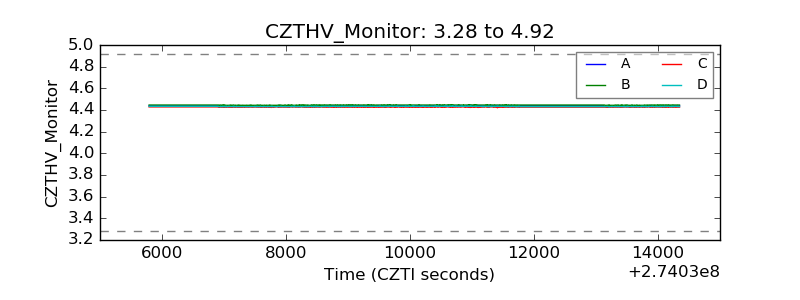 |
| D_VDD | 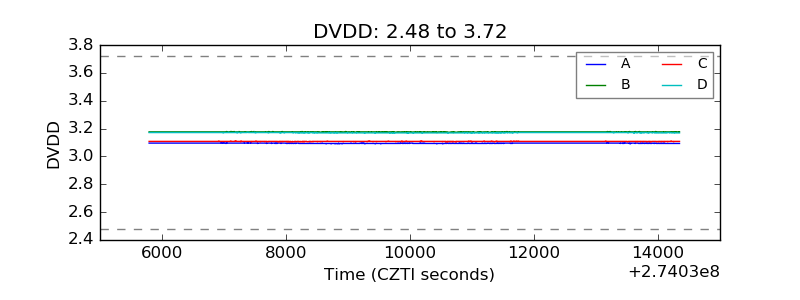 |
| Temperature 1 | 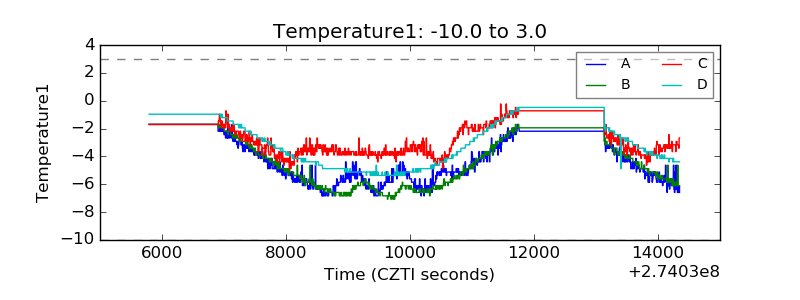 |
| Veto HV Monitor | 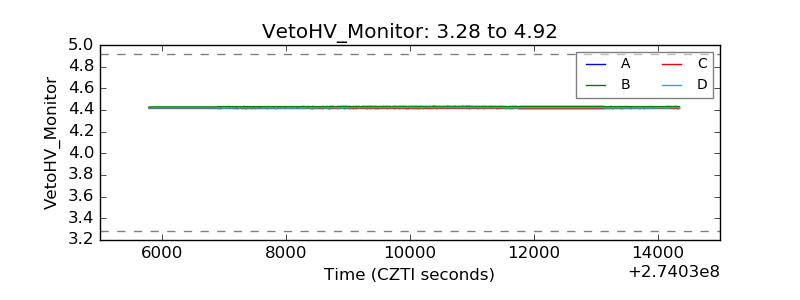 |
| Veto LLD | 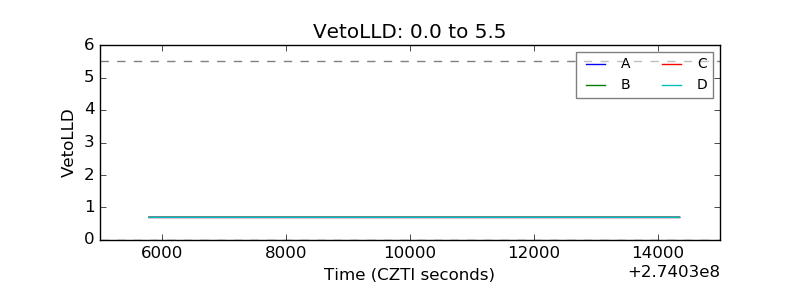 |
| Alpha Counter | 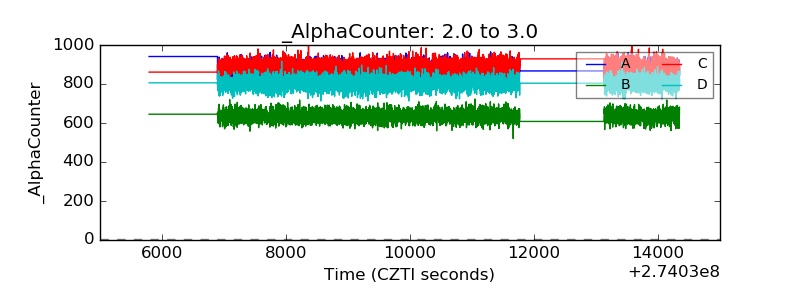 |
| _CPM_Rate | 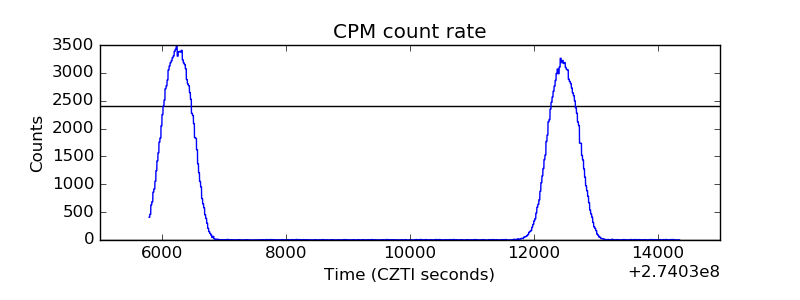 |
| CZT Counter | 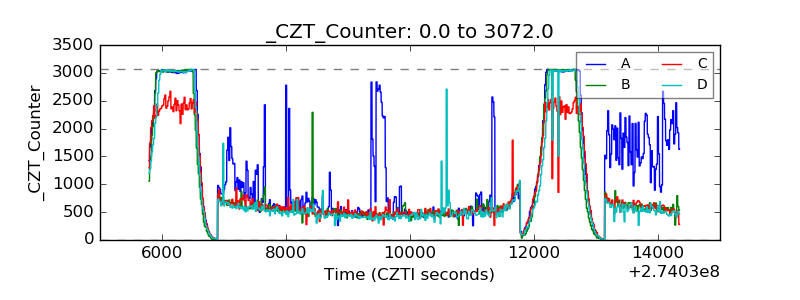 |
| +2.5 Volts monitor |  |
| +5 Volts monitor |  |
| _ROLL_ROT |  |
| _Roll_DEC |  |
| _Roll_RA | 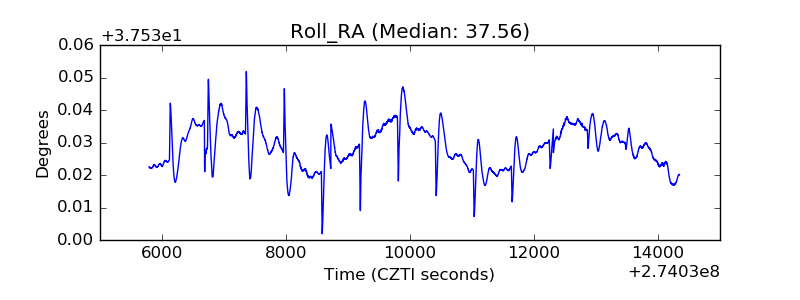 |
| Veto Counter | 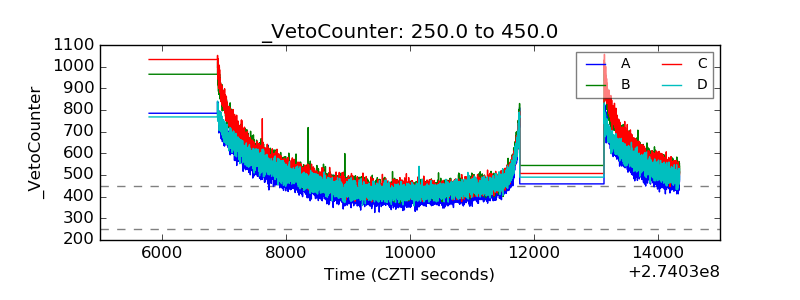 |