| Param | Original file | Final file |
|---|---|---|
| Filename | modeM0/AS1A04_143T01_9000002344_15922cztM0_level2.evt | modeM0/AS1A04_143T01_9000002344_15922cztM0_level2_quad_clean.evt |
| Size (bytes) | 714,960,000 | 101,128,320 |
| Size | 681.8 MB | 96.4 MB |
| Events in quadrant A | 10,557,458 | 542,902 |
| Events in quadrant B | 3,630,050 | 719,704 |
| Events in quadrant C | 3,672,460 | 676,274 |
| Events in quadrant D | 3,341,749 | 658,242 |
| Mode SS | |||
|---|---|---|---|
| Quadrant | BADHDUFLAG | Total packets | Discarded packets |
| A | 0 | 138 | 0 |
| B | 0 | 138 | 0 |
| C | 0 | 138 | 0 |
| D | 0 | 138 | 0 |
| Mode M0 | |||
|---|---|---|---|
| Quadrant | BADHDUFLAG | Total packets | Discarded packets |
| A | 0 | 35968 | 3 |
| B | 0 | 14925 | 2 |
| C | 0 | 15010 | 2 |
| D | 0 | 14255 | 2 |
| Mode M9 | |||
|---|---|---|---|
| Quadrant | BADHDUFLAG | Total packets | Discarded packets |
| A | 0 | 27 | 0 |
| B | 0 | 27 | 0 |
| C | 0 | 27 | 0 |
| D | 0 | 27 | 0 |
| Quadrant | Total seconds | Saturated seconds | Saturation percentage |
|---|---|---|---|
| A | 6666 | 2441 | 36.618662% |
| B | 6666 | 162 | 2.430243% |
| C | 6666 | 164 | 2.460246% |
| D | 6666 | 67 | 1.005101% |
Noise dominated data is calculated using 1-second bins in cleaned event files. If a bin has >2000 counts, and if more than 50% of those come from <1% of pixels, then it is considered to be noise-dominated and hence unusable.
| Quadrant | # 1 sec bins | Bins with >0 counts | Bins with >2000 counts | High rate bins dominated by noise | Noise dominated (total time) | Noise dominated (detector-on time) | Marked lightcurve |
|---|---|---|---|---|---|---|---|
| A | 9376 | 6668 | 1914 | 1914 | 20.41% | 28.70% | 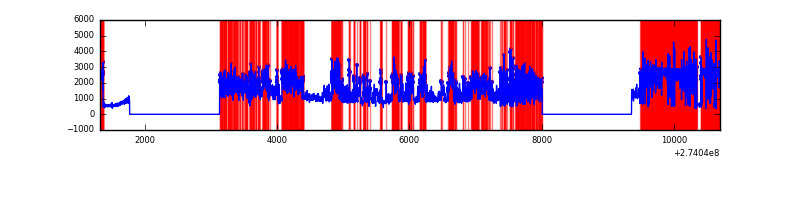 |
| B | 9377 | 6668 | 3 | 3 | 0.03% | 0.04% | 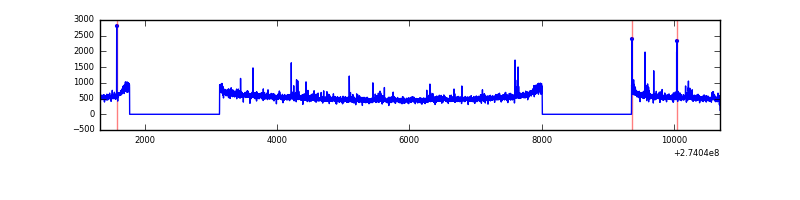 |
| C | 9377 | 6668 | 0 | 0 | 0.00% | 0.00% | 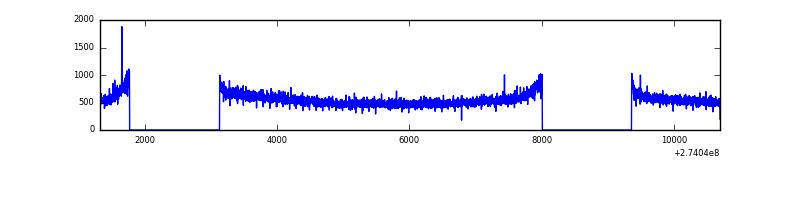 |
| D | 9377 | 6669 | 2 | 2 | 0.02% | 0.03% | 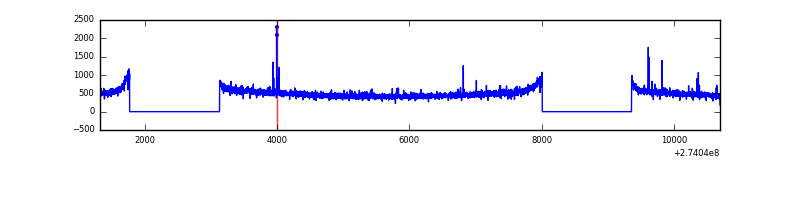 |
Top three noisy pixels from each quadrant. If the there are fewer than three noisy pixels in the level2.evt file, extra rows are filled as -1
| Pixel properties | Quadrant properties | ||||||
|---|---|---|---|---|---|---|---|
| Quadrant | DetID | PixID | Counts | Sigma | Mean | Median | Sigma |
| A | 15 | 239 | 7640426 | 51018.77 | 753 | 739 | 149.7 |
| A | 3 | 1 | 9572 | 58.99 | 753 | 739 | 149.7 |
| A | 0 | 226 | 6699 | 39.8 | 753 | 739 | 149.7 |
| B | 0 | 189 | 34536 | 196.71 | 906 | 884 | 171.1 |
| B | 12 | 111 | 19251 | 107.36 | 906 | 884 | 171.1 |
| B | 11 | 111 | 16562 | 91.64 | 906 | 884 | 171.1 |
| C | 3 | 233 | 148200 | 730.91 | 866 | 875 | 201.6 |
| C | 14 | 238 | 133511 | 658.04 | 866 | 875 | 201.6 |
| C | 7 | 247 | 9771 | 44.14 | 866 | 875 | 201.6 |
| D | 2 | 234 | 32357 | 148.96 | 873 | 851 | 211.5 |
| D | 2 | 152 | 12374 | 54.48 | 873 | 851 | 211.5 |
| D | 7 | 223 | 11995 | 52.69 | 873 | 851 | 211.5 |
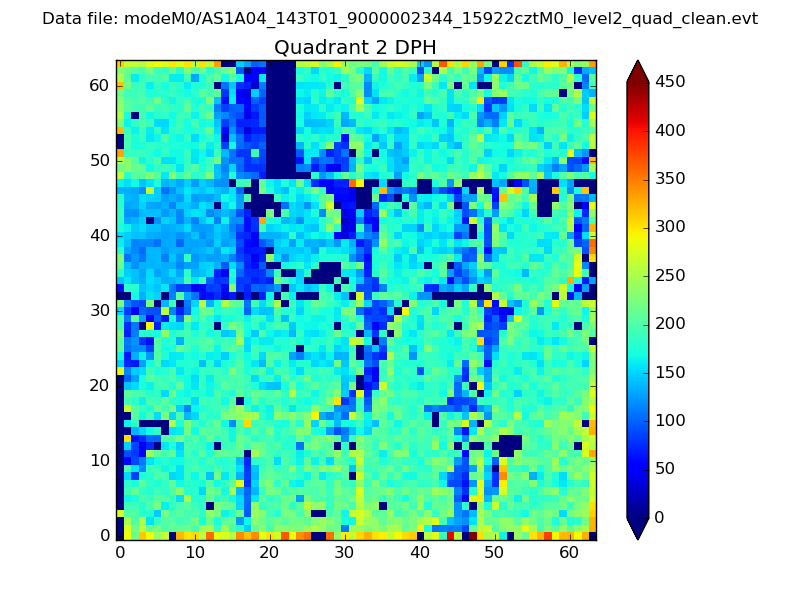
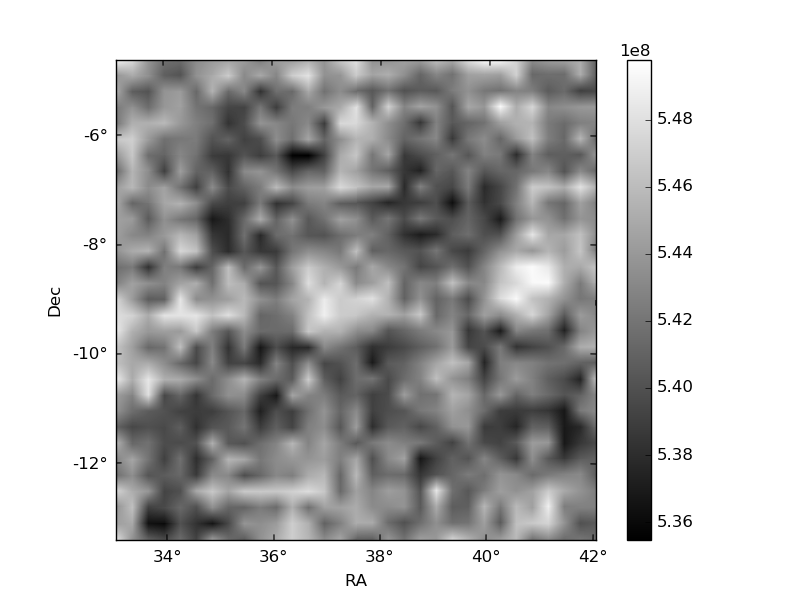
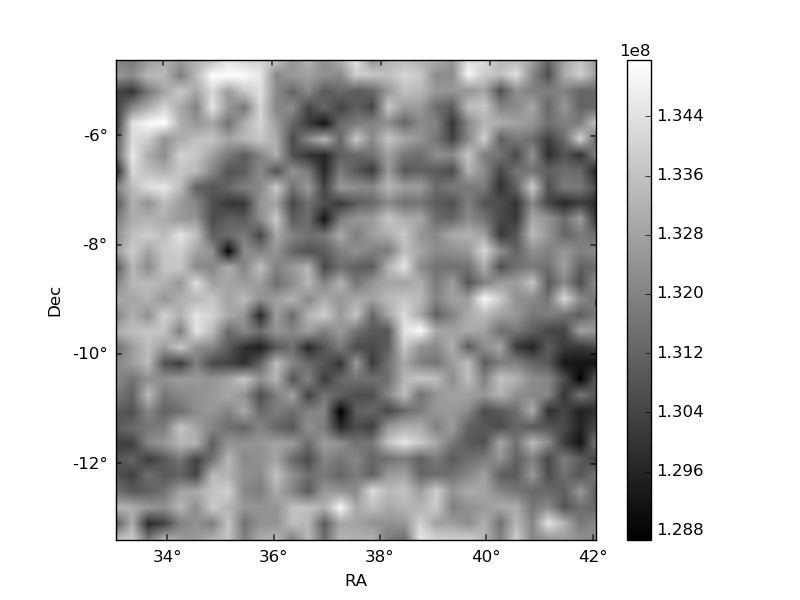
Histogram calculated using DETX and DETY for each event in the final _common_clean file
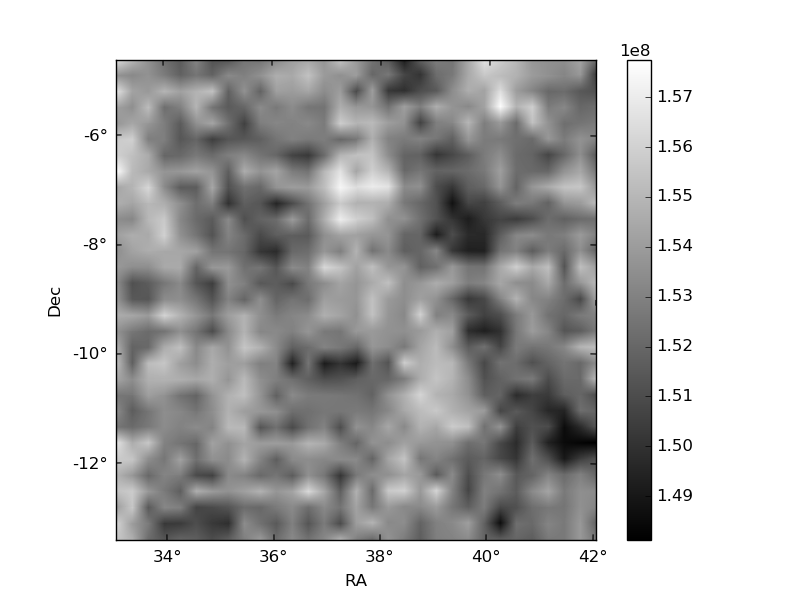
| Quadrant A | 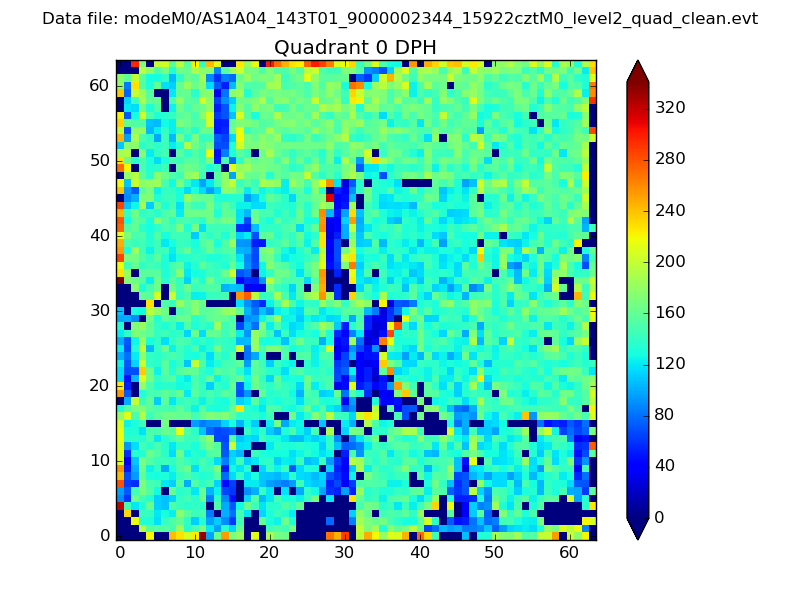 |
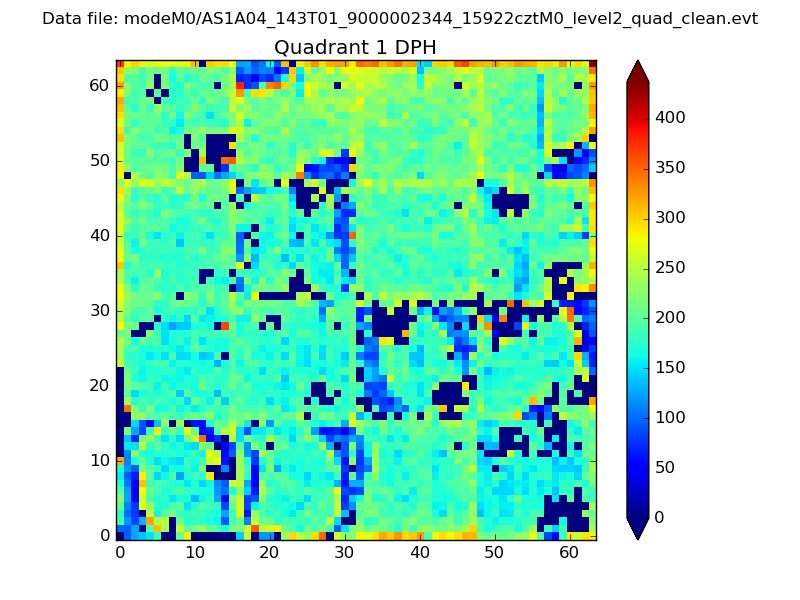 |
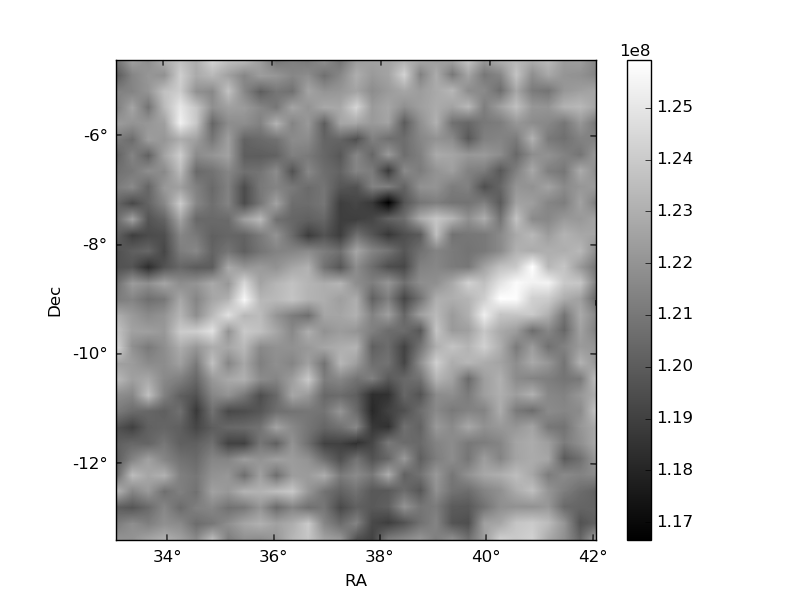
Quadrant B |
|---|---|---|---|
| Quadrant D | 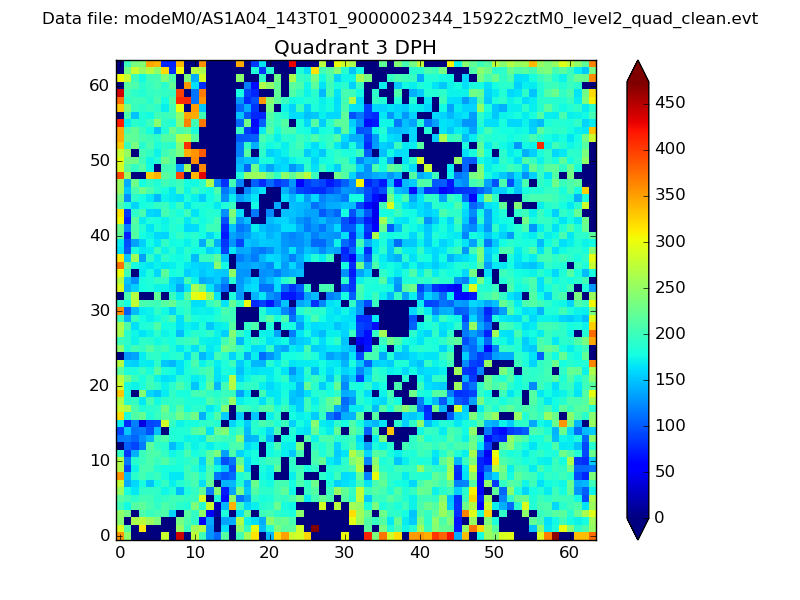 |
 |
Quadrant C |
| Plot type | Count rate plots | Images |
|---|---|---|
| Comparison with Poisson distribution Blue bars denote a histogram of data divided into 1 sec bins. Red curve is a Poisson curve with rate = median count rate of data. |
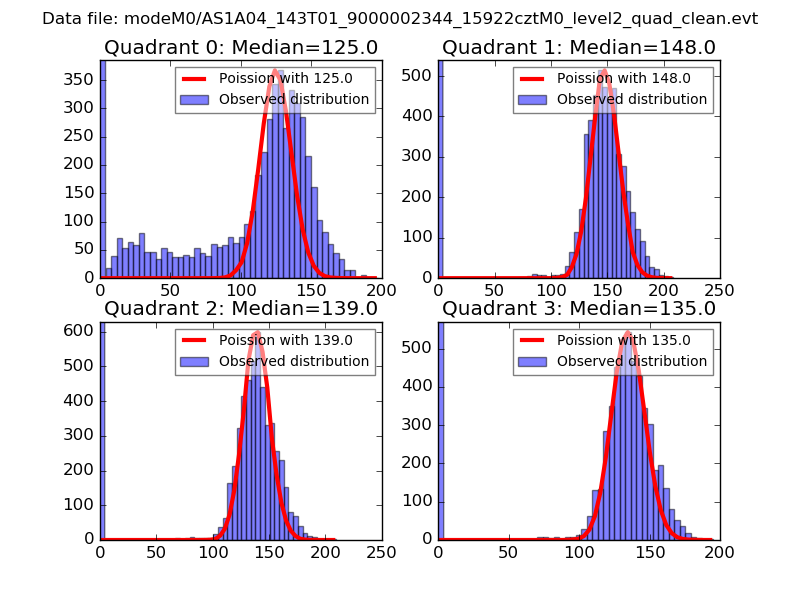 |
 |
| Quadrant-wise count rates Data is divided into 100 sec bins |
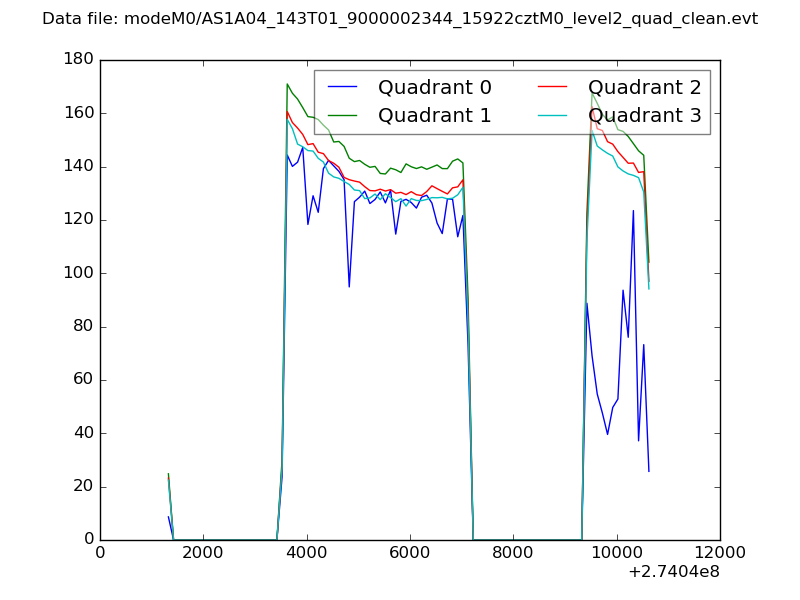 |
|
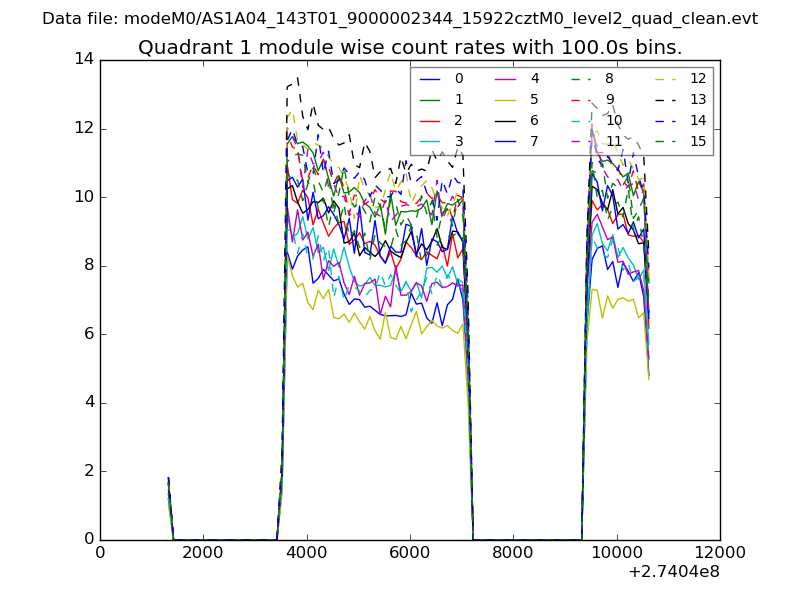
| Module-wise count rates for Quadrant A Data is divided into 100 sec bins |
 |
 |
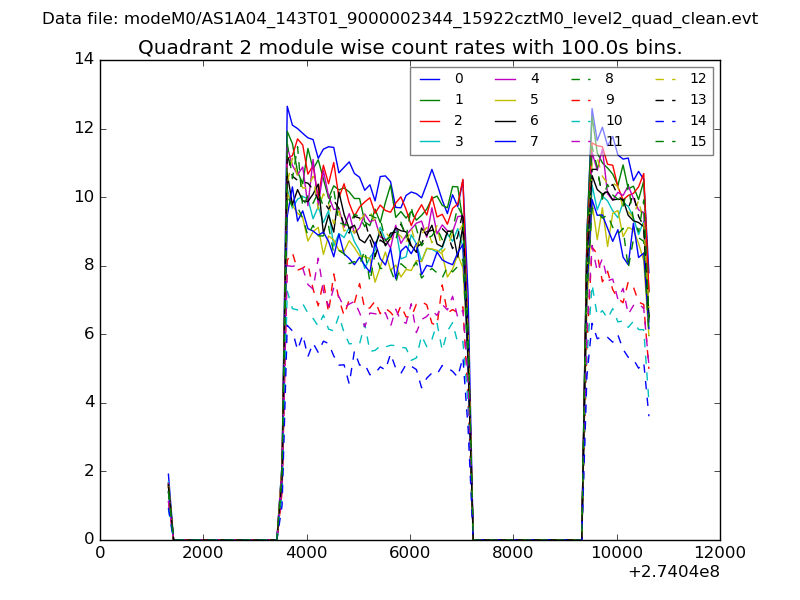
| Module-wise count rates for Quadrant B Data is divided into 100 sec bins |
 |
 |
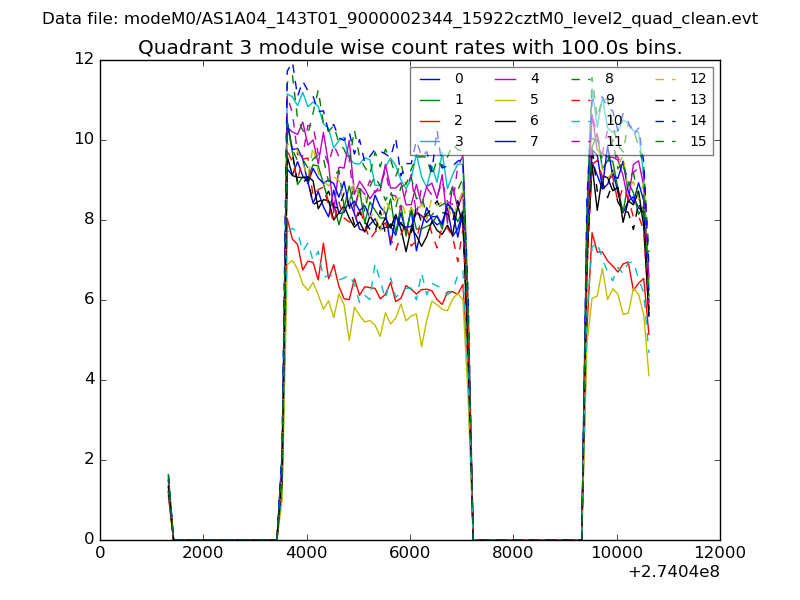
| Module-wise count rates for Quadrant C Data is divided into 100 sec bins |
 |
 |
| Module-wise count rates for Quadrant D Data is divided into 100 sec bins |
 |
 |
| Parameter | Plot |
|---|---|
| CZT HV Monitor | 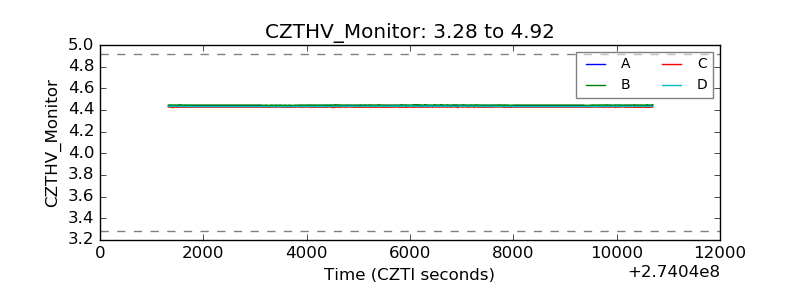 |
| D_VDD | 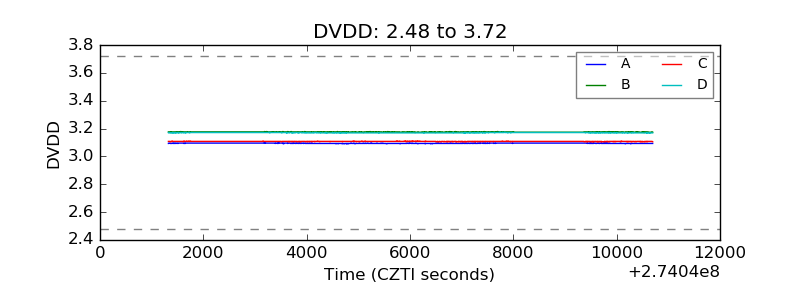 |
| Temperature 1 | 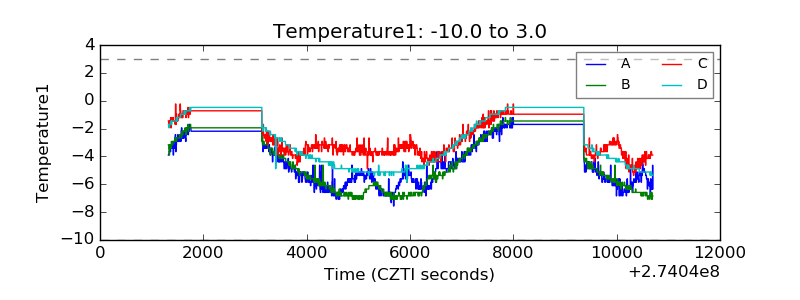 |
| Veto HV Monitor | 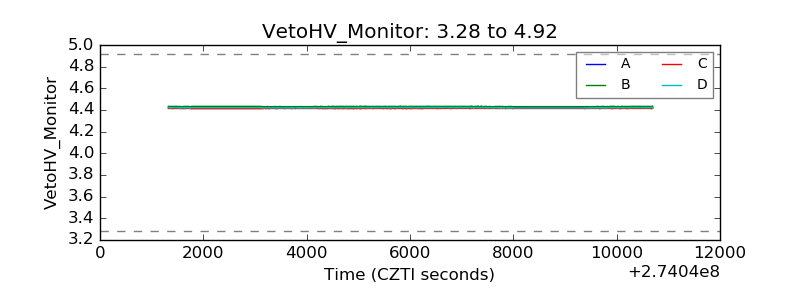 |
| Veto LLD |  |
| Alpha Counter | 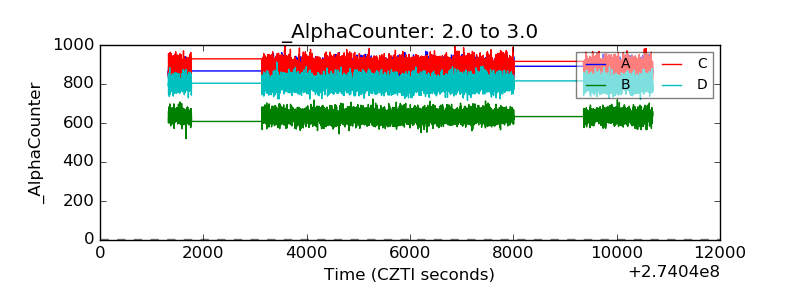 |
| _CPM_Rate | 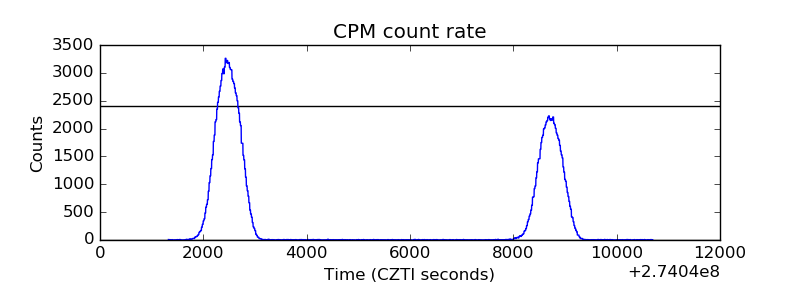 |
| CZT Counter | 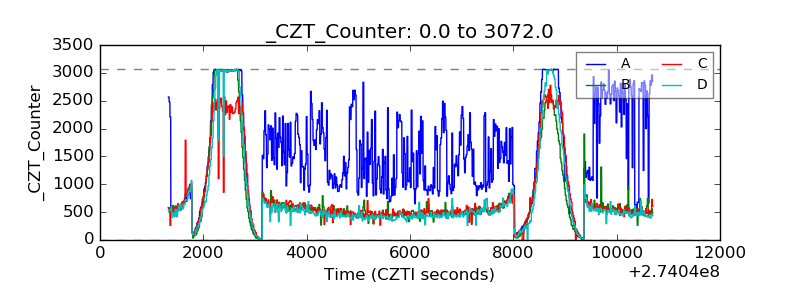 |
| +2.5 Volts monitor |  |
| +5 Volts monitor |  |
| _ROLL_ROT | 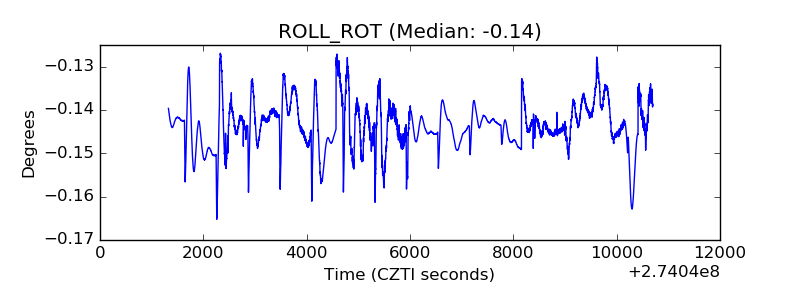 |
| _Roll_DEC | 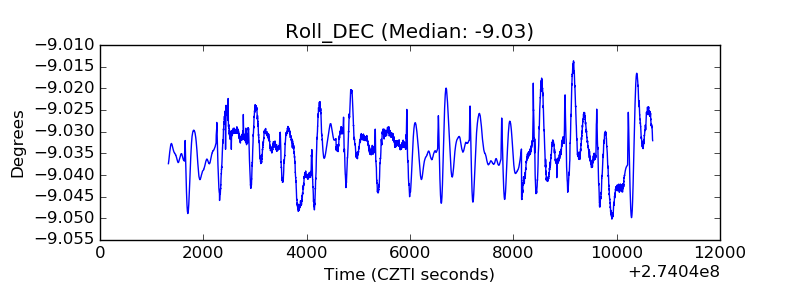 |
| _Roll_RA | 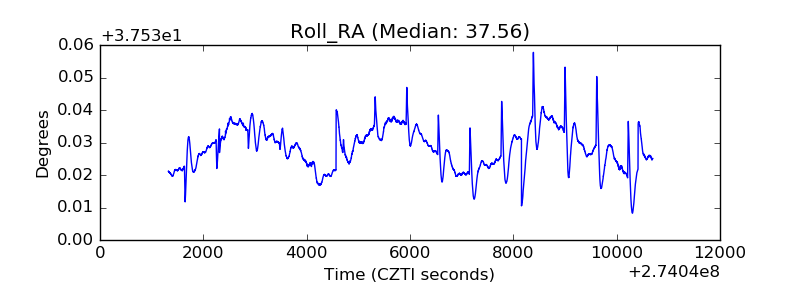 |
| Veto Counter |  |