| Param | Original file | Final file |
|---|---|---|
| Filename | modeM0/AS1A04_143T01_9000002344_15923cztM0_level2.evt | modeM0/AS1A04_143T01_9000002344_15923cztM0_level2_quad_clean.evt |
| Size (bytes) | 651,905,280 | 97,064,640 |
| Size | 621.7 MB | 92.6 MB |
| Events in quadrant A | 9,500,051 | 503,425 |
| Events in quadrant B | 3,344,866 | 694,231 |
| Events in quadrant C | 3,362,671 | 656,560 |
| Events in quadrant D | 3,102,254 | 638,166 |
| Mode SS | |||
|---|---|---|---|
| Quadrant | BADHDUFLAG | Total packets | Discarded packets |
| A | 0 | 134 | 0 |
| B | 0 | 134 | 0 |
| C | 0 | 134 | 0 |
| D | 0 | 134 | 0 |
| Mode M0 | |||
|---|---|---|---|
| Quadrant | BADHDUFLAG | Total packets | Discarded packets |
| A | 0 | 32685 | 3 |
| B | 0 | 13972 | 2 |
| C | 0 | 13785 | 2 |
| D | 0 | 13569 | 2 |
| Mode M9 | |||
|---|---|---|---|
| Quadrant | BADHDUFLAG | Total packets | Discarded packets |
| A | 0 | 26 | 0 |
| B | 0 | 26 | 0 |
| C | 0 | 26 | 0 |
| D | 0 | 26 | 0 |
| Quadrant | Total seconds | Saturated seconds | Saturation percentage |
|---|---|---|---|
| A | 6391 | 2179 | 34.094821% |
| B | 6391 | 138 | 2.159286% |
| C | 6391 | 112 | 1.752464% |
| D | 6391 | 55 | 0.860585% |
Noise dominated data is calculated using 1-second bins in cleaned event files. If a bin has >2000 counts, and if more than 50% of those come from <1% of pixels, then it is considered to be noise-dominated and hence unusable.
| Quadrant | # 1 sec bins | Bins with >0 counts | Bins with >2000 counts | High rate bins dominated by noise | Noise dominated (total time) | Noise dominated (detector-on time) | Marked lightcurve |
|---|---|---|---|---|---|---|---|
| A | 9057 | 6394 | 1781 | 1781 | 19.66% | 27.85% | 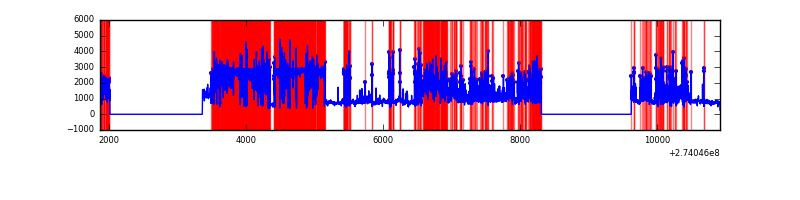 |
| B | 9057 | 6394 | 4 | 4 | 0.04% | 0.06% | 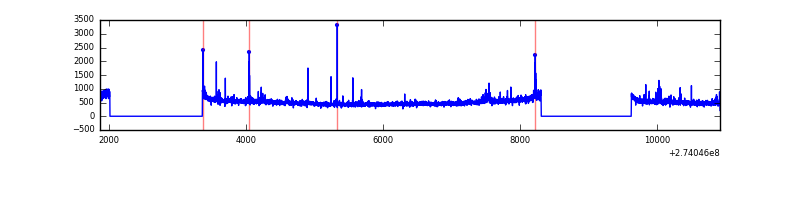 |
| C | 9057 | 6394 | 0 | 0 | 0.00% | 0.00% | 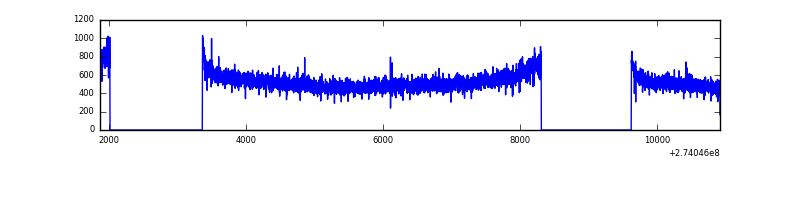 |
| D | 9057 | 6394 | 11 | 11 | 0.12% | 0.17% | 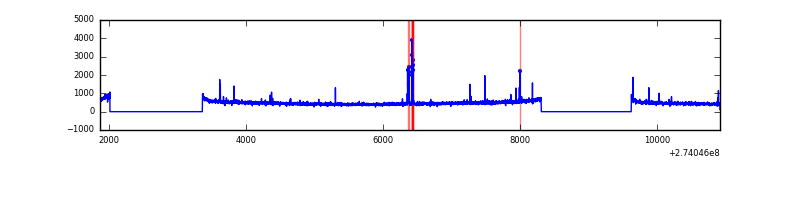 |
Top three noisy pixels from each quadrant. If the there are fewer than three noisy pixels in the level2.evt file, extra rows are filled as -1
| Pixel properties | Quadrant properties | ||||||
|---|---|---|---|---|---|---|---|
| Quadrant | DetID | PixID | Counts | Sigma | Mean | Median | Sigma |
| A | 15 | 239 | 6911347 | 51264.11 | 671 | 658 | 134.8 |
| A | 9 | 143 | 7498 | 50.74 | 671 | 658 | 134.8 |
| A | 0 | 226 | 5764 | 37.88 | 671 | 658 | 134.8 |
| B | 0 | 189 | 39611 | 247.14 | 827 | 805 | 157.0 |
| B | 4 | 173 | 23937 | 147.32 | 827 | 805 | 157.0 |
| B | 12 | 111 | 18192 | 110.73 | 827 | 805 | 157.0 |
| C | 3 | 233 | 144567 | 773.71 | 792 | 801 | 185.8 |
| C | 14 | 238 | 120488 | 644.12 | 792 | 801 | 185.8 |
| C | 0 | 207 | 9751 | 48.16 | 792 | 801 | 185.8 |
| D | 10 | 70 | 59680 | 302.92 | 798 | 776 | 194.5 |
| D | 2 | 234 | 28593 | 143.05 | 798 | 776 | 194.5 |
| D | 2 | 120 | 15760 | 77.06 | 798 | 776 | 194.5 |
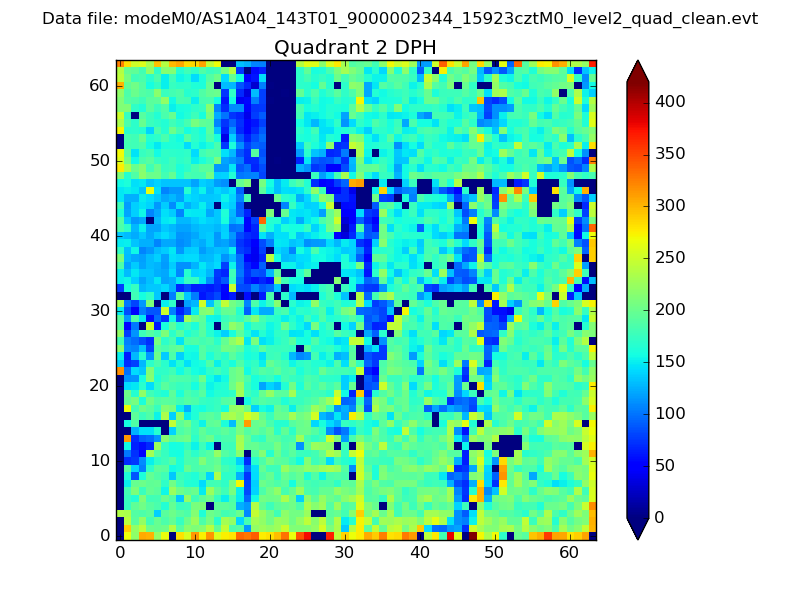
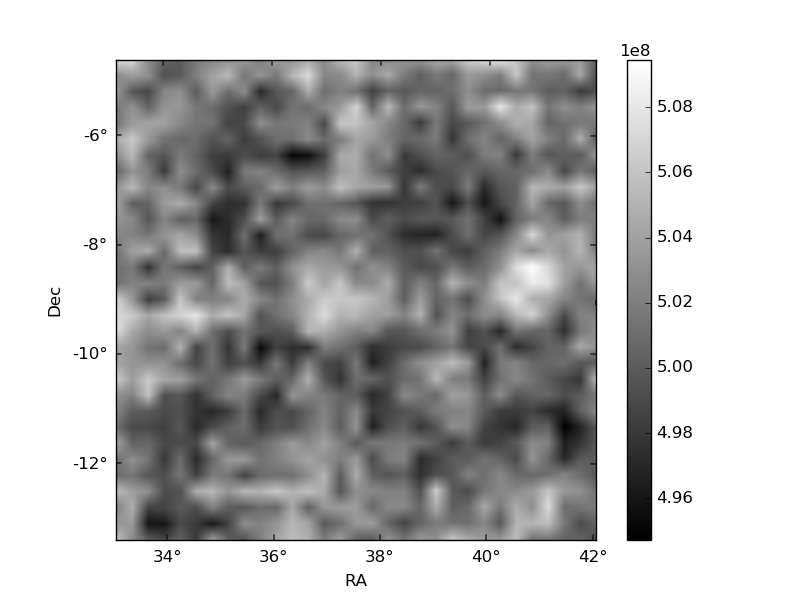
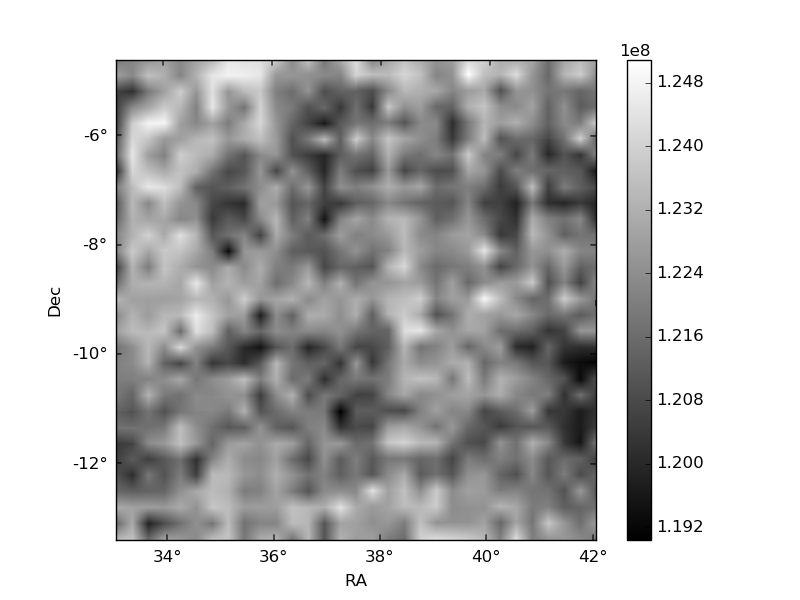
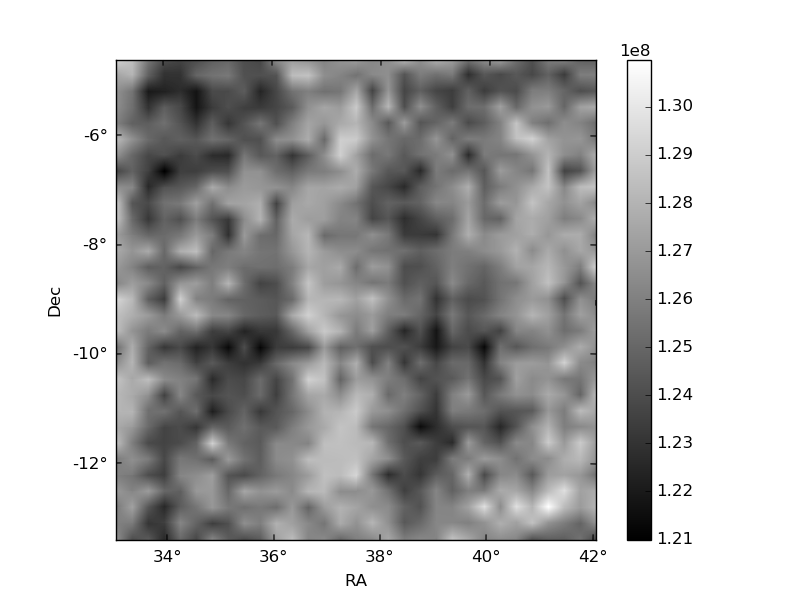
Histogram calculated using DETX and DETY for each event in the final _common_clean file
| Quadrant A | 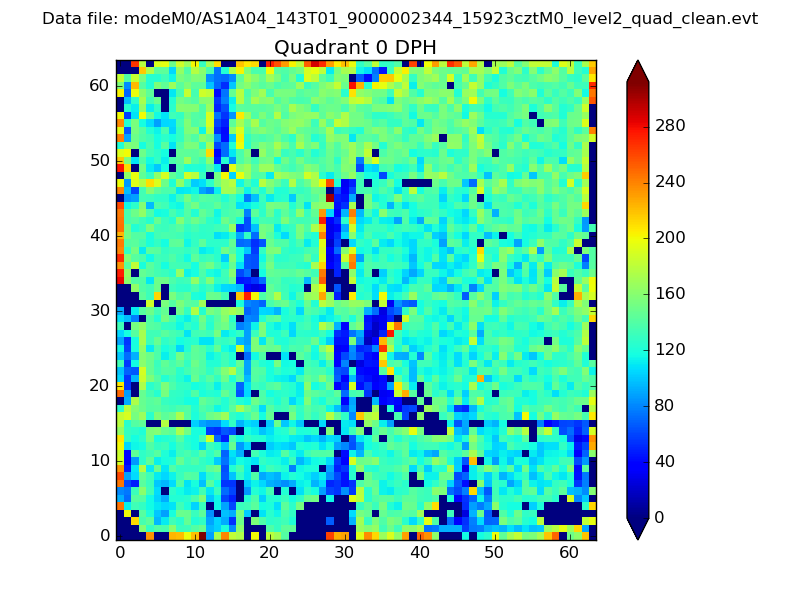 |
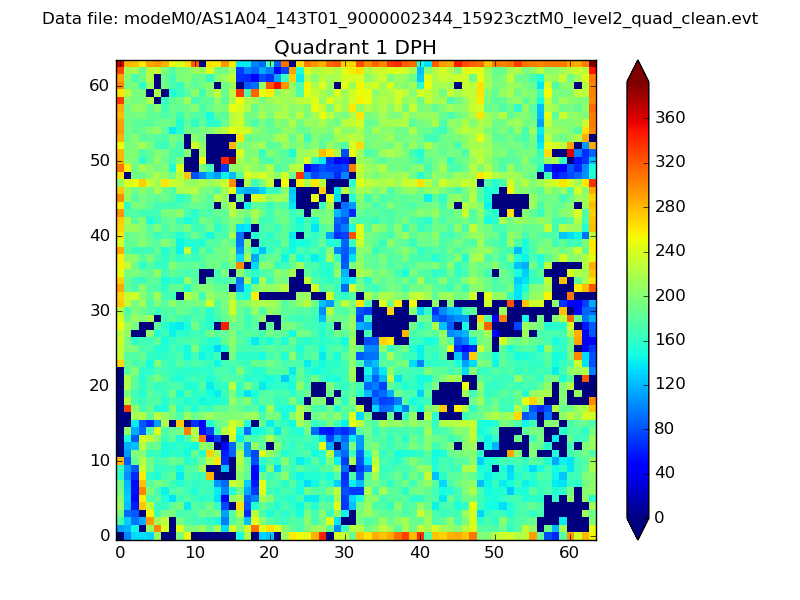 |
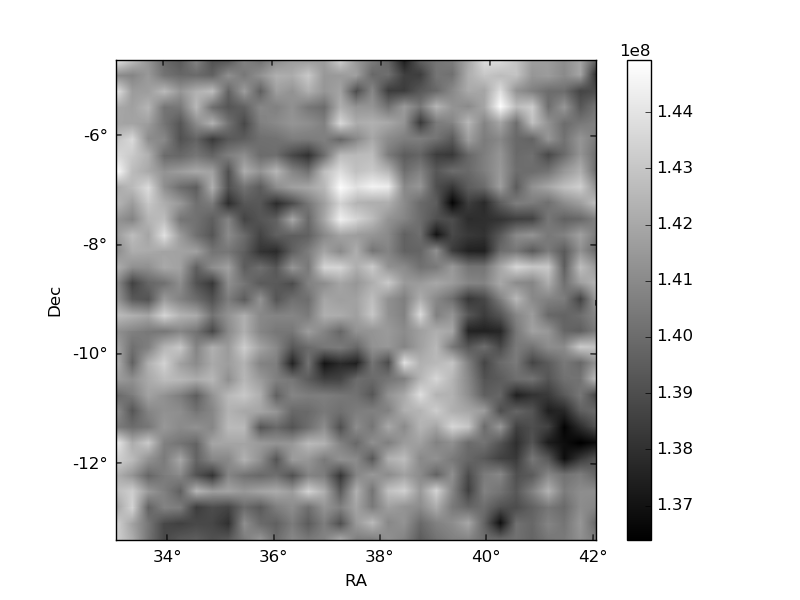
Quadrant B |
|---|---|---|---|
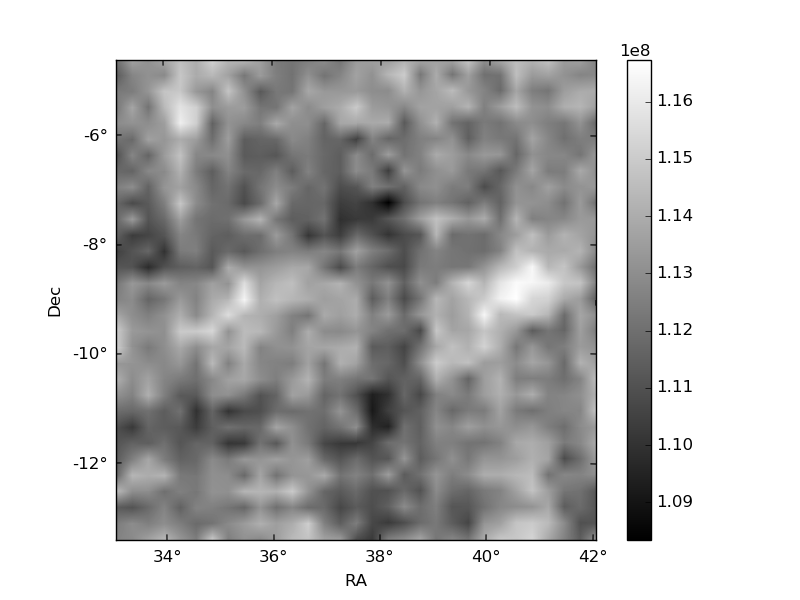
| Quadrant D | 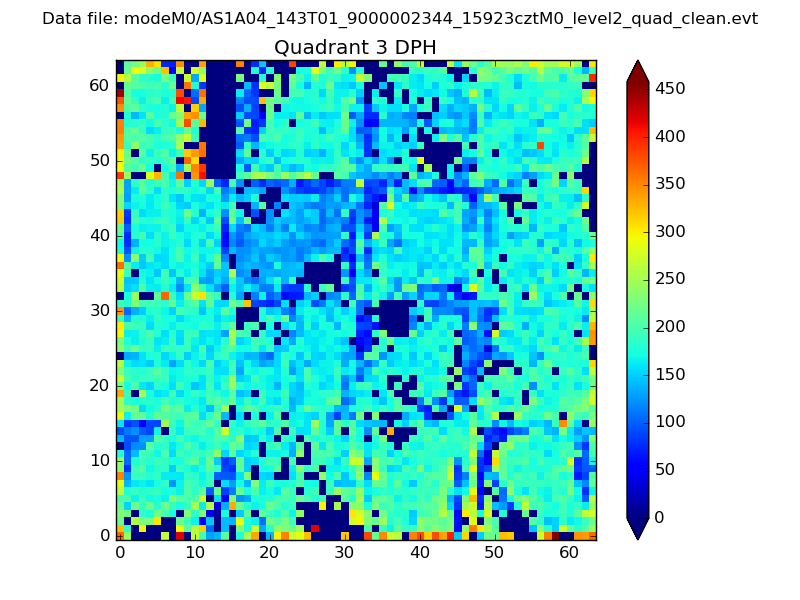 |
 |
Quadrant C |
| Plot type | Count rate plots | Images |
|---|---|---|
| Comparison with Poisson distribution Blue bars denote a histogram of data divided into 1 sec bins. Red curve is a Poisson curve with rate = median count rate of data. |
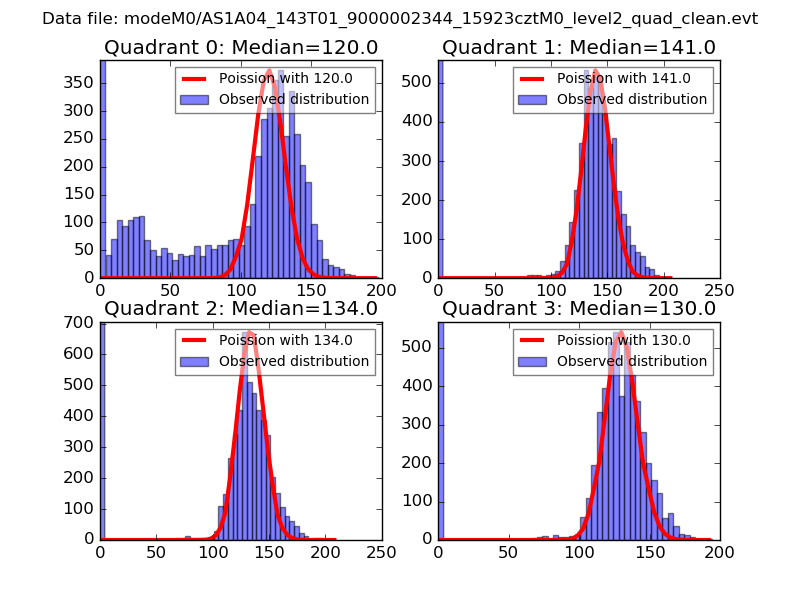 |
 |
| Quadrant-wise count rates Data is divided into 100 sec bins |
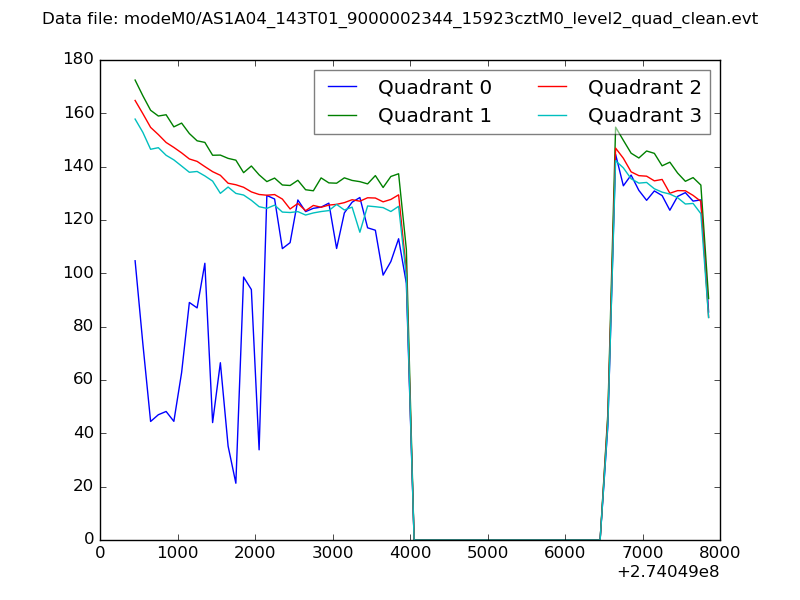 |
|
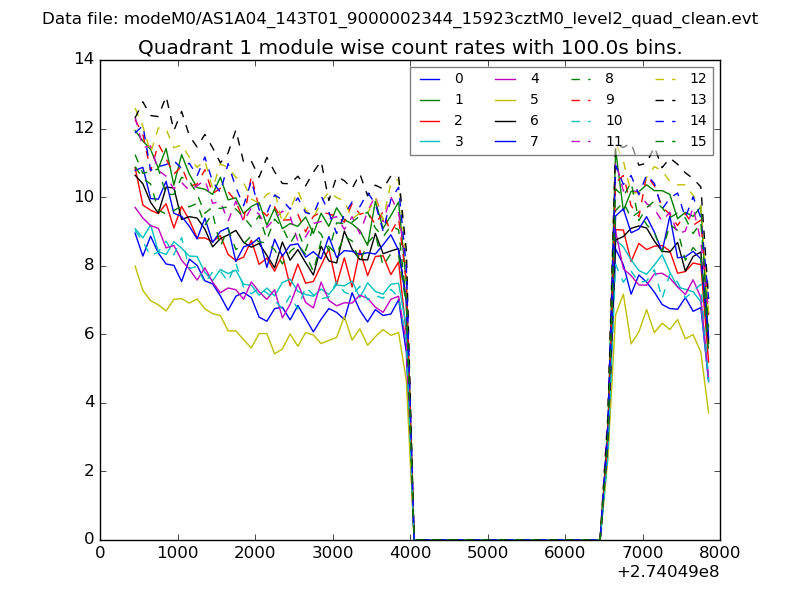
| Module-wise count rates for Quadrant A Data is divided into 100 sec bins |
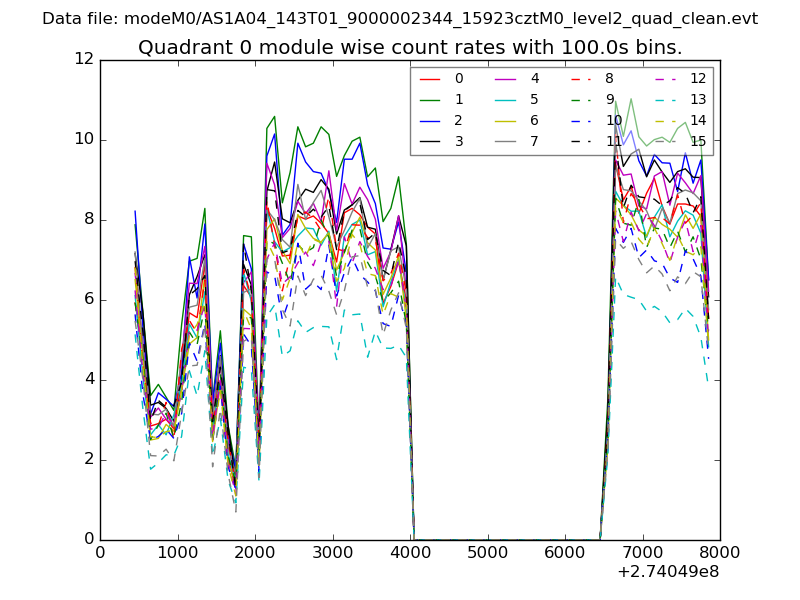 |
 |
| Module-wise count rates for Quadrant B Data is divided into 100 sec bins |
 |
 |
| Module-wise count rates for Quadrant C Data is divided into 100 sec bins |
 |
 |
| Module-wise count rates for Quadrant D Data is divided into 100 sec bins |
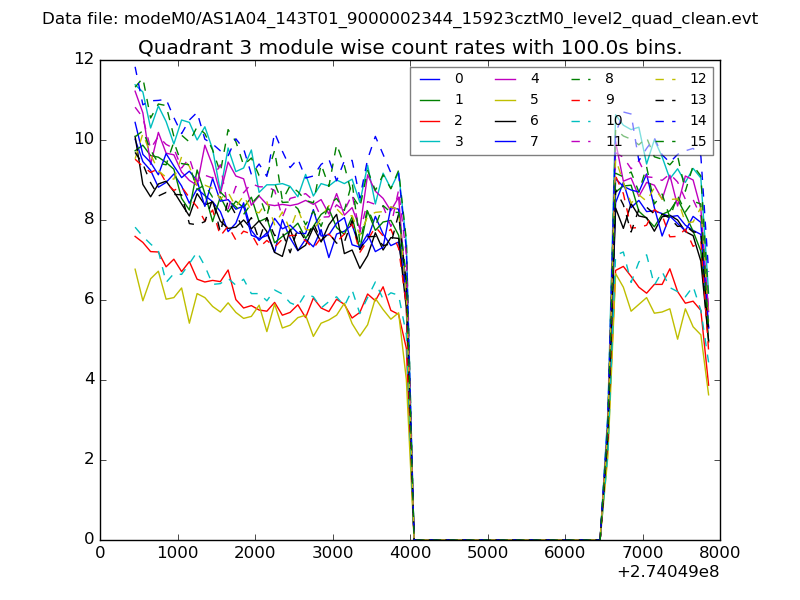 |
 |
| Parameter | Plot |
|---|---|
| CZT HV Monitor | 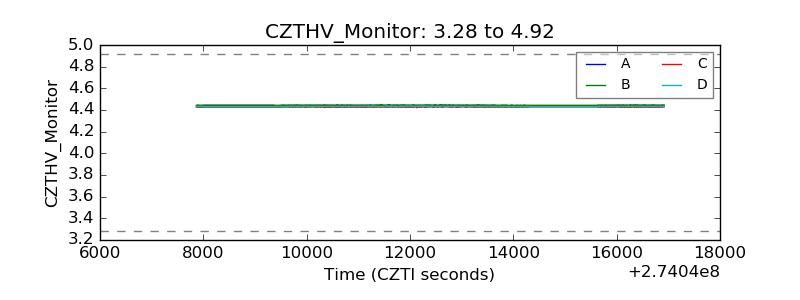 |
| D_VDD | 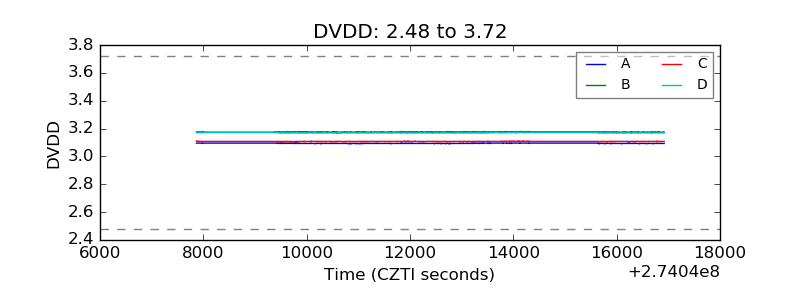 |
| Temperature 1 |  |
| Veto HV Monitor |  |
| Veto LLD | 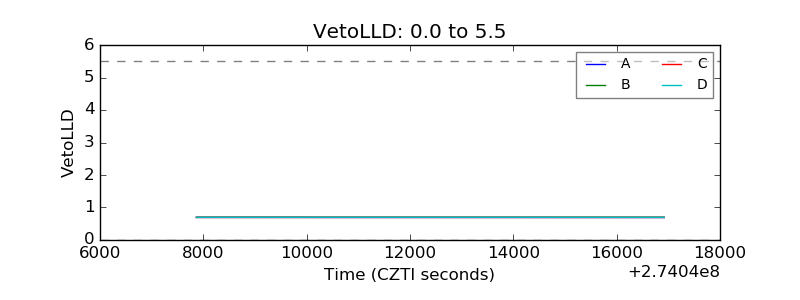 |
| Alpha Counter | 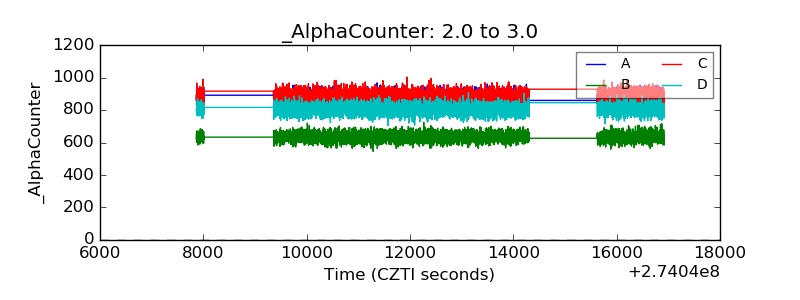 |
| _CPM_Rate | 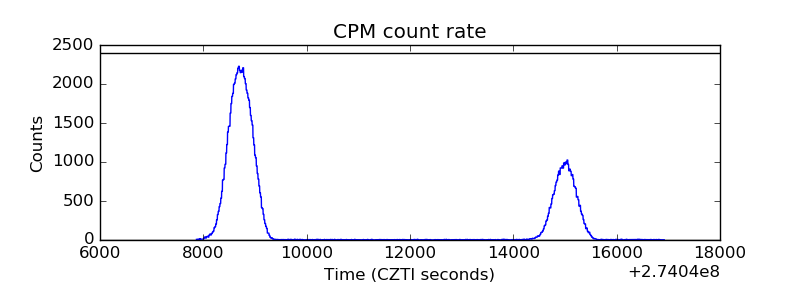 |
| CZT Counter | 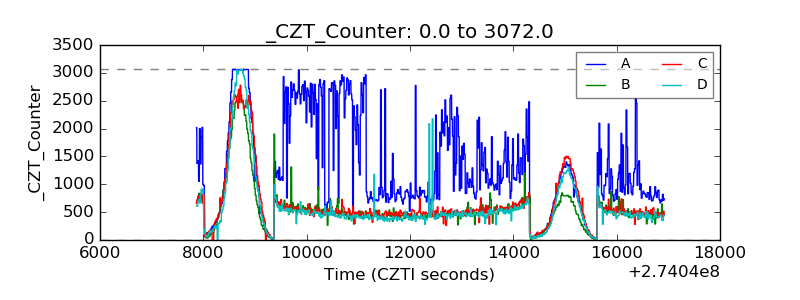 |
| +2.5 Volts monitor |  |
| +5 Volts monitor |  |
| _ROLL_ROT | 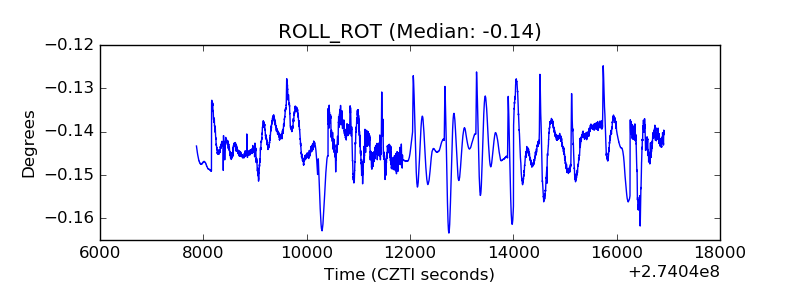 |
| _Roll_DEC | 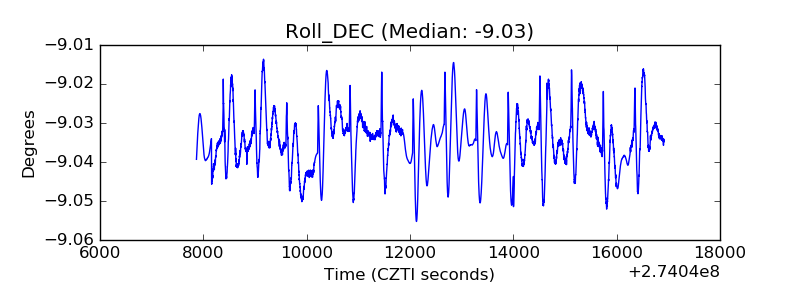 |
| _Roll_RA | 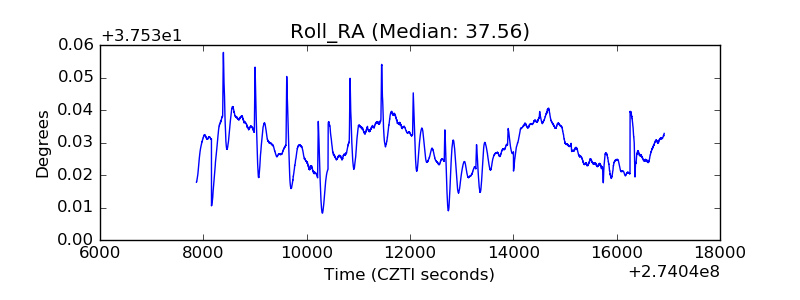 |
| Veto Counter | 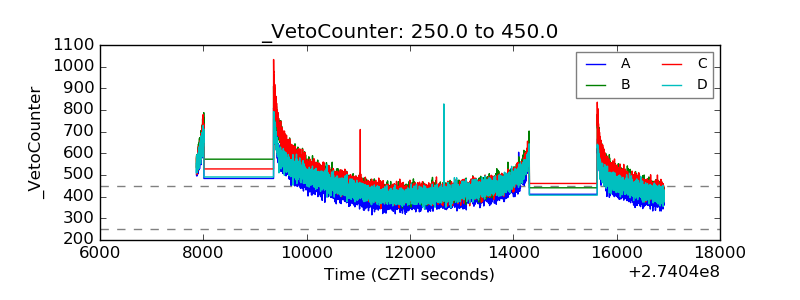 |