| Param | Original file | Final file |
|---|---|---|
| Filename | modeM0/AS1A04_143T01_9000002344_15925cztM0_level2.evt | modeM0/AS1A04_143T01_9000002344_15925cztM0_level2_quad_clean.evt |
| Size (bytes) | 241,024,320 | 51,670,080 |
| Size | 229.9 MB | 49.3 MB |
| Events in quadrant A | 2,992,230 | 327,540 |
| Events in quadrant B | 1,311,914 | 362,619 |
| Events in quadrant C | 1,334,174 | 341,722 |
| Events in quadrant D | 1,467,336 | 330,485 |
| Mode SS | |||
|---|---|---|---|
| Quadrant | BADHDUFLAG | Total packets | Discarded packets |
| A | 0 | 56 | 0 |
| B | 0 | 56 | 0 |
| C | 0 | 56 | 0 |
| D | 0 | 56 | 0 |
| Mode M0 | |||
|---|---|---|---|
| Quadrant | BADHDUFLAG | Total packets | Discarded packets |
| A | 0 | 10845 | 1 |
| B | 0 | 5868 | 1 |
| C | 0 | 5838 | 1 |
| D | 0 | 6575 | 1 |
| Mode M9 | |||
|---|---|---|---|
| Quadrant | BADHDUFLAG | Total packets | Discarded packets |
| A | 0 | 8 | 0 |
| B | 0 | 8 | 0 |
| C | 0 | 8 | 0 |
| D | 0 | 9 | 0 |
| Quadrant | Total seconds | Saturated seconds | Saturation percentage |
|---|---|---|---|
| A | 2829 | 306 | 10.816543% |
| B | 2829 | 37 | 1.307883% |
| C | 2829 | 42 | 1.484624% |
| D | 2829 | 99 | 3.499470% |
Noise dominated data is calculated using 1-second bins in cleaned event files. If a bin has >2000 counts, and if more than 50% of those come from <1% of pixels, then it is considered to be noise-dominated and hence unusable.
| Quadrant | # 1 sec bins | Bins with >0 counts | Bins with >2000 counts | High rate bins dominated by noise | Noise dominated (total time) | Noise dominated (detector-on time) | Marked lightcurve |
|---|---|---|---|---|---|---|---|
| A | 2830 | 2830 | 249 | 249 | 8.80% | 8.80% | 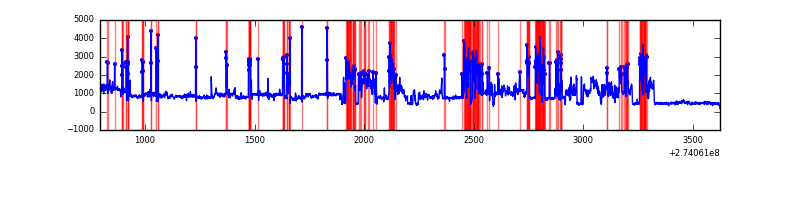 |
| B | 2830 | 2830 | 0 | 0 | 0.00% | 0.00% | 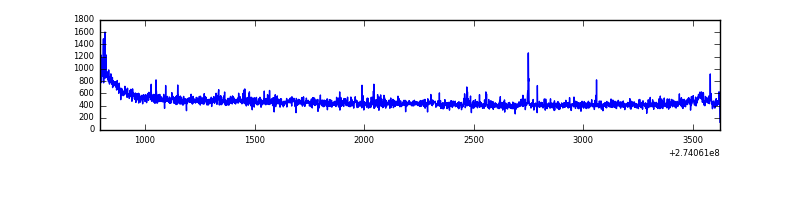 |
| C | 2830 | 2830 | 0 | 0 | 0.00% | 0.00% | 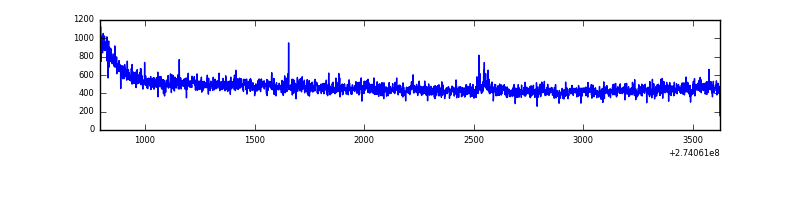 |
| D | 2830 | 2830 | 72 | 72 | 2.54% | 2.54% | 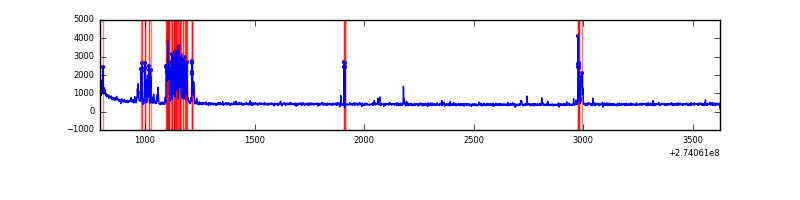 |
Top three noisy pixels from each quadrant. If the there are fewer than three noisy pixels in the level2.evt file, extra rows are filled as -1
| Pixel properties | Quadrant properties | ||||||
|---|---|---|---|---|---|---|---|
| Quadrant | DetID | PixID | Counts | Sigma | Mean | Median | Sigma |
| A | 15 | 239 | 1796584 | 27995.94 | 311 | 304 | 64.2 |
| A | 0 | 226 | 2707 | 37.44 | 311 | 304 | 64.2 |
| A | 12 | 194 | 2293 | 30.99 | 311 | 304 | 64.2 |
| B | 4 | 173 | 12132 | 183.46 | 327 | 319 | 64.4 |
| B | 0 | 189 | 7906 | 117.83 | 327 | 319 | 64.4 |
| B | 12 | 111 | 7495 | 111.44 | 327 | 319 | 64.4 |
| C | 14 | 238 | 47972 | 624.8 | 316 | 317 | 76.3 |
| C | 3 | 233 | 46635 | 607.27 | 316 | 317 | 76.3 |
| C | 7 | 247 | 8682 | 109.67 | 316 | 317 | 76.3 |
| D | 12 | 17 | 230711 | 2908.77 | 313 | 303 | 79.2 |
| D | 10 | 70 | 37774 | 473.05 | 313 | 303 | 79.2 |
| D | 2 | 120 | 13138 | 162.03 | 313 | 303 | 79.2 |
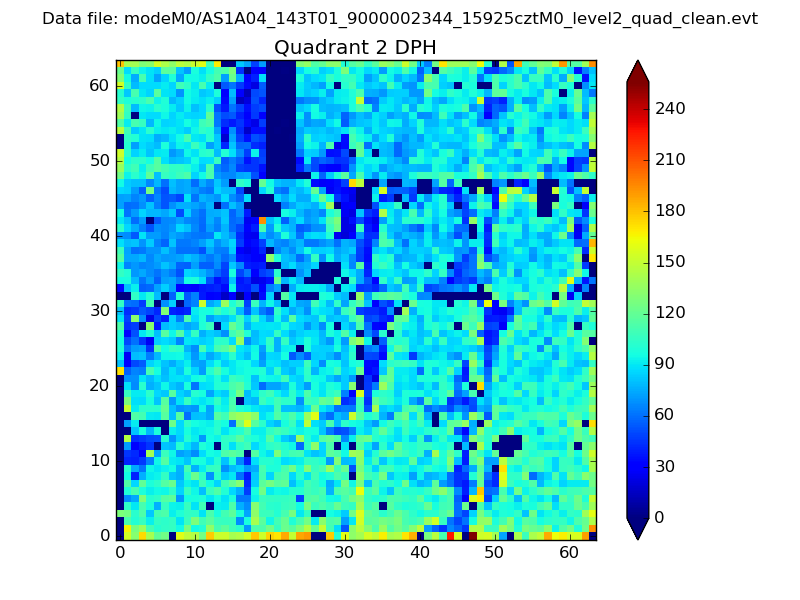
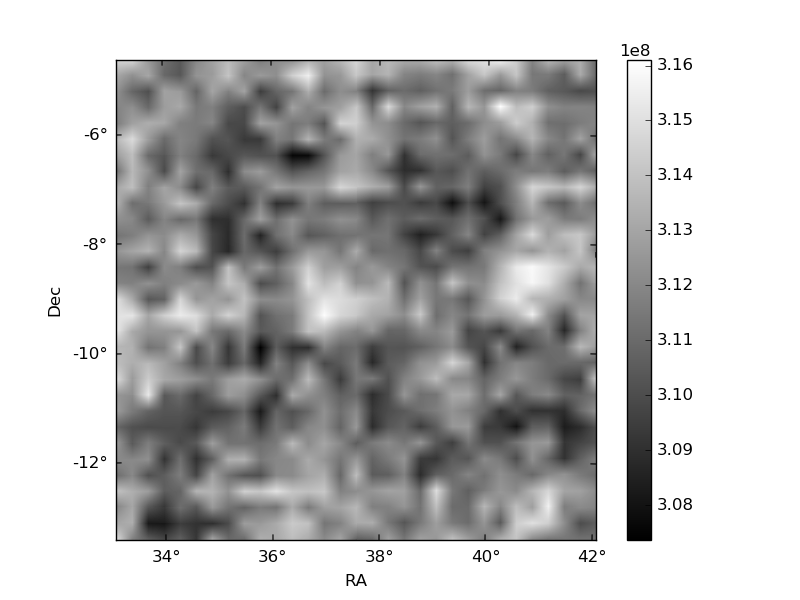
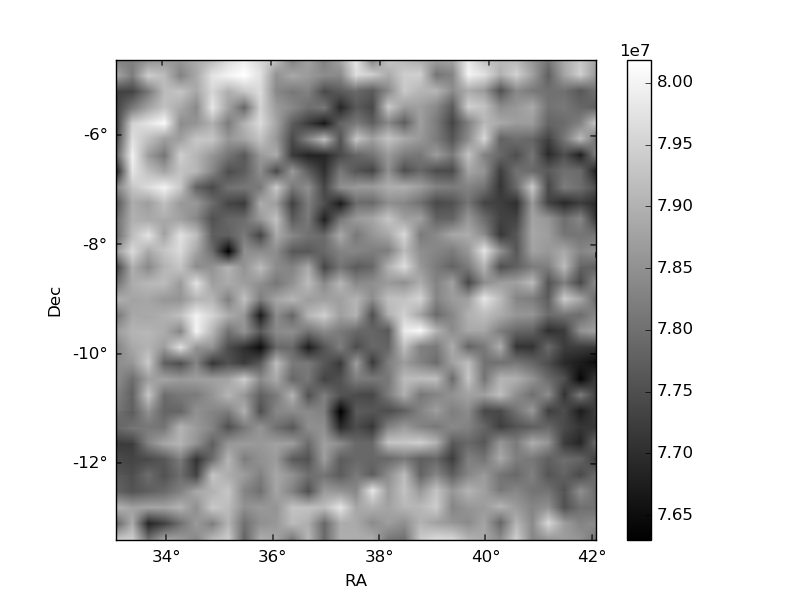
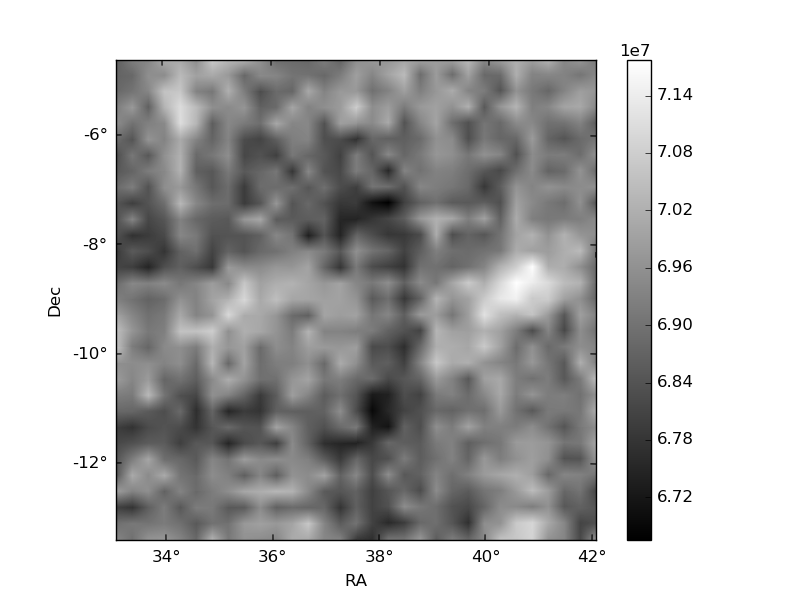
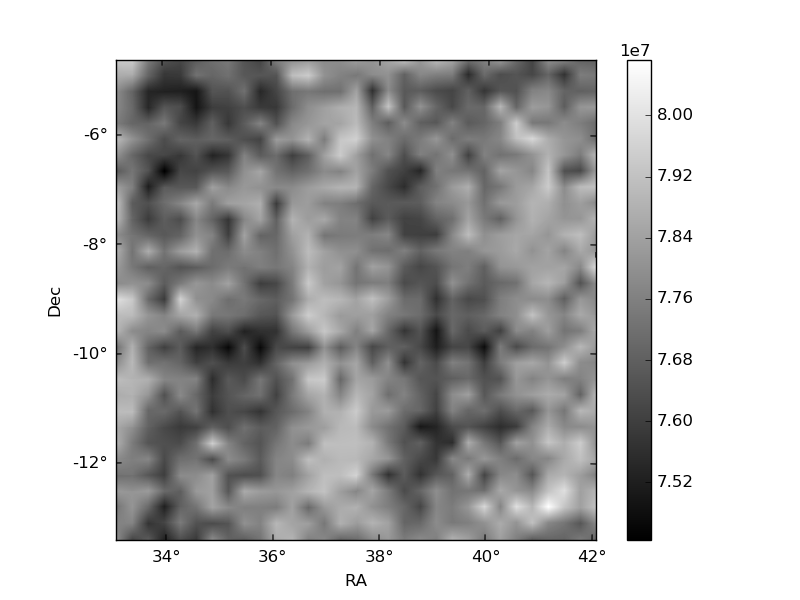
Histogram calculated using DETX and DETY for each event in the final _common_clean file
| Quadrant A | 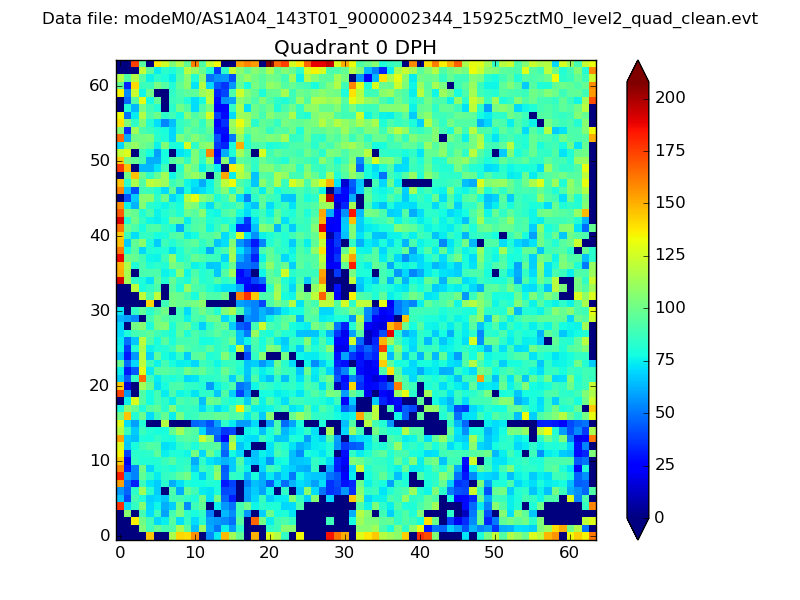 |
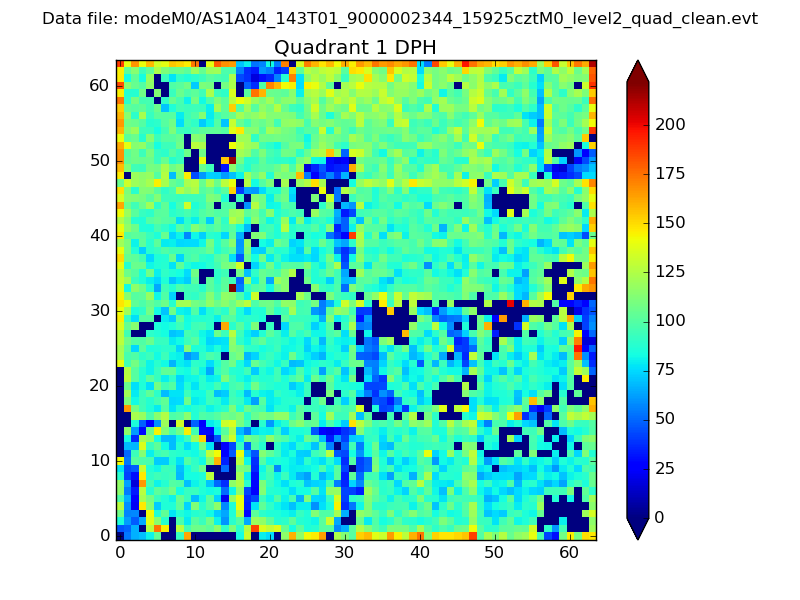 |
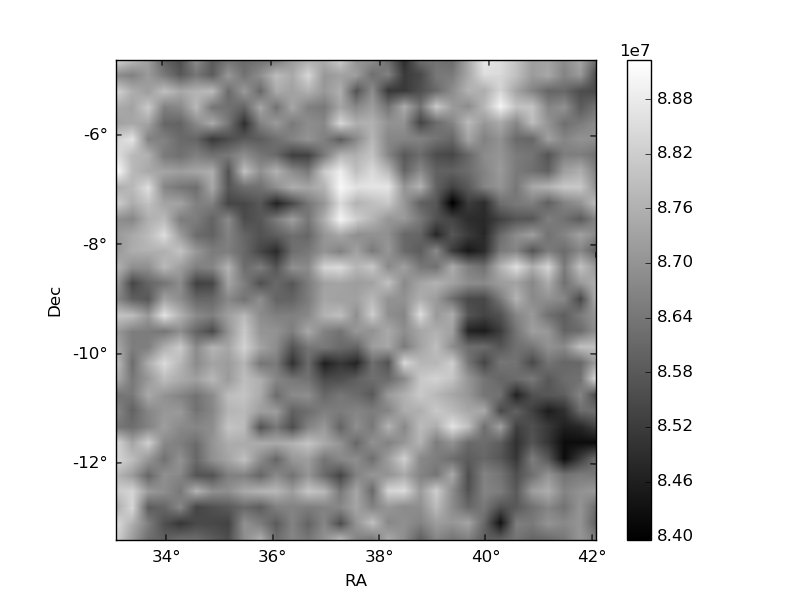
Quadrant B |
|---|---|---|---|
| Quadrant D | 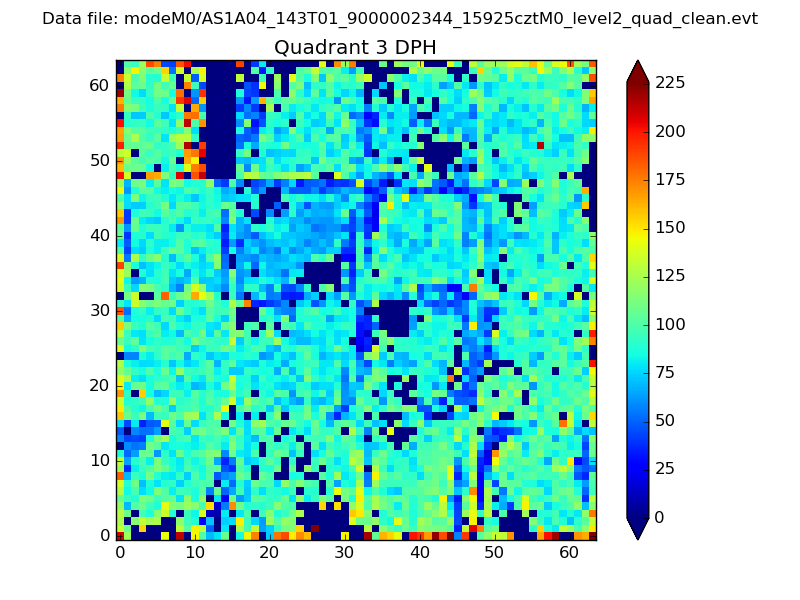 |
 |
Quadrant C |
| Plot type | Count rate plots | Images |
|---|---|---|
| Comparison with Poisson distribution Blue bars denote a histogram of data divided into 1 sec bins. Red curve is a Poisson curve with rate = median count rate of data. |
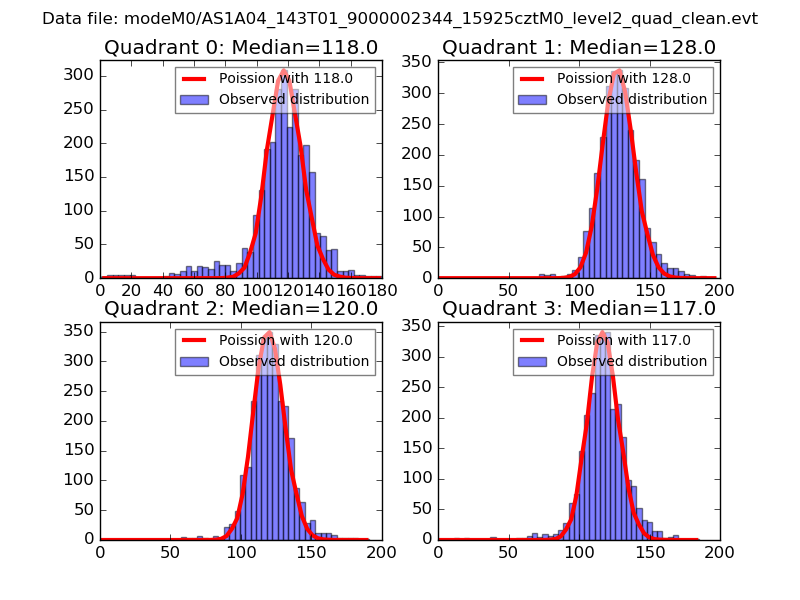 |
 |
| Quadrant-wise count rates Data is divided into 100 sec bins |
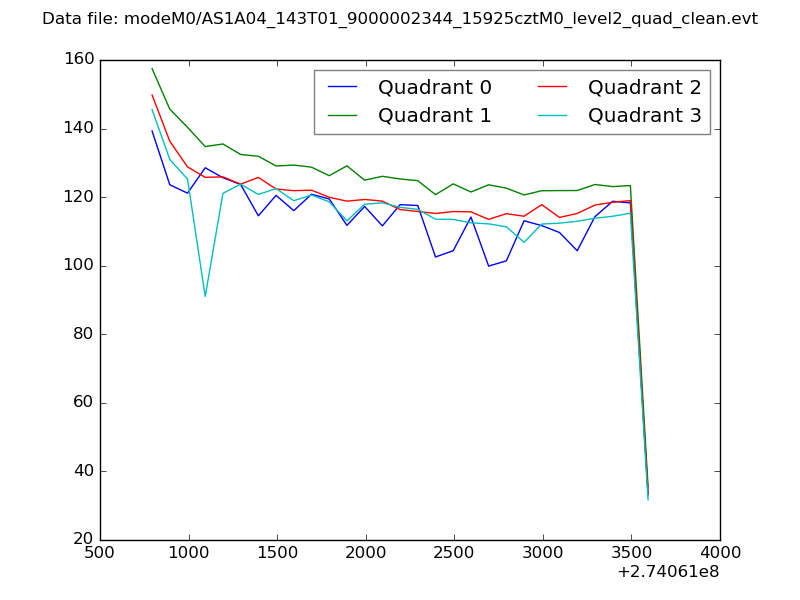 |
|
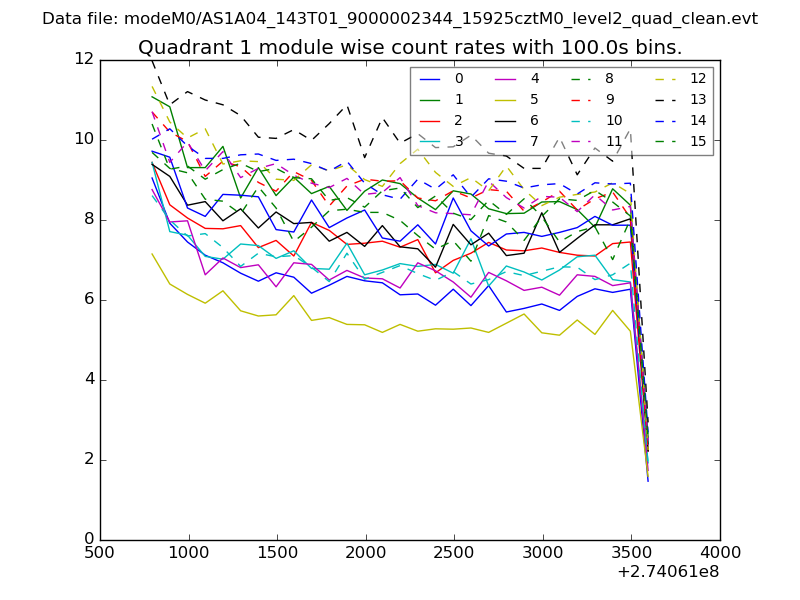
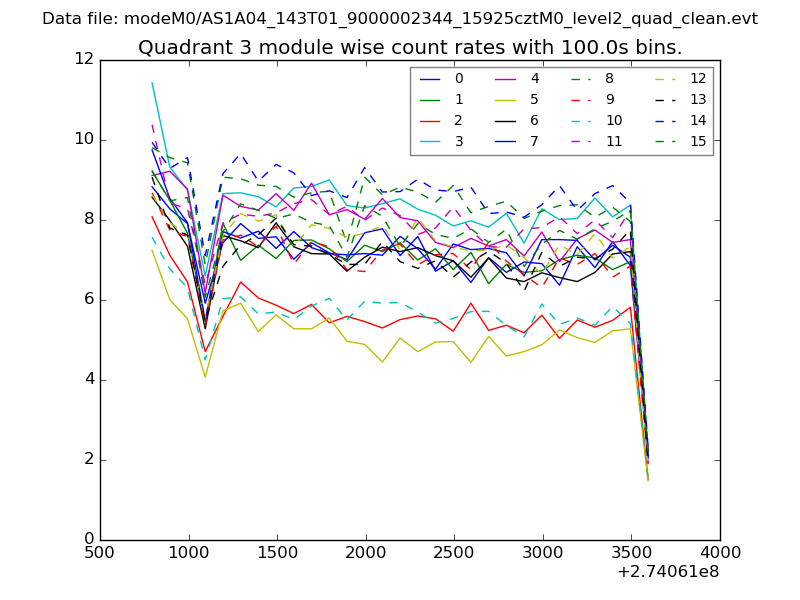
| Module-wise count rates for Quadrant A Data is divided into 100 sec bins |
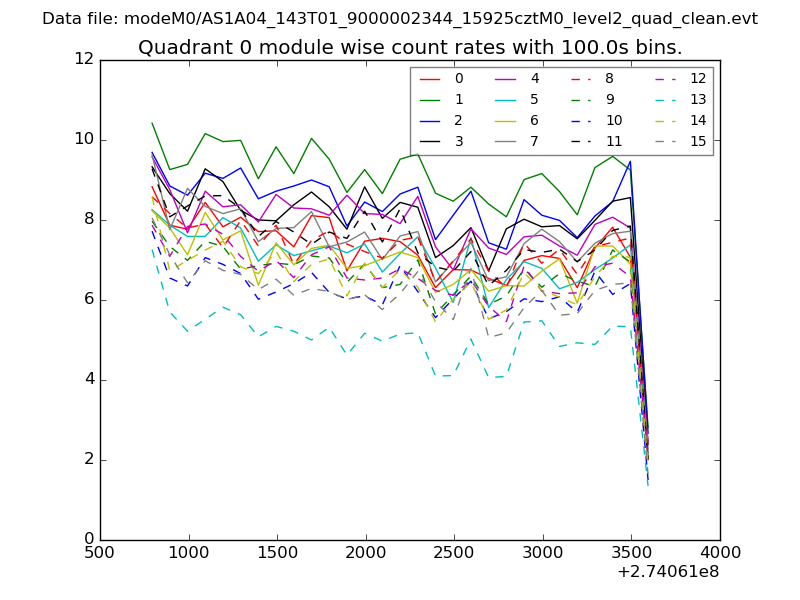 |
 |
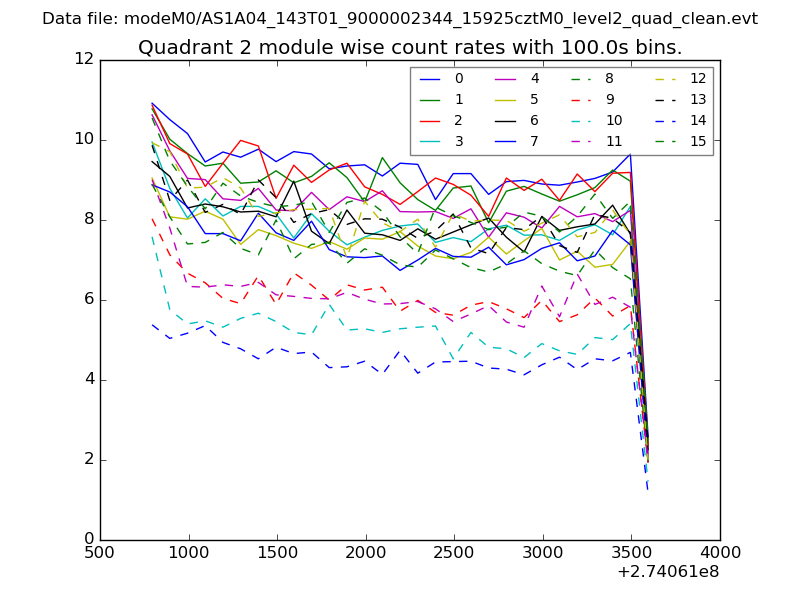
| Module-wise count rates for Quadrant B Data is divided into 100 sec bins |
 |
 |
| Module-wise count rates for Quadrant C Data is divided into 100 sec bins |
 |
 |
| Module-wise count rates for Quadrant D Data is divided into 100 sec bins |
 |
 |
| Parameter | Plot |
|---|---|
| CZT HV Monitor | 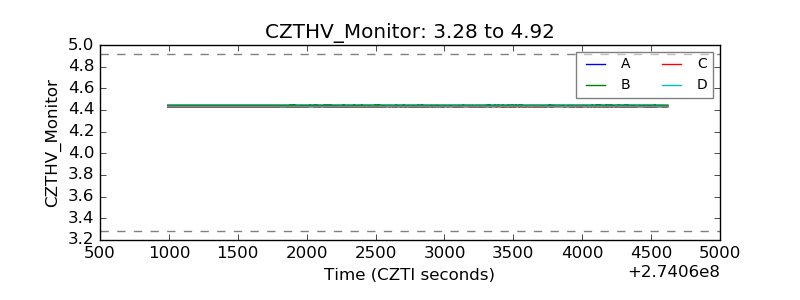 |
| D_VDD | 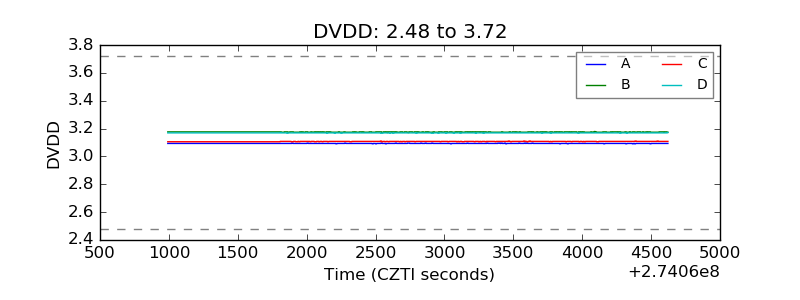 |
| Temperature 1 | 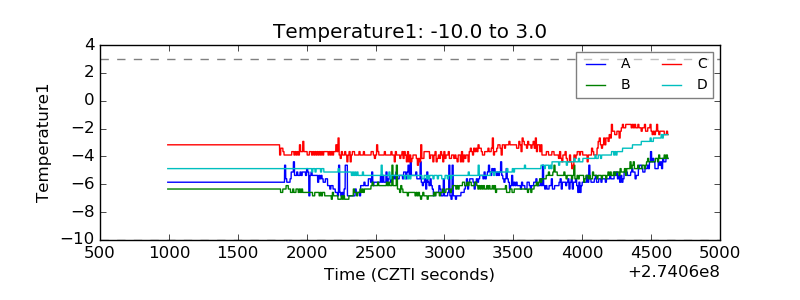 |
| Veto HV Monitor | 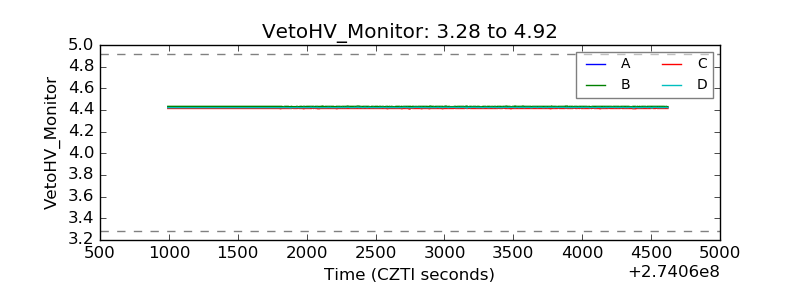 |
| Veto LLD | 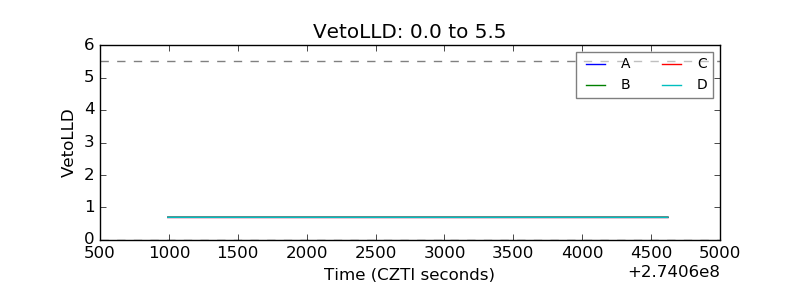 |
| Alpha Counter |  |
| _CPM_Rate | 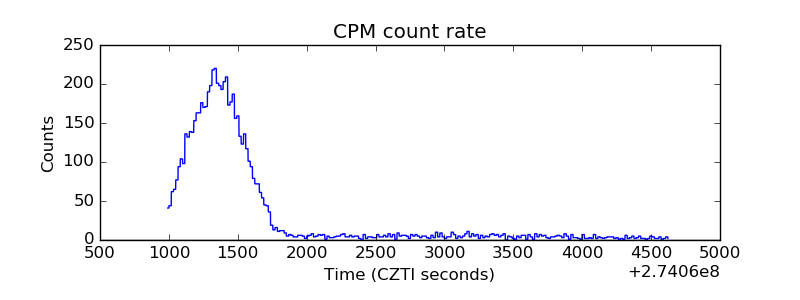 |
| CZT Counter | 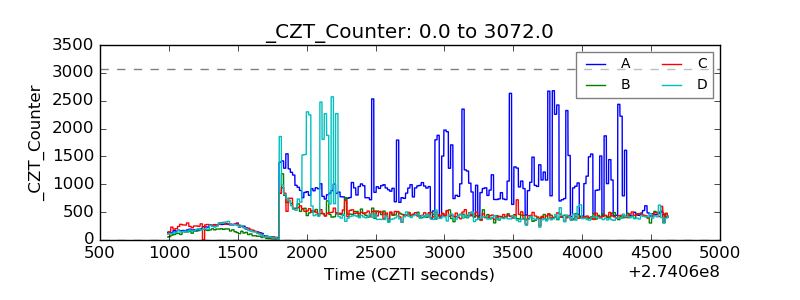 |
| +2.5 Volts monitor |  |
| +5 Volts monitor |  |
| _ROLL_ROT | 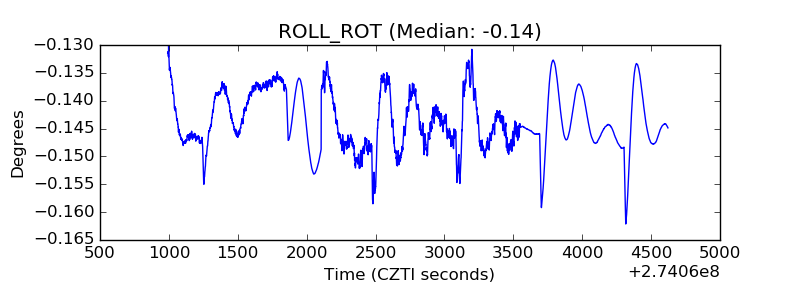 |
| _Roll_DEC | 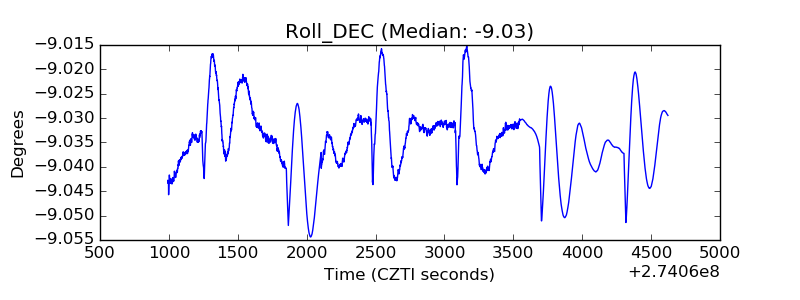 |
| _Roll_RA | 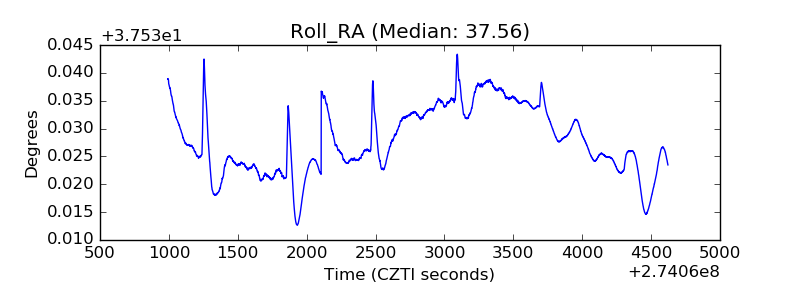 |
| Veto Counter | 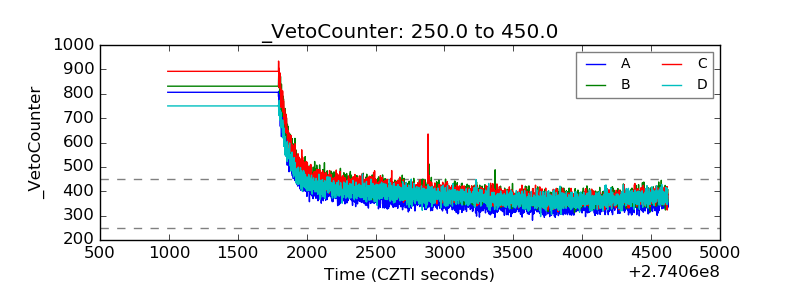 |