| Param | Original file | Final file |
|---|---|---|
| Filename | modeM0/AS1A04_104T03_9000002348cztM0_level2.fits | modeM0/AS1A04_104T03_9000002348cztM0_level2_quad_clean.evt |
| Size (bytes) | 614,966,400 | 500,855,040 |
| Size | 586.5 MB | 477.7 MB |
| Events in quadrant A | 3,792,832 | 2,825,512 |
| Events in quadrant B | 3,626,542 | 2,828,248 |
| Events in quadrant C | 3,666,490 | 2,698,361 |
| Events in quadrant D | 3,230,208 | 2,506,488 |
| Mode SS | |||
|---|---|---|---|
| Quadrant | BADHDUFLAG | Total packets | Discarded packets |
| A | 0 | 1276 | 0 |
| B | 0 | 1276 | 0 |
| C | 0 | 1276 | 0 |
| D | 0 | 1276 | 0 |
| Mode M9 | |||
|---|---|---|---|
| Quadrant | BADHDUFLAG | Total packets | Discarded packets |
| A | 0 | 109 | 0 |
| B | 0 | 109 | 0 |
| C | 0 | 109 | 0 |
| D | 0 | 109 | 0 |
| Mode M0 | |||
|---|---|---|---|
| Quadrant | BADHDUFLAG | Total packets | Discarded packets |
| A | 0 | 134186 | 0 |
| B | 0 | 138898 | 0 |
| C | 0 | 132694 | 0 |
| D | 0 | 132953 | 0 |
| Quadrant | Total seconds | Saturated seconds | Saturation percentage |
|---|---|---|---|
| A | 62833 | 886 | 1.410087% |
| B | 62833 | 1086 | 1.728391% |
| C | 62833 | 964 | 1.534226% |
| D | 62833 | 625 | 0.994700% |
Noise dominated data is calculated using 1-second bins in cleaned event files. If a bin has >2000 counts, and if more than 50% of those come from <1% of pixels, then it is considered to be noise-dominated and hence unusable.
| Quadrant | # 1 sec bins | Bins with >0 counts | Bins with >2000 counts | High rate bins dominated by noise | Noise dominated (total time) | Noise dominated (detector-on time) | Marked lightcurve |
|---|---|---|---|---|---|---|---|
| A | 72872 | 62819 | 0 | 0 | 0.00% | 0.00% |  |
| B | 72873 | 62827 | 0 | 0 | 0.00% | 0.00% |  |
| C | 72872 | 62829 | 0 | 0 | 0.00% | 0.00% |  |
| D | 72872 | 62826 | 0 | 0 | 0.00% | 0.00% | 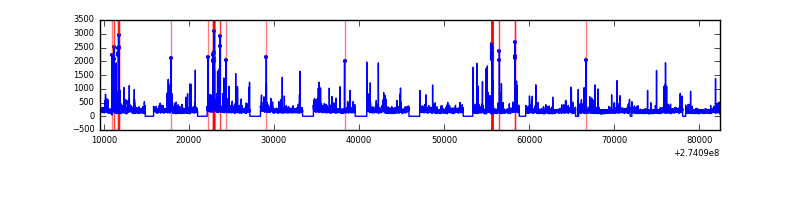 |
Top three noisy pixels from each quadrant. If the there are fewer than three noisy pixels in the level2.evt file, extra rows are filled as -1
| Pixel properties | Quadrant properties | ||||||
|---|---|---|---|---|---|---|---|
| Quadrant | DetID | PixID | Counts | Sigma | Mean | Median | Sigma |
| A | 0 | 29 | 3588 | 11.08 | 985 | 921 | 240.7 |
| A | 7 | 110 | 2983 | 8.57 | 985 | 921 | 240.7 |
| A | 15 | 236 | 2870 | 8.1 | 985 | 921 | 240.7 |
| B | 2 | 9 | 2870 | 10.37 | 958 | 916 | 188.4 |
| B | 3 | 80 | 2566 | 8.76 | 958 | 916 | 188.4 |
| B | 5 | 128 | 2470 | 8.25 | 958 | 916 | 188.4 |
| C | 12 | 241 | 2568 | 6.64 | 968 | 901 | 251.1 |
| C | 2 | 191 | 2527 | 6.47 | 968 | 901 | 251.1 |
| C | 3 | 158 | 2488 | 6.32 | 968 | 901 | 251.1 |
| D | 3 | 14 | 2440 | 6.52 | 921 | 835 | 246.2 |
| D | 6 | 231 | 2371 | 6.24 | 921 | 835 | 246.2 |
| D | 7 | 3 | 2258 | 5.78 | 921 | 835 | 246.2 |
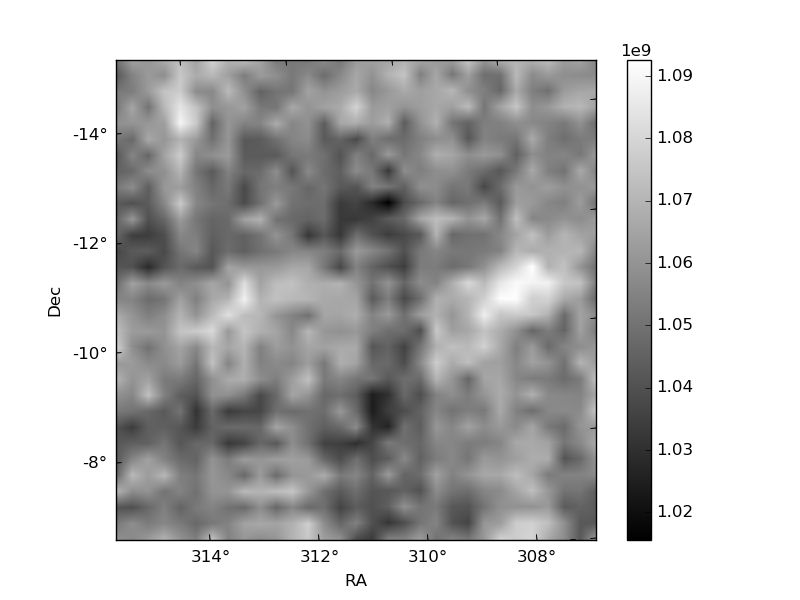
Histogram calculated using DETX and DETY for each event in the final _common_clean file
| Quadrant A | 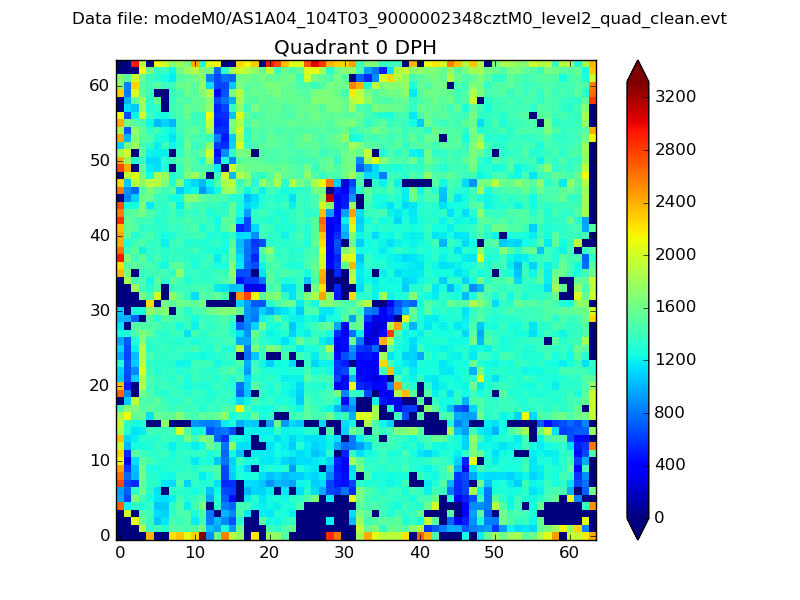 |
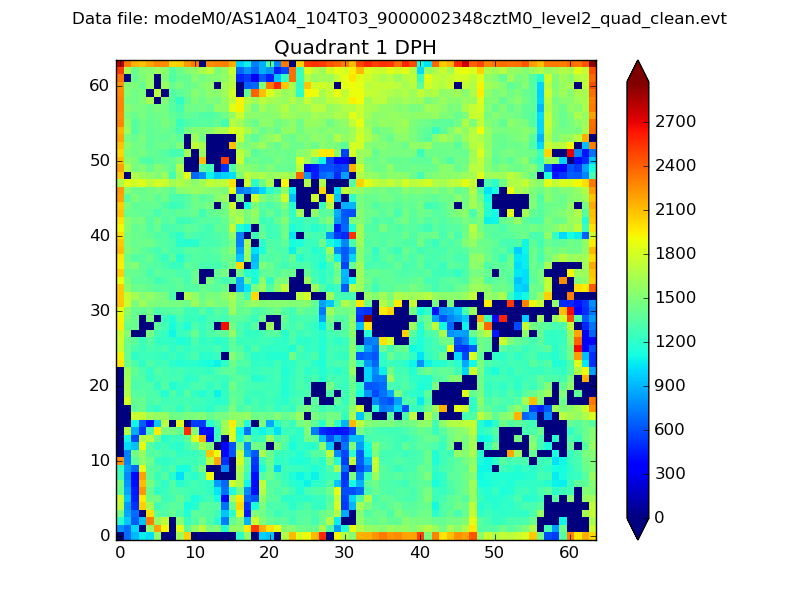 |
Quadrant B |
|---|---|---|---|
| Quadrant D |  |
 |
Quadrant C |
| Plot type | Count rate plots | Images |
|---|---|---|
| Comparison with Poisson distribution Blue bars denote a histogram of data divided into 1 sec bins. Red curve is a Poisson curve with rate = median count rate of data. |
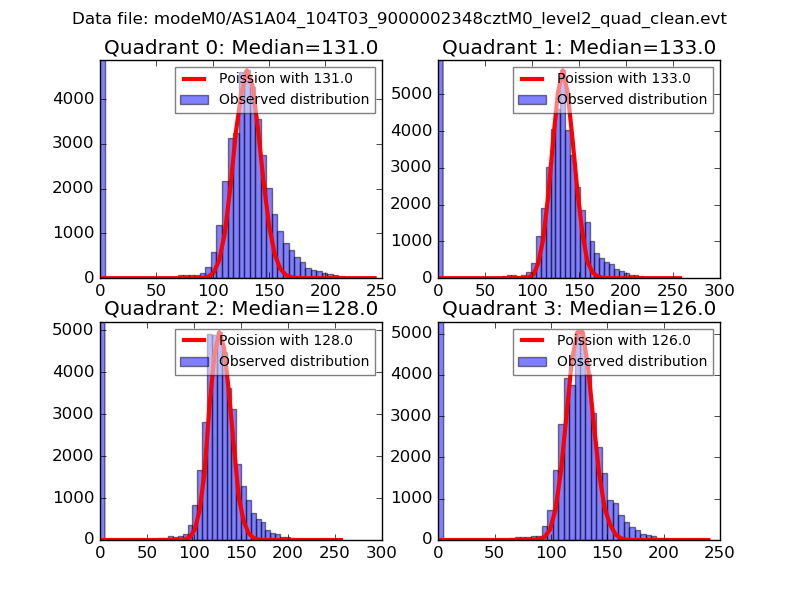 |
 |
| Quadrant-wise count rates Data is divided into 100 sec bins |
 |
|
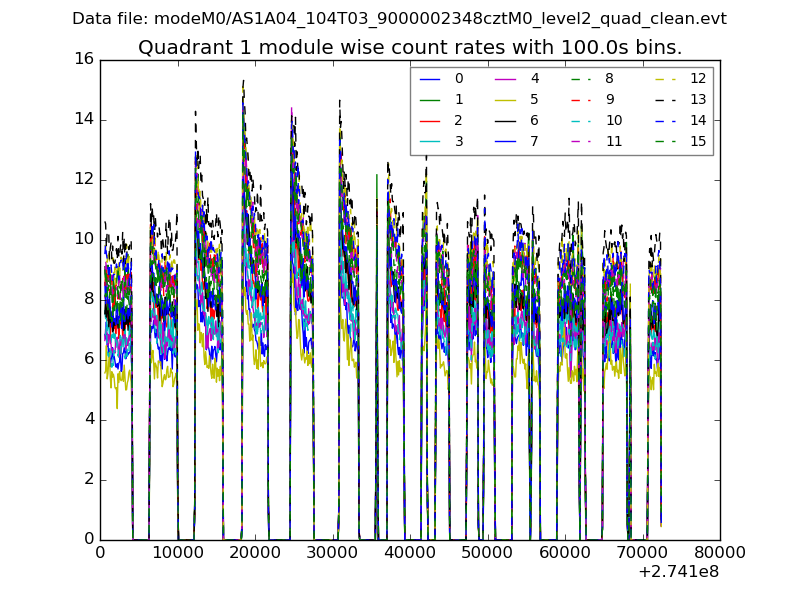
| Module-wise count rates for Quadrant A Data is divided into 100 sec bins |
 |
 |
| Module-wise count rates for Quadrant B Data is divided into 100 sec bins |
 |
 |
| Module-wise count rates for Quadrant C Data is divided into 100 sec bins |
 |
 |
| Module-wise count rates for Quadrant D Data is divided into 100 sec bins |
 |
 |
| Parameter | Plot |
|---|---|
| CZT HV Monitor | 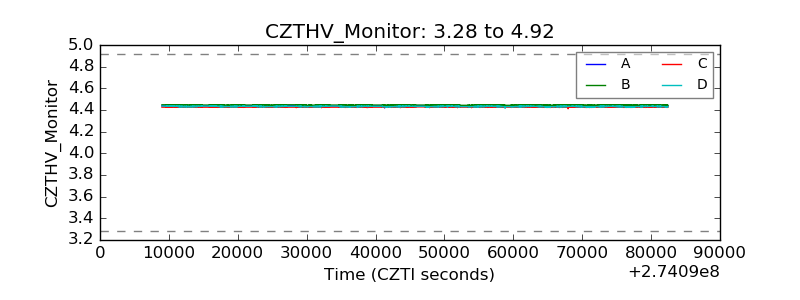 |
| D_VDD | 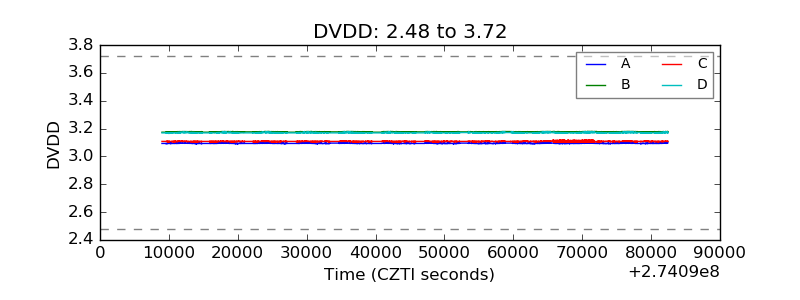 |
| Temperature 1 |  |
| Veto HV Monitor |  |
| Veto LLD |  |
| Alpha Counter |  |
| _CPM_Rate |  |
| CZT Counter |  |
| +2.5 Volts monitor |  |
| +5 Volts monitor | 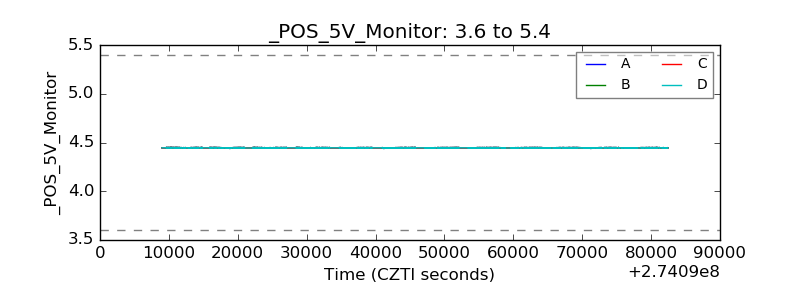 |
| _ROLL_ROT | 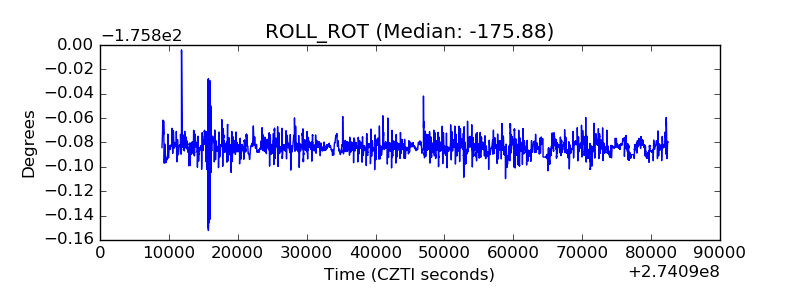 |
| _Roll_DEC |  |
| _Roll_RA |  |
| Veto Counter |  |