| Param | Original file | Final file |
|---|---|---|
| Filename | modeM0/AS1A04_104T03_9000002348_15930cztM0_level2.evt | modeM0/AS1A04_104T03_9000002348_15930cztM0_level2_quad_clean.evt |
| Size (bytes) | 111,628,800 | 11,571,840 |
| Size | 106.5 MB | 11.0 MB |
| Events in quadrant A | 864,743 | 59,330 |
| Events in quadrant B | 803,391 | 62,220 |
| Events in quadrant C | 793,552 | 58,525 |
| Events in quadrant D | 811,157 | 55,342 |
| Mode SS | |||
|---|---|---|---|
| Quadrant | BADHDUFLAG | Total packets | Discarded packets |
| A | 0 | 32 | 0 |
| B | 0 | 32 | 0 |
| C | 0 | 32 | 0 |
| D | 0 | 32 | 0 |
| Mode M9 | |||
|---|---|---|---|
| Quadrant | BADHDUFLAG | Total packets | Discarded packets |
| A | 0 | 6 | 0 |
| B | 0 | 6 | 0 |
| C | 0 | 6 | 0 |
| D | 0 | 6 | 0 |
| Mode M0 | |||
|---|---|---|---|
| Quadrant | BADHDUFLAG | Total packets | Discarded packets |
| A | 0 | 3489 | 2 |
| B | 0 | 3210 | 1 |
| C | 0 | 3189 | 1 |
| D | 0 | 3327 | 1 |
| Quadrant | Total seconds | Saturated seconds | Saturation percentage |
|---|---|---|---|
| A | 1541 | 15 | 0.973394% |
| B | 1541 | 18 | 1.168073% |
| C | 1541 | 25 | 1.622323% |
| D | 1541 | 22 | 1.427644% |
Noise dominated data is calculated using 1-second bins in cleaned event files. If a bin has >2000 counts, and if more than 50% of those come from <1% of pixels, then it is considered to be noise-dominated and hence unusable.
| Quadrant | # 1 sec bins | Bins with >0 counts | Bins with >2000 counts | High rate bins dominated by noise | Noise dominated (total time) | Noise dominated (detector-on time) | Marked lightcurve |
|---|---|---|---|---|---|---|---|
| A | 1542 | 1542 | 0 | 0 | 0.00% | 0.00% | 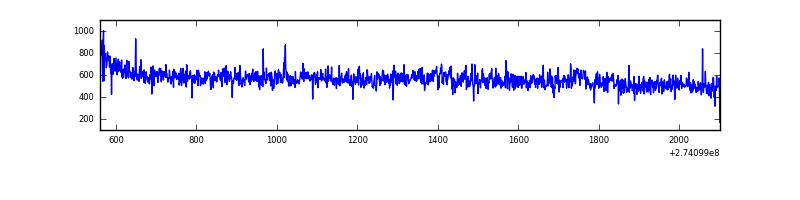 |
| B | 1542 | 1542 | 1 | 1 | 0.06% | 0.06% | 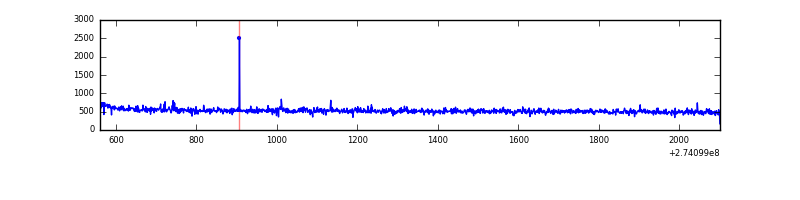 |
| C | 1542 | 1542 | 0 | 0 | 0.00% | 0.00% | 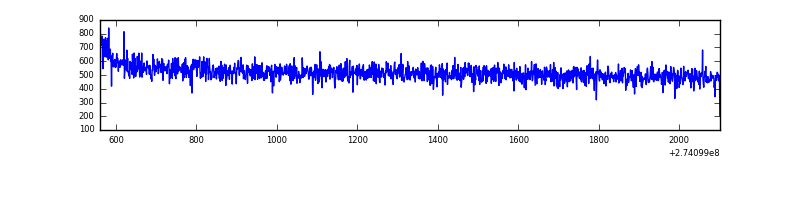 |
| D | 1542 | 1542 | 16 | 16 | 1.04% | 1.04% | 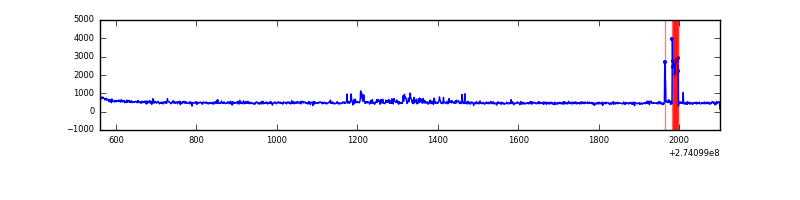 |
Top three noisy pixels from each quadrant. If the there are fewer than three noisy pixels in the level2.evt file, extra rows are filled as -1
| Pixel properties | Quadrant properties | ||||||
|---|---|---|---|---|---|---|---|
| Quadrant | DetID | PixID | Counts | Sigma | Mean | Median | Sigma |
| A | 15 | 239 | 86940 | 2036.93 | 202 | 197 | 42.6 |
| A | 15 | 157 | 1776 | 37.08 | 202 | 197 | 42.6 |
| A | 0 | 226 | 1640 | 33.89 | 202 | 197 | 42.6 |
| B | 4 | 173 | 5288 | 124.78 | 203 | 197 | 40.8 |
| B | 12 | 111 | 4933 | 116.08 | 203 | 197 | 40.8 |
| B | 11 | 111 | 4277 | 100.0 | 203 | 197 | 40.8 |
| C | 14 | 238 | 30320 | 639.12 | 194 | 194 | 47.1 |
| C | 3 | 233 | 5115 | 104.4 | 194 | 194 | 47.1 |
| C | 13 | 61 | 1315 | 23.78 | 194 | 194 | 47.1 |
| D | 15 | 0 | 48846 | 1003.24 | 194 | 188 | 48.5 |
| D | 2 | 136 | 18727 | 382.24 | 194 | 188 | 48.5 |
| D | 2 | 120 | 5093 | 101.13 | 194 | 188 | 48.5 |
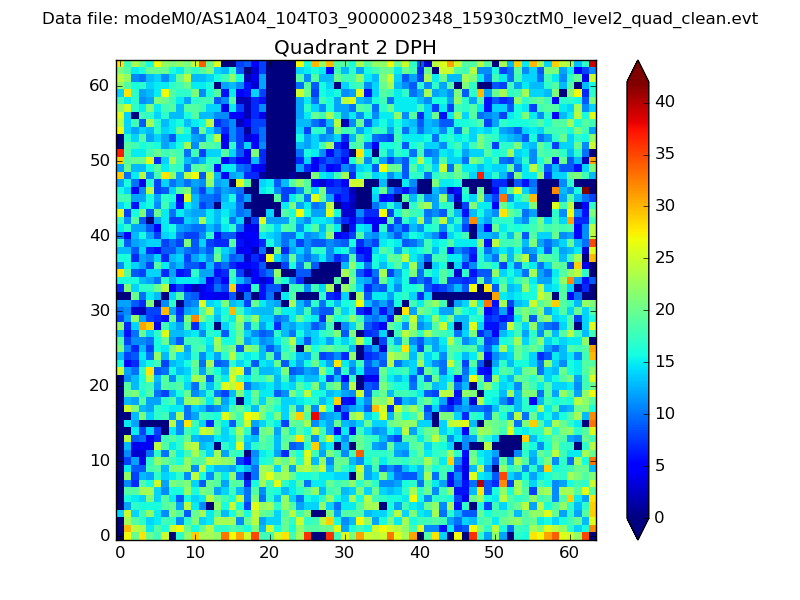
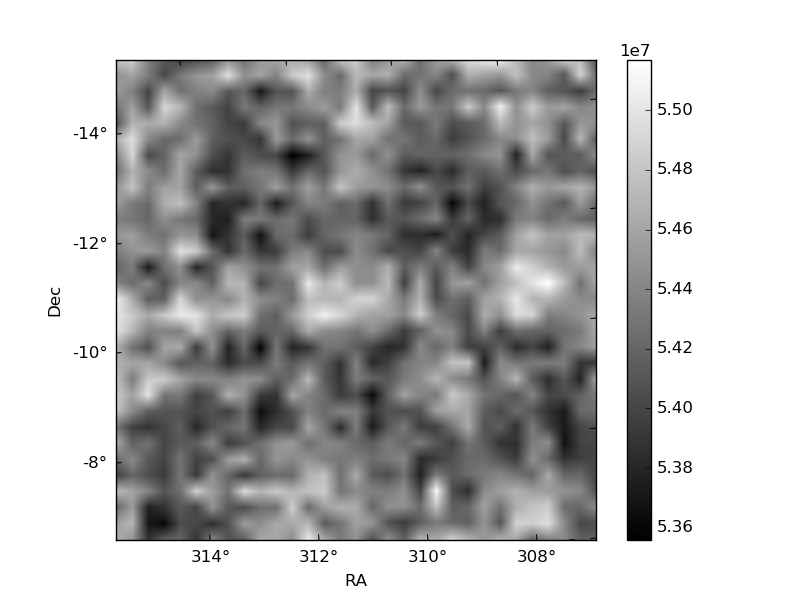
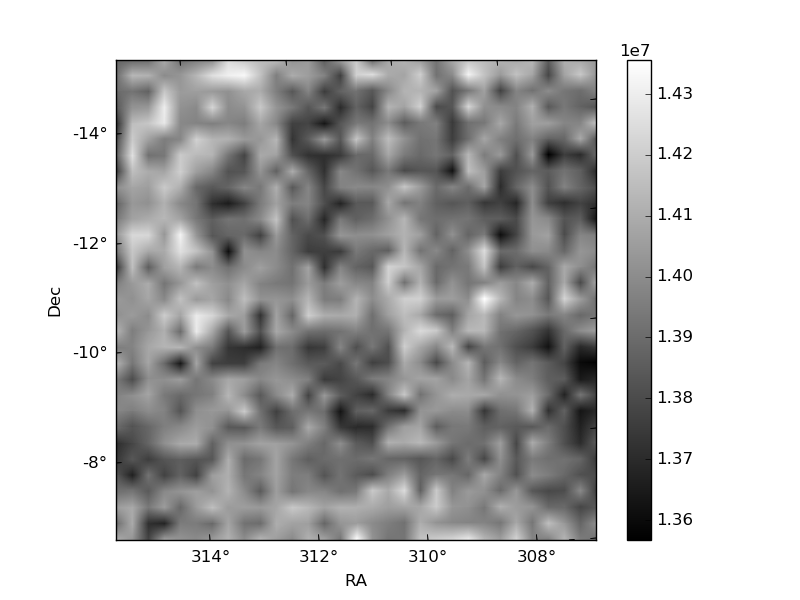
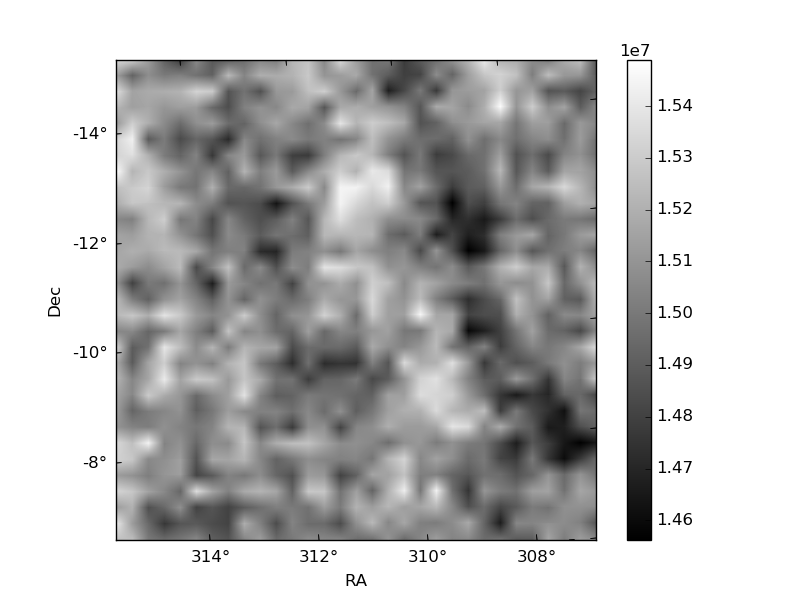
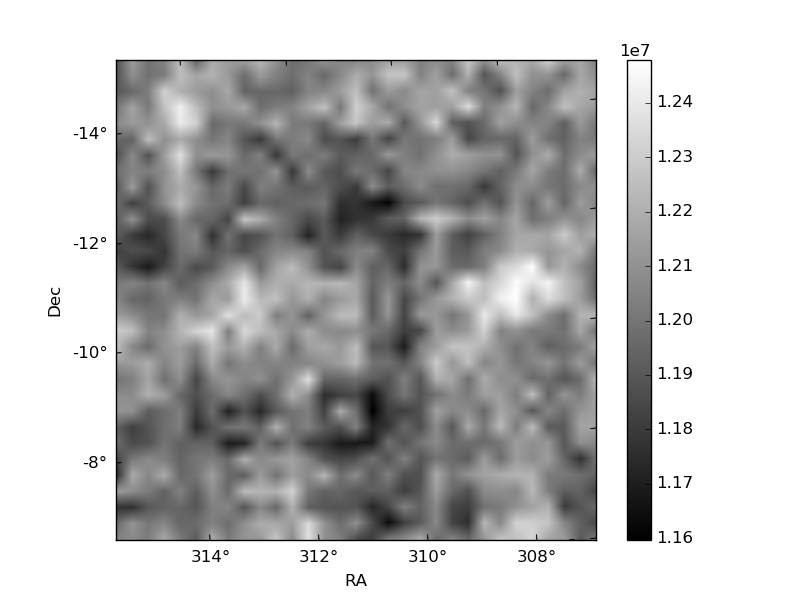
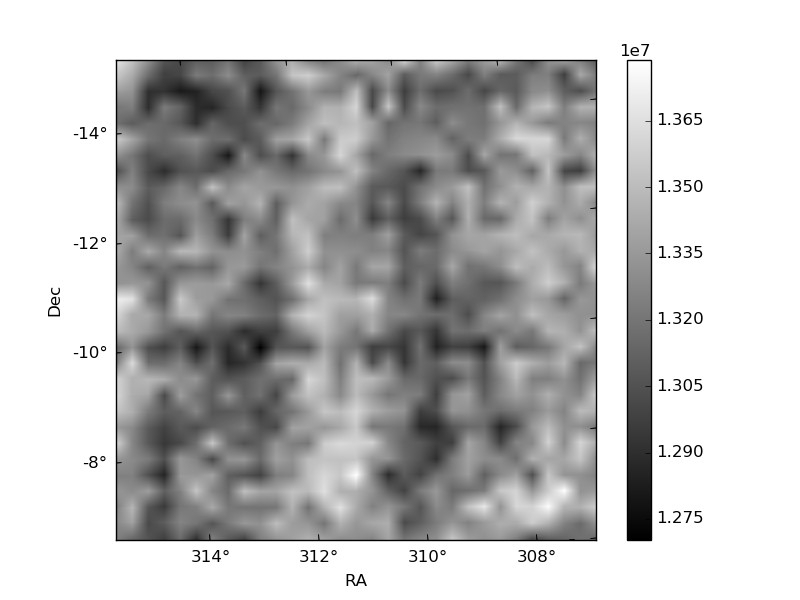
Histogram calculated using DETX and DETY for each event in the final _common_clean file
| Quadrant A | 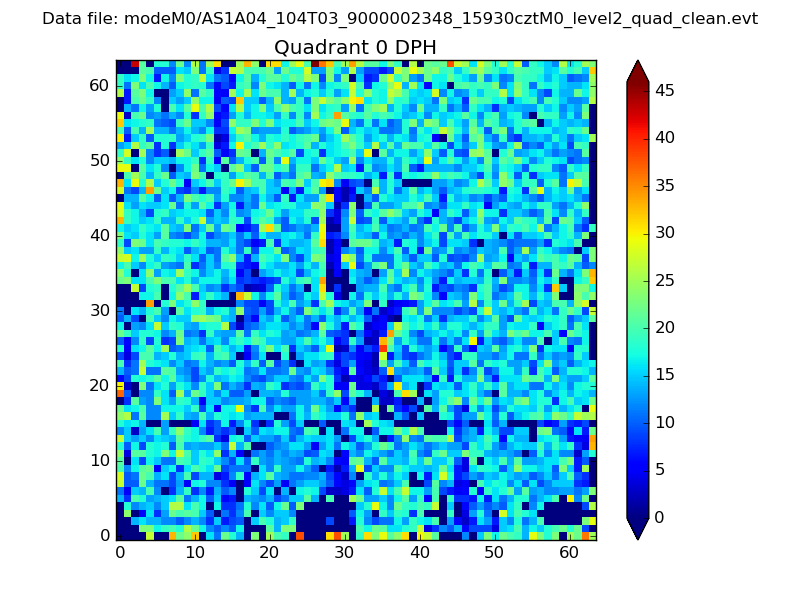 |
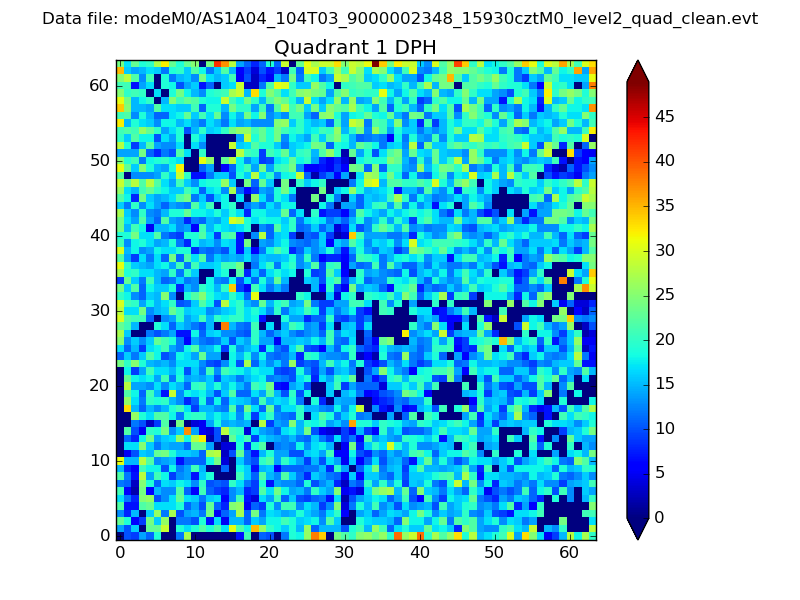 |
Quadrant B |
|---|---|---|---|
| Quadrant D | 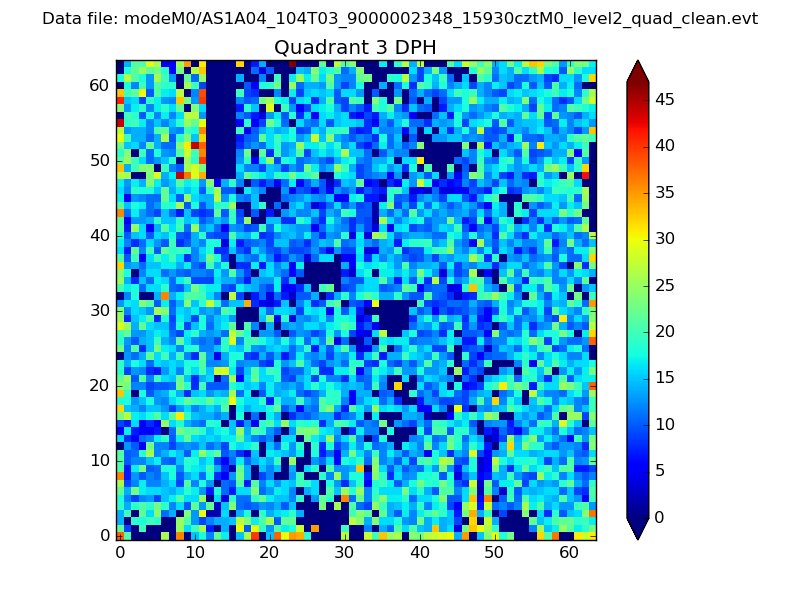 |
 |
Quadrant C |
| Plot type | Count rate plots | Images |
|---|---|---|
| Comparison with Poisson distribution Blue bars denote a histogram of data divided into 1 sec bins. Red curve is a Poisson curve with rate = median count rate of data. |
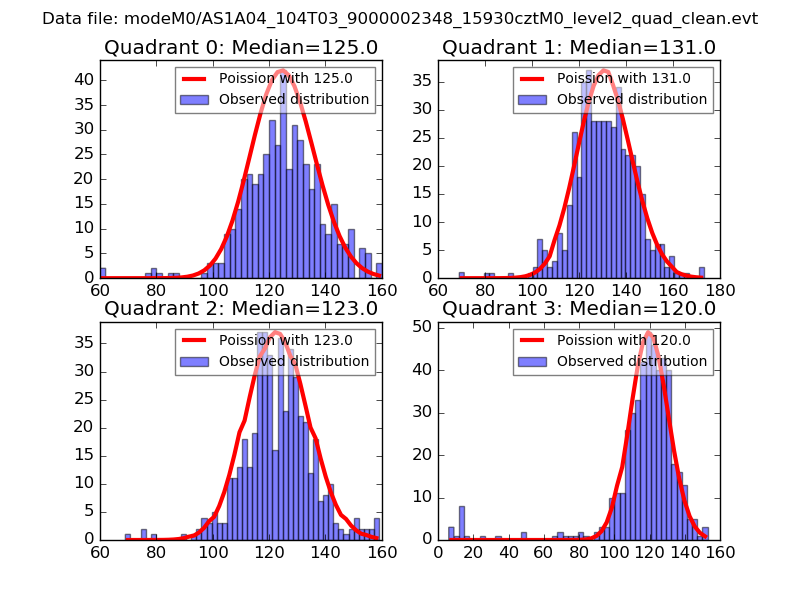 |
 |
| Quadrant-wise count rates Data is divided into 100 sec bins |
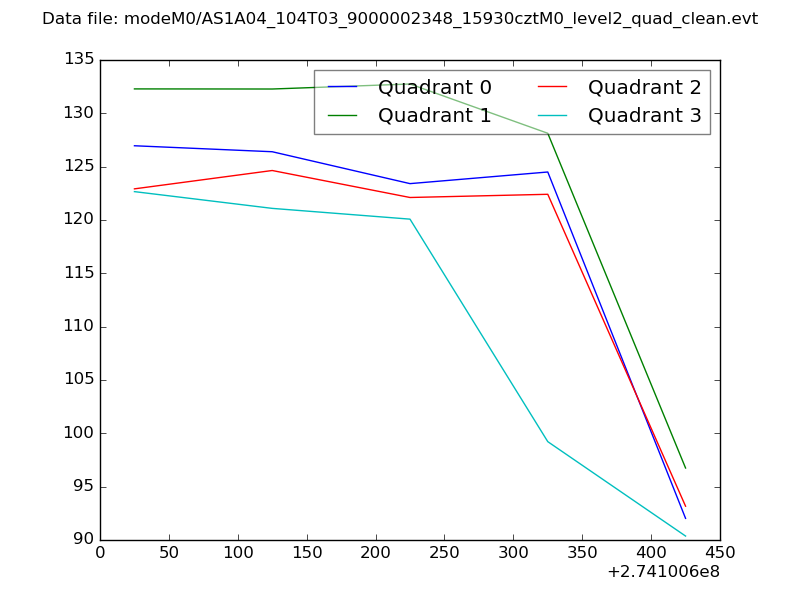 |
|
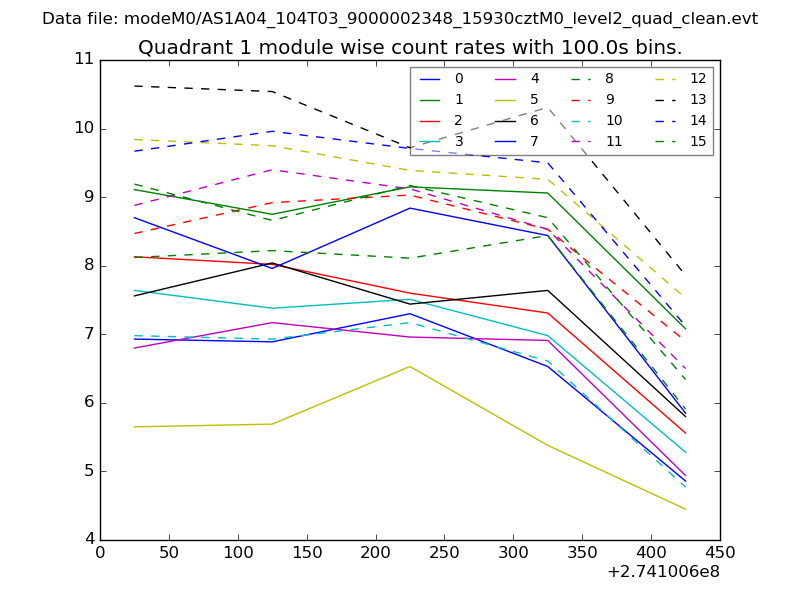
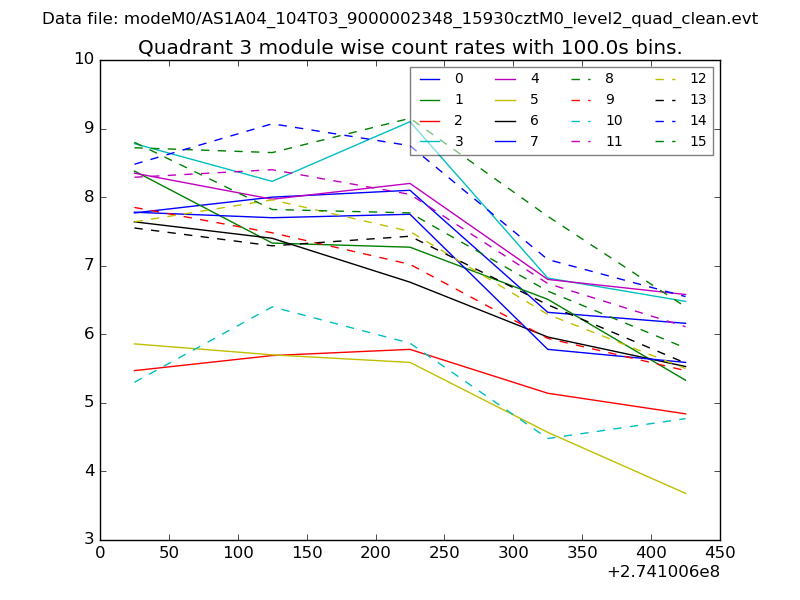
| Module-wise count rates for Quadrant A Data is divided into 100 sec bins |
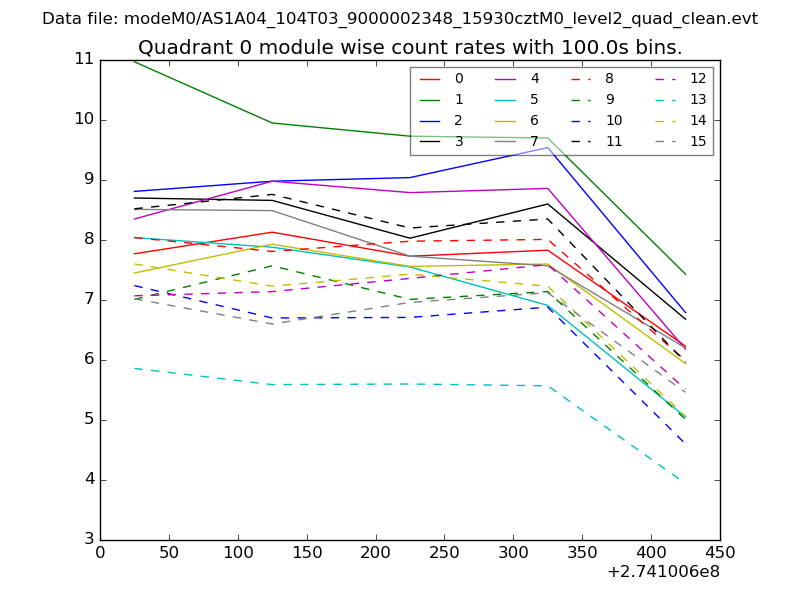 |
 |
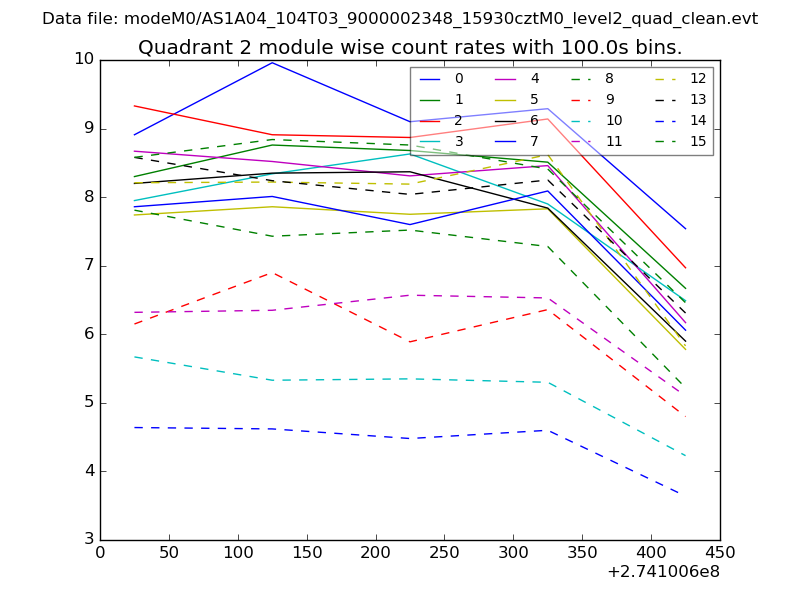
| Module-wise count rates for Quadrant B Data is divided into 100 sec bins |
 |
 |
| Module-wise count rates for Quadrant C Data is divided into 100 sec bins |
 |
 |
| Module-wise count rates for Quadrant D Data is divided into 100 sec bins |
 |
 |
| Parameter | Plot |
|---|---|
| CZT HV Monitor | 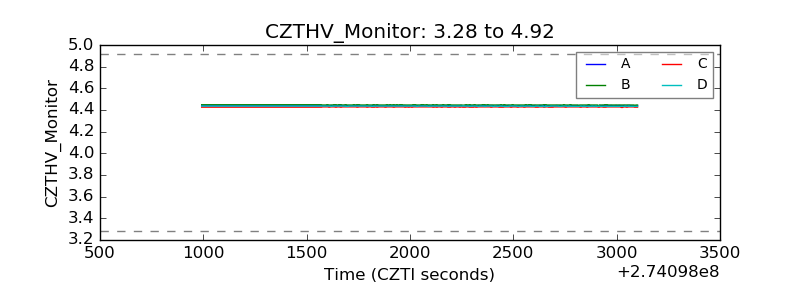 |
| D_VDD | 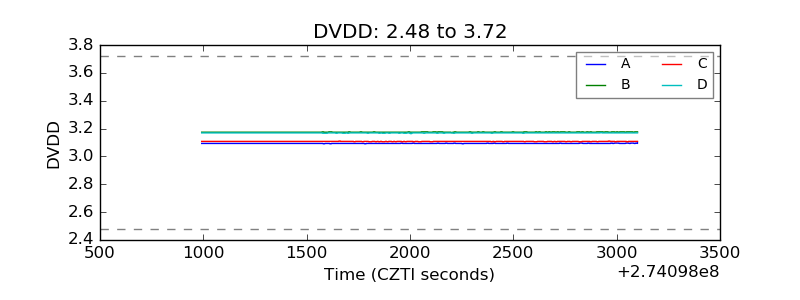 |
| Temperature 1 | 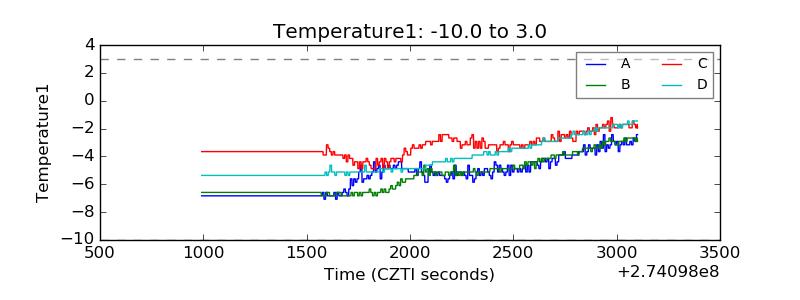 |
| Veto HV Monitor | 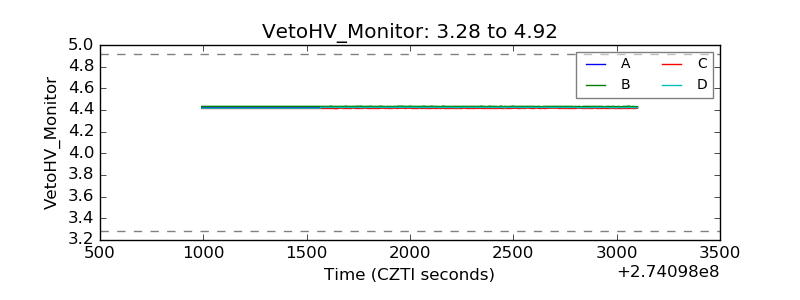 |
| Veto LLD | 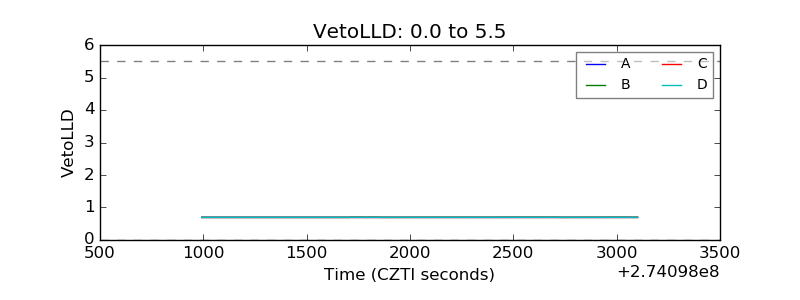 |
| Alpha Counter | 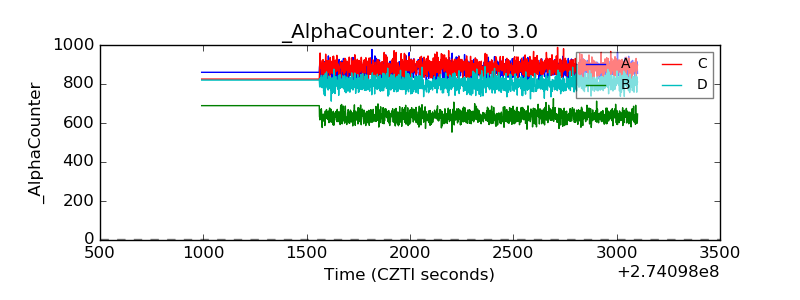 |
| _CPM_Rate | 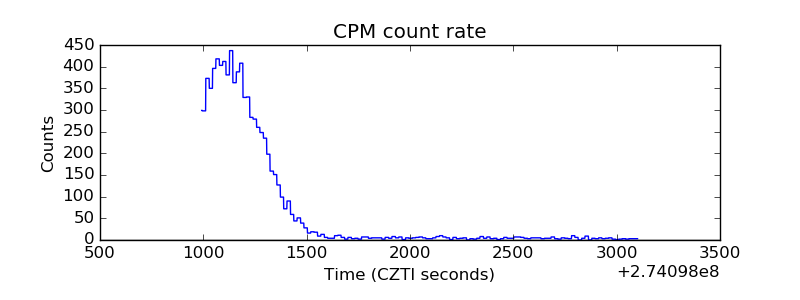 |
| CZT Counter | 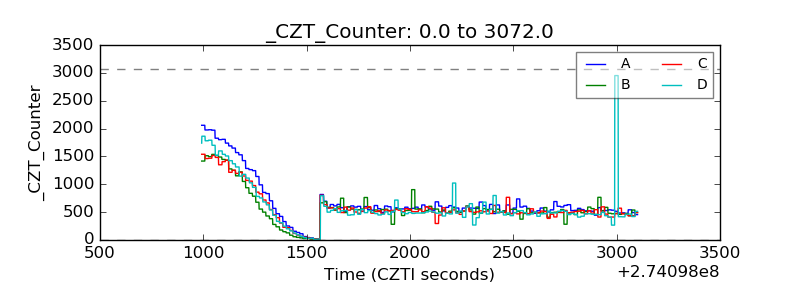 |
| +2.5 Volts monitor |  |
| +5 Volts monitor |  |
| _ROLL_ROT | 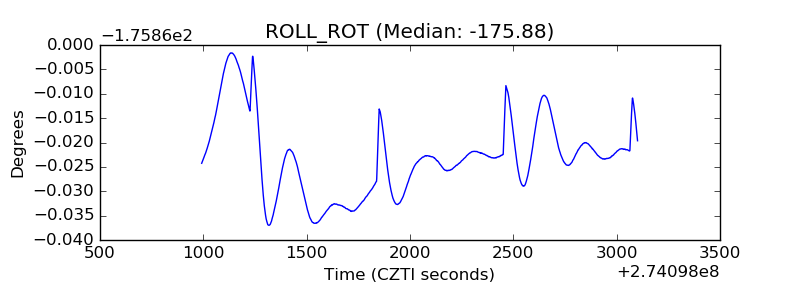 |
| _Roll_DEC | 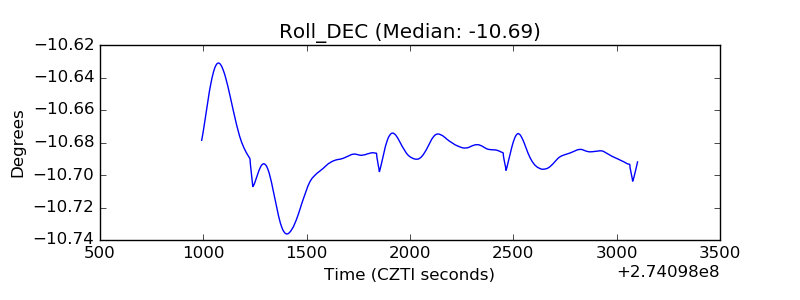 |
| _Roll_RA | 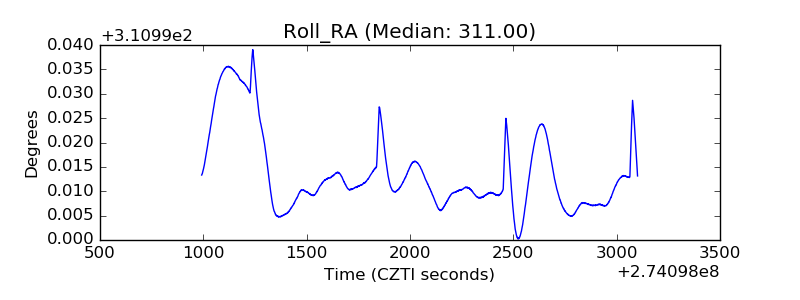 |
| Veto Counter | 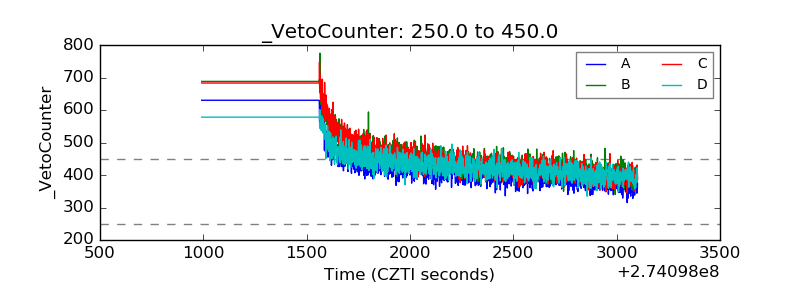 |