| Param | Original file | Final file |
|---|---|---|
| Filename | modeM0/AS1A04_104T03_9000002348_15931cztM0_level2.evt | modeM0/AS1A04_104T03_9000002348_15931cztM0_level2_quad_clean.evt |
| Size (bytes) | 472,273,920 | 87,647,040 |
| Size | 450.4 MB | 83.6 MB |
| Events in quadrant A | 3,722,224 | 549,662 |
| Events in quadrant B | 3,439,127 | 563,076 |
| Events in quadrant C | 3,306,909 | 540,010 |
| Events in quadrant D | 3,374,608 | 529,423 |
| Mode SS | |||
|---|---|---|---|
| Quadrant | BADHDUFLAG | Total packets | Discarded packets |
| A | 0 | 138 | 0 |
| B | 0 | 138 | 0 |
| C | 0 | 138 | 0 |
| D | 0 | 138 | 0 |
| Mode M9 | |||
|---|---|---|---|
| Quadrant | BADHDUFLAG | Total packets | Discarded packets |
| A | 0 | 16 | 0 |
| B | 0 | 16 | 0 |
| C | 0 | 16 | 0 |
| D | 0 | 16 | 0 |
| Mode M0 | |||
|---|---|---|---|
| Quadrant | BADHDUFLAG | Total packets | Discarded packets |
| A | 0 | 15040 | 3 |
| B | 0 | 14379 | 2 |
| C | 0 | 14022 | 2 |
| D | 0 | 14380 | 2 |
| Quadrant | Total seconds | Saturated seconds | Saturation percentage |
|---|---|---|---|
| A | 6771 | 56 | 0.827057% |
| B | 6771 | 72 | 1.063358% |
| C | 6771 | 84 | 1.240585% |
| D | 6771 | 68 | 1.004283% |
Noise dominated data is calculated using 1-second bins in cleaned event files. If a bin has >2000 counts, and if more than 50% of those come from <1% of pixels, then it is considered to be noise-dominated and hence unusable.
| Quadrant | # 1 sec bins | Bins with >0 counts | Bins with >2000 counts | High rate bins dominated by noise | Noise dominated (total time) | Noise dominated (detector-on time) | Marked lightcurve |
|---|---|---|---|---|---|---|---|
| A | 7767 | 6773 | 1 | 1 | 0.01% | 0.01% | 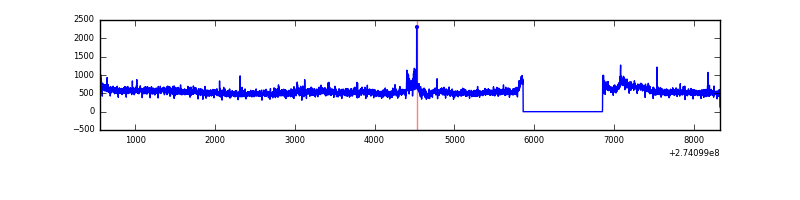 |
| B | 7767 | 6772 | 8 | 8 | 0.10% | 0.12% | 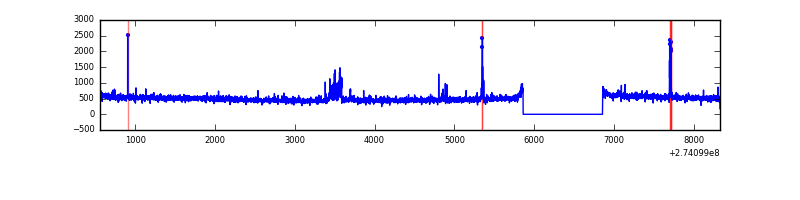 |
| C | 7767 | 6772 | 0 | 0 | 0.00% | 0.00% | 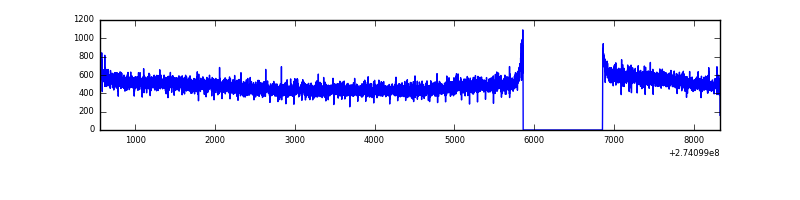 |
| D | 7767 | 6773 | 39 | 39 | 0.50% | 0.58% | 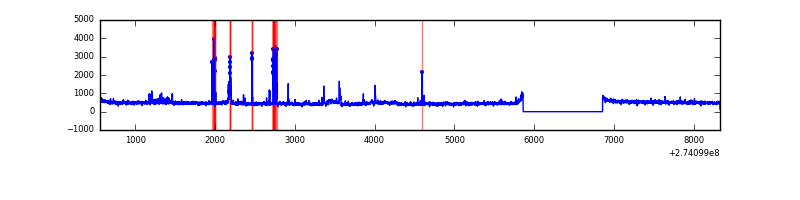 |
Top three noisy pixels from each quadrant. If the there are fewer than three noisy pixels in the level2.evt file, extra rows are filled as -1
| Pixel properties | Quadrant properties | ||||||
|---|---|---|---|---|---|---|---|
| Quadrant | DetID | PixID | Counts | Sigma | Mean | Median | Sigma |
| A | 15 | 239 | 482488 | 2806.91 | 842 | 826 | 171.6 |
| A | 0 | 226 | 7314 | 37.81 | 842 | 826 | 171.6 |
| A | 12 | 194 | 6216 | 31.41 | 842 | 826 | 171.6 |
| B | 4 | 216 | 69666 | 423.91 | 841 | 822 | 162.4 |
| B | 4 | 48 | 41667 | 251.51 | 841 | 822 | 162.4 |
| B | 12 | 111 | 19179 | 113.04 | 841 | 822 | 162.4 |
| C | 14 | 238 | 123315 | 653.36 | 802 | 809 | 187.5 |
| C | 3 | 233 | 56549 | 297.28 | 802 | 809 | 187.5 |
| C | 13 | 61 | 5482 | 24.92 | 802 | 809 | 187.5 |
| D | 15 | 0 | 201591 | 1006.39 | 815 | 790 | 199.5 |
| D | 13 | 169 | 26618 | 129.45 | 815 | 790 | 199.5 |
| D | 2 | 234 | 26514 | 128.93 | 815 | 790 | 199.5 |
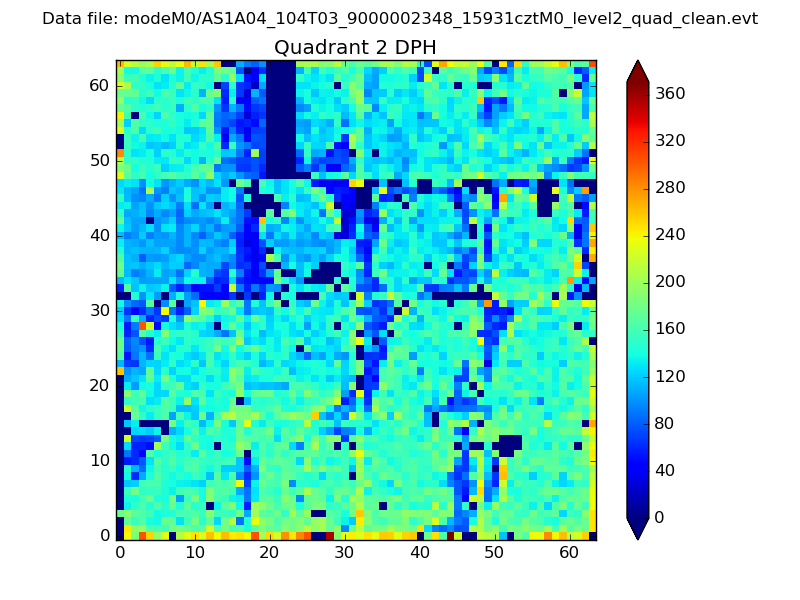
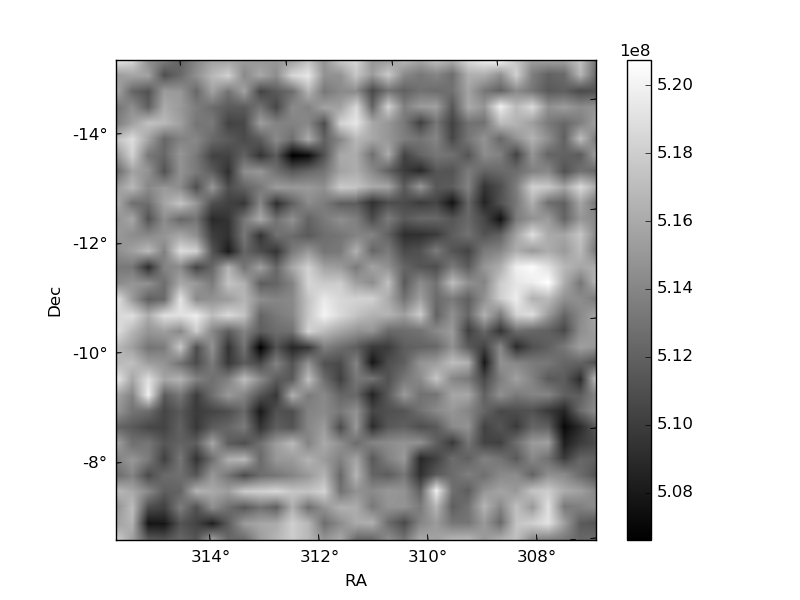
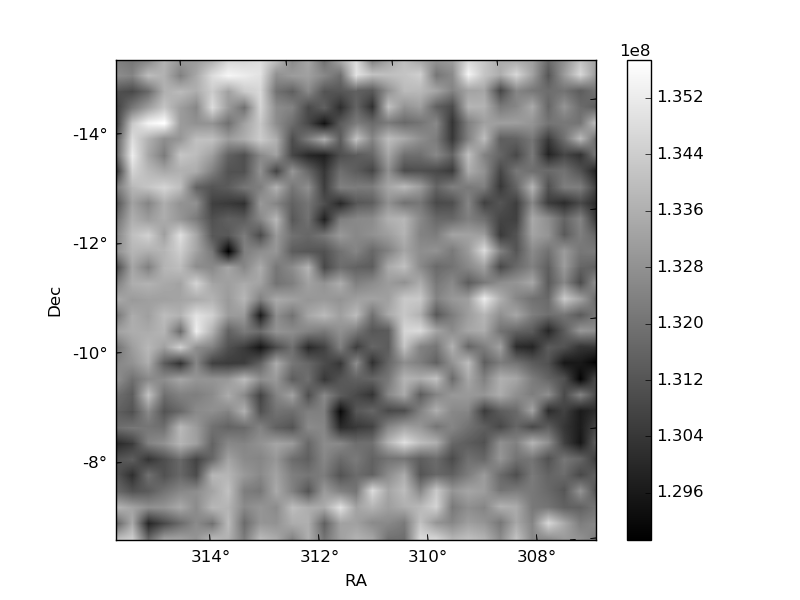
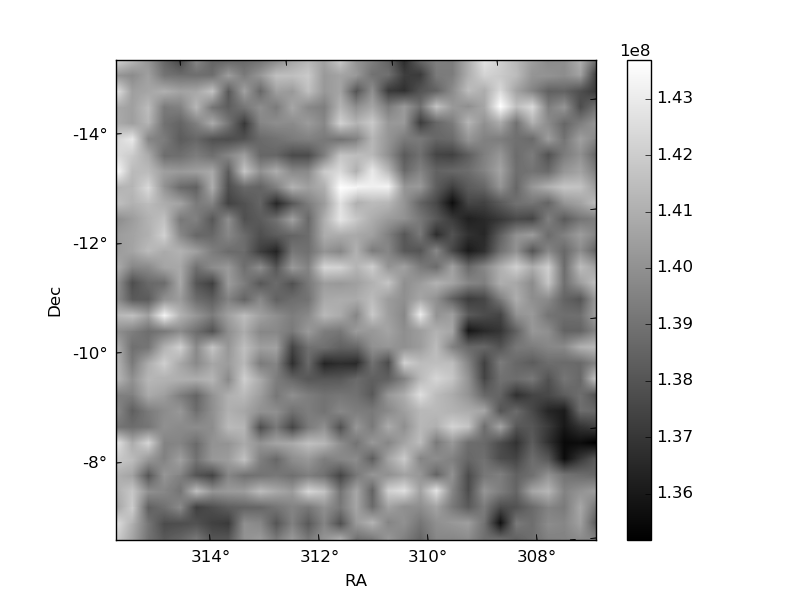
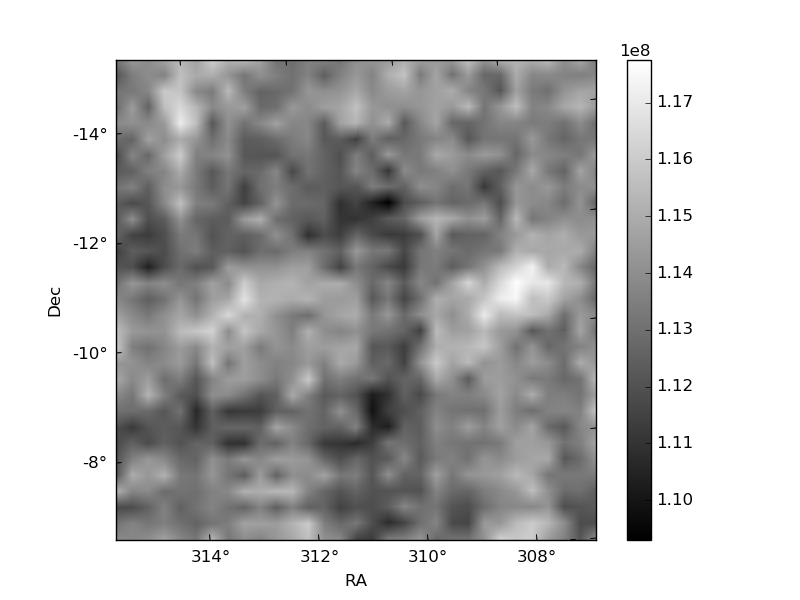
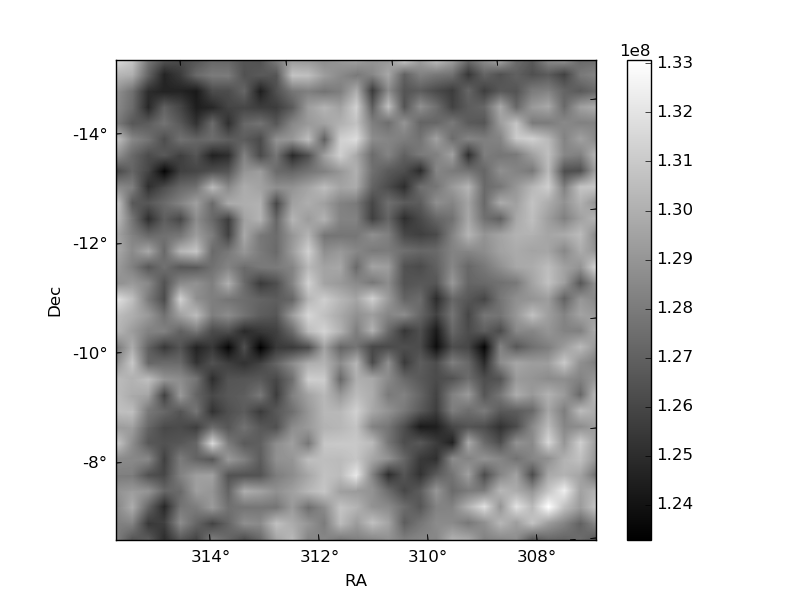
Histogram calculated using DETX and DETY for each event in the final _common_clean file
| Quadrant A | 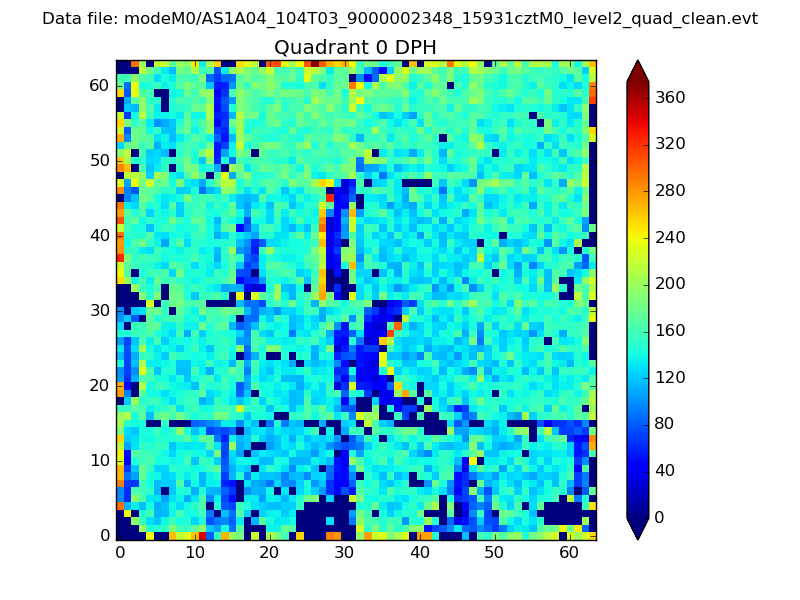 |
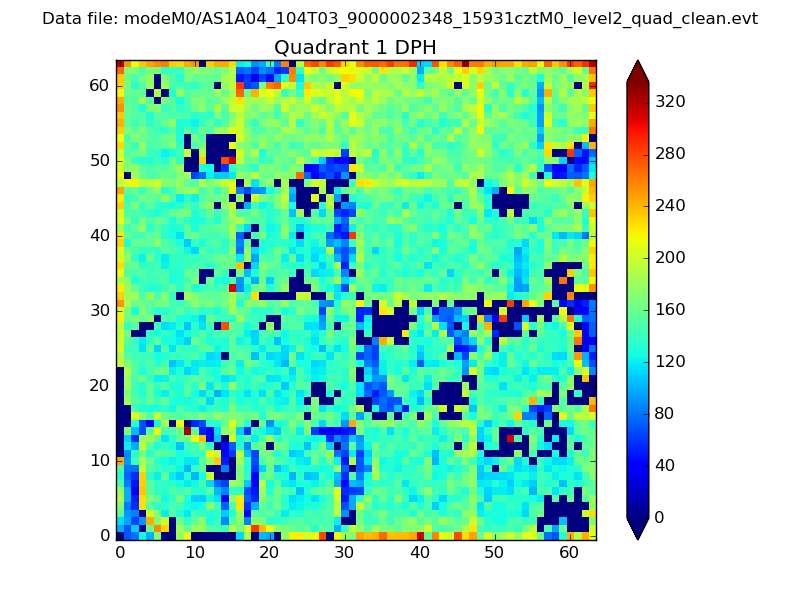 |
Quadrant B |
|---|---|---|---|
| Quadrant D | 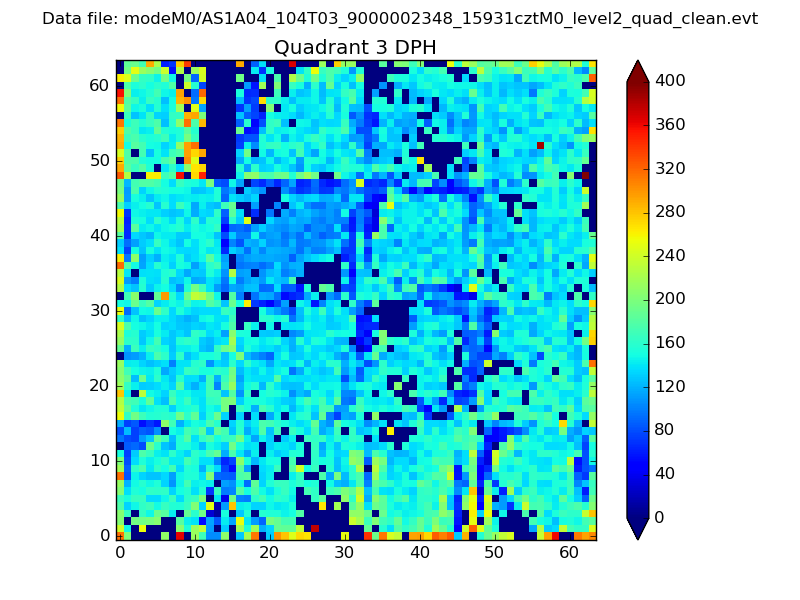 |
 |
Quadrant C |
| Plot type | Count rate plots | Images |
|---|---|---|
| Comparison with Poisson distribution Blue bars denote a histogram of data divided into 1 sec bins. Red curve is a Poisson curve with rate = median count rate of data. |
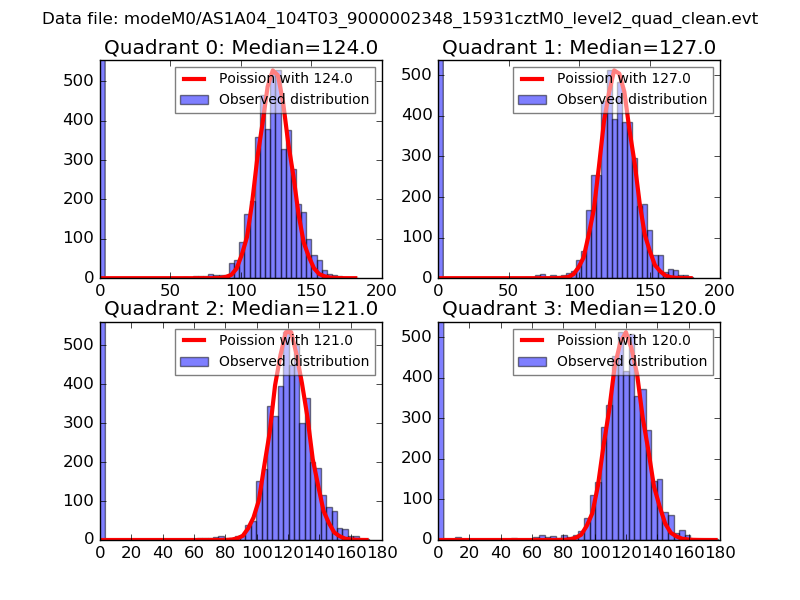 |
 |
| Quadrant-wise count rates Data is divided into 100 sec bins |
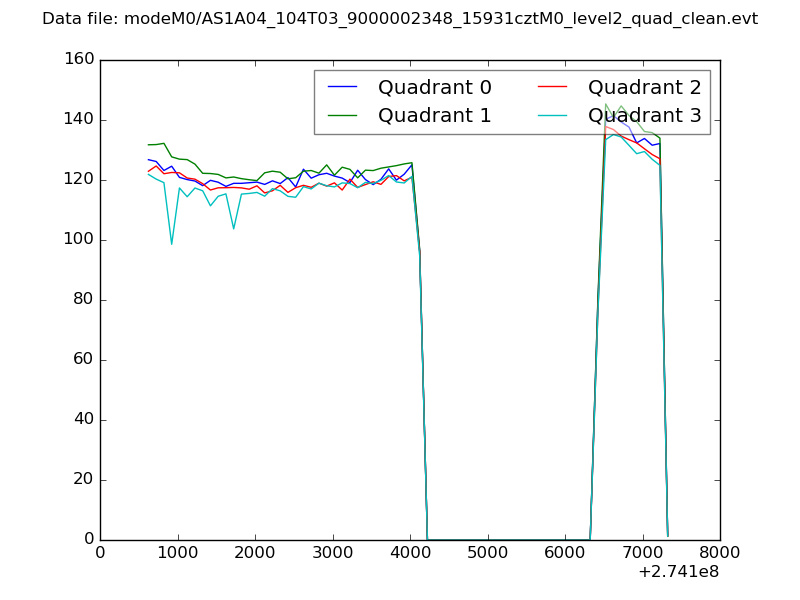 |
|
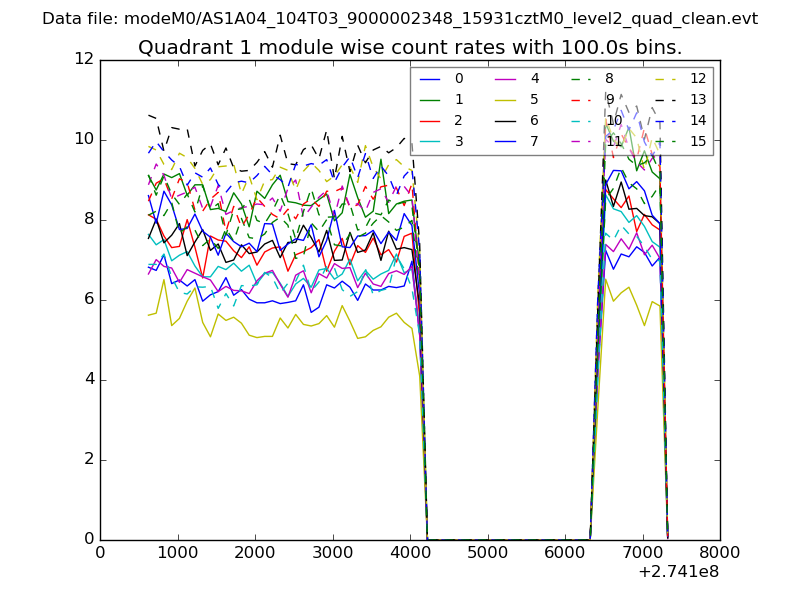
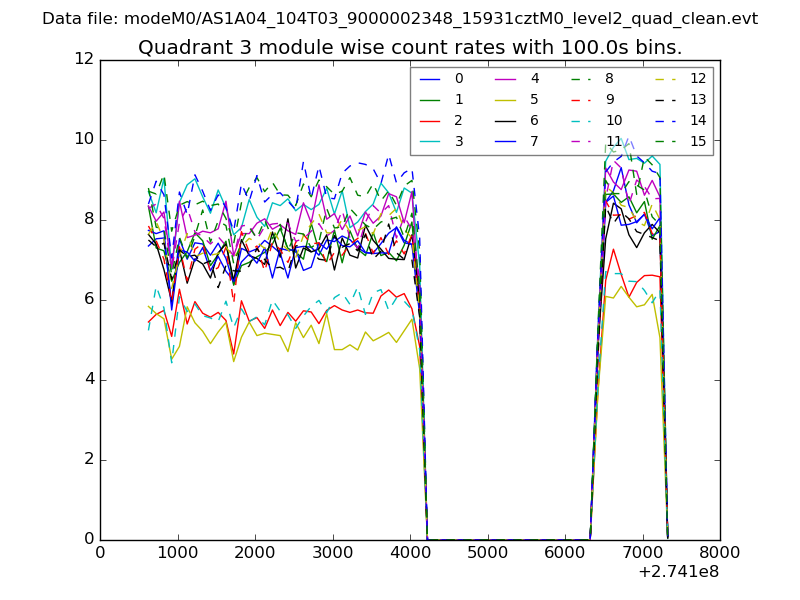
| Module-wise count rates for Quadrant A Data is divided into 100 sec bins |
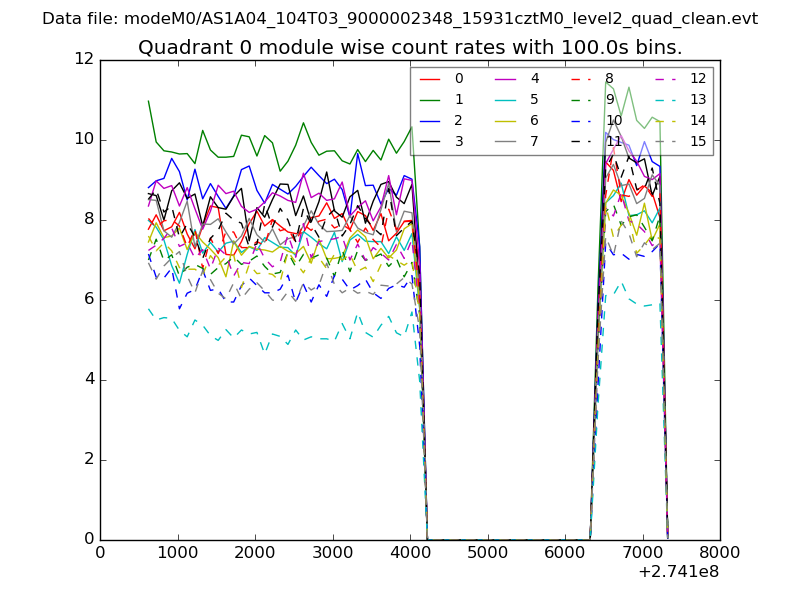 |
 |
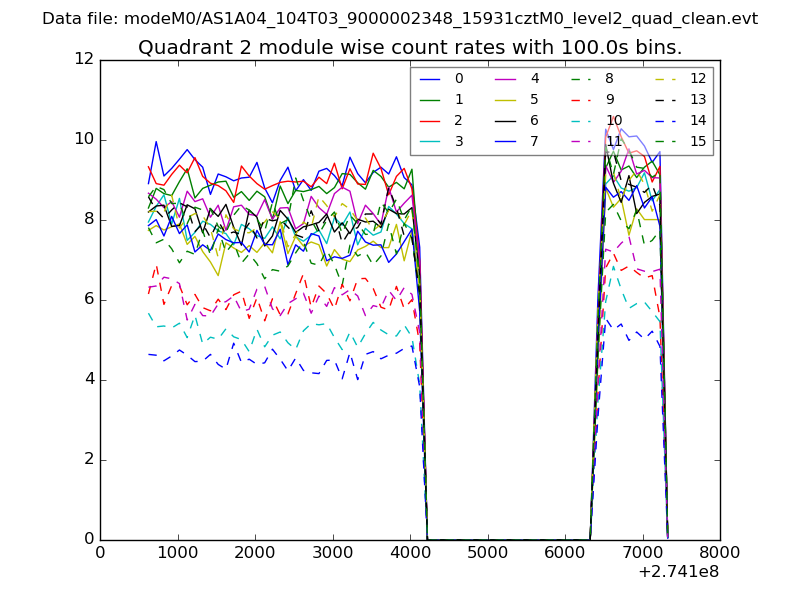
| Module-wise count rates for Quadrant B Data is divided into 100 sec bins |
 |
 |
| Module-wise count rates for Quadrant C Data is divided into 100 sec bins |
 |
 |
| Module-wise count rates for Quadrant D Data is divided into 100 sec bins |
 |
 |
| Parameter | Plot |
|---|---|
| CZT HV Monitor | 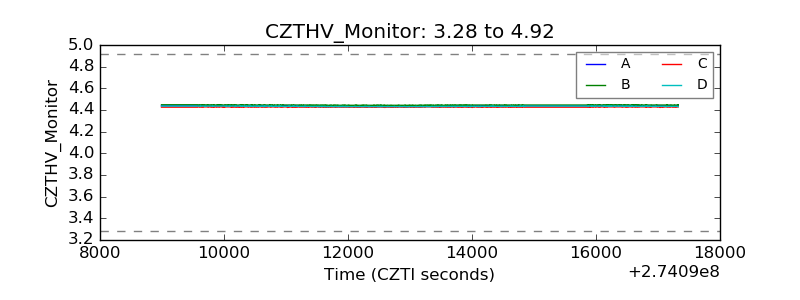 |
| D_VDD | 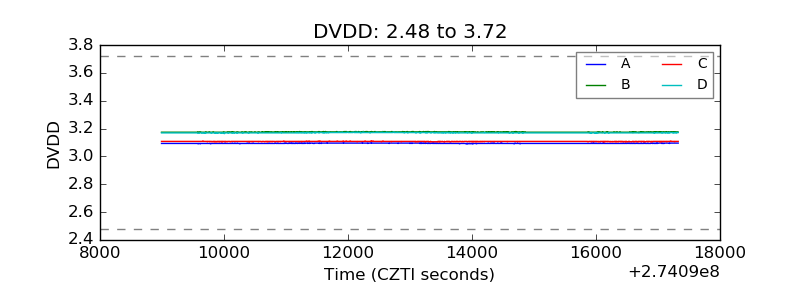 |
| Temperature 1 | 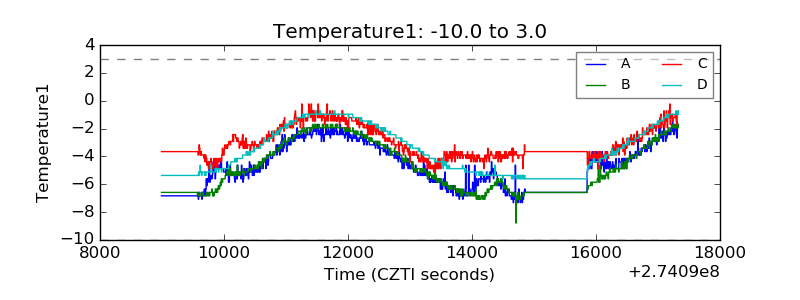 |
| Veto HV Monitor |  |
| Veto LLD | 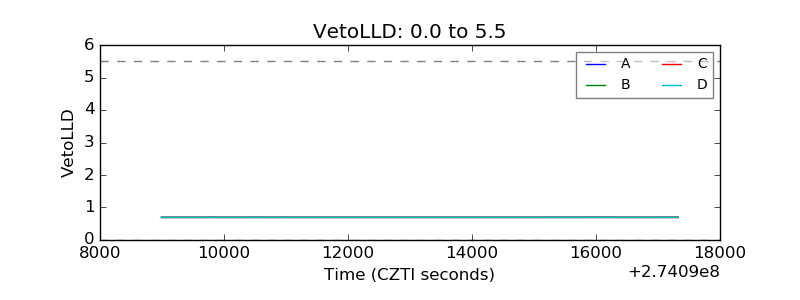 |
| Alpha Counter | 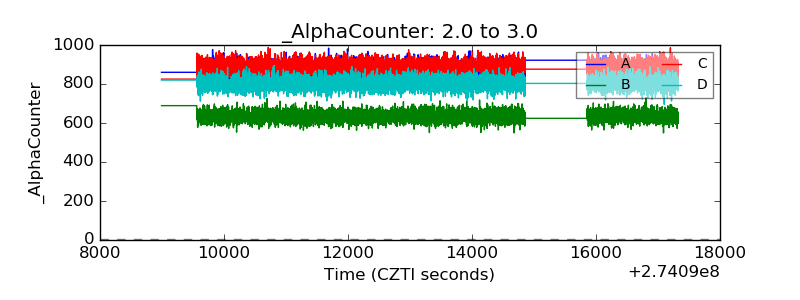 |
| _CPM_Rate | 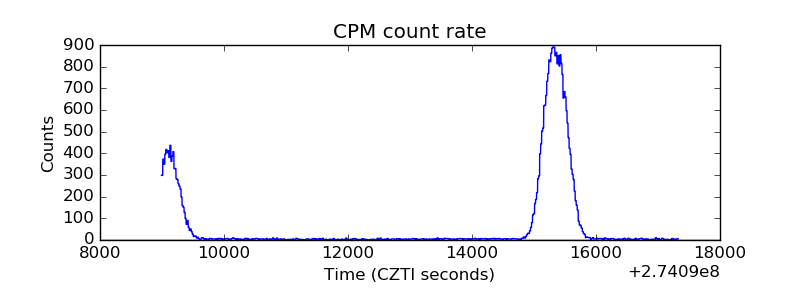 |
| CZT Counter | 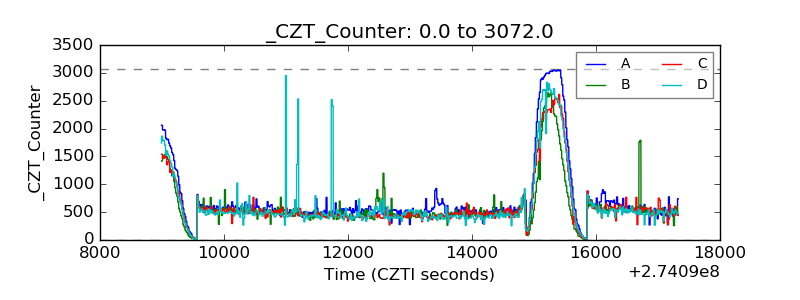 |
| +2.5 Volts monitor |  |
| +5 Volts monitor | 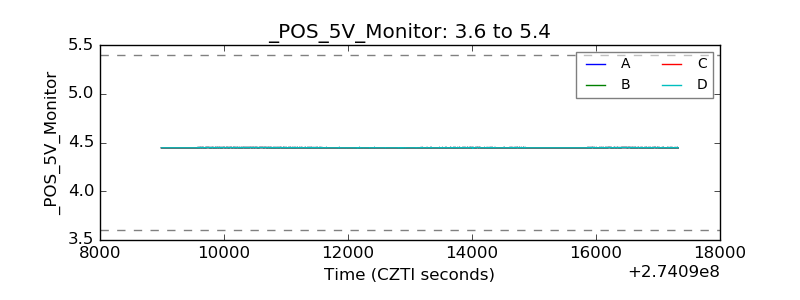 |
| _ROLL_ROT | 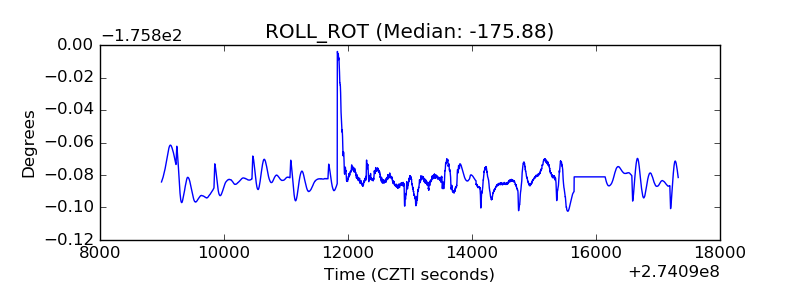 |
| _Roll_DEC | 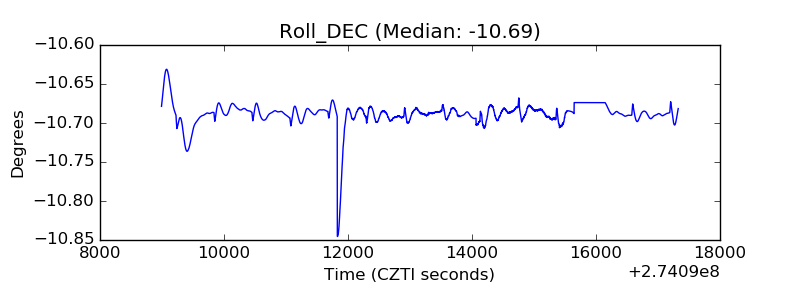 |
| _Roll_RA | 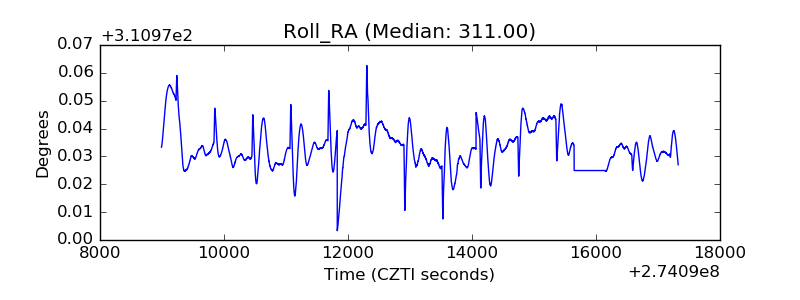 |
| Veto Counter | 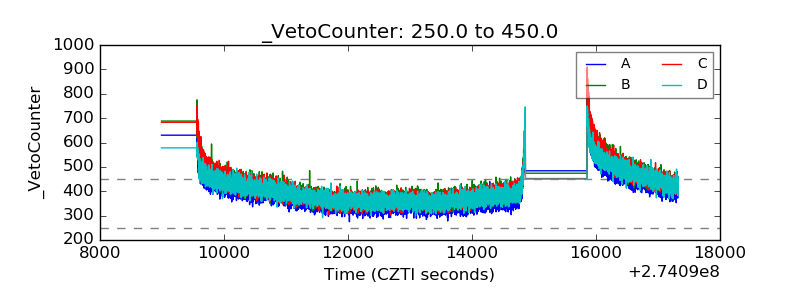 |