| Param | Original file | Final file |
|---|---|---|
| Filename | modeM0/AS1A04_104T03_9000002348_15934cztM0_level2.evt | modeM0/AS1A04_104T03_9000002348_15934cztM0_level2_quad_clean.evt |
| Size (bytes) | 462,994,560 | 109,880,640 |
| Size | 441.5 MB | 104.8 MB |
| Events in quadrant A | 3,290,010 | 740,754 |
| Events in quadrant B | 3,424,973 | 745,202 |
| Events in quadrant C | 3,316,012 | 701,069 |
| Events in quadrant D | 3,554,824 | 693,049 |
| Mode SS | |||
|---|---|---|---|
| Quadrant | BADHDUFLAG | Total packets | Discarded packets |
| A | 0 | 130 | 0 |
| B | 0 | 130 | 0 |
| C | 0 | 130 | 0 |
| D | 0 | 130 | 0 |
| Mode M9 | |||
|---|---|---|---|
| Quadrant | BADHDUFLAG | Total packets | Discarded packets |
| A | 0 | 21 | 0 |
| B | 0 | 21 | 0 |
| C | 0 | 21 | 0 |
| D | 0 | 22 | 0 |
| Mode M0 | |||
|---|---|---|---|
| Quadrant | BADHDUFLAG | Total packets | Discarded packets |
| A | 0 | 14065 | 3 |
| B | 0 | 14341 | 2 |
| C | 0 | 14064 | 2 |
| D | 0 | 14858 | 2 |
| Quadrant | Total seconds | Saturated seconds | Saturation percentage |
|---|---|---|---|
| A | 6421 | 56 | 0.872138% |
| B | 6421 | 58 | 0.903286% |
| C | 6421 | 84 | 1.308207% |
| D | 6421 | 101 | 1.572964% |
Noise dominated data is calculated using 1-second bins in cleaned event files. If a bin has >2000 counts, and if more than 50% of those come from <1% of pixels, then it is considered to be noise-dominated and hence unusable.
| Quadrant | # 1 sec bins | Bins with >0 counts | Bins with >2000 counts | High rate bins dominated by noise | Noise dominated (total time) | Noise dominated (detector-on time) | Marked lightcurve |
|---|---|---|---|---|---|---|---|
| A | 7682 | 6422 | 1 | 1 | 0.01% | 0.02% | 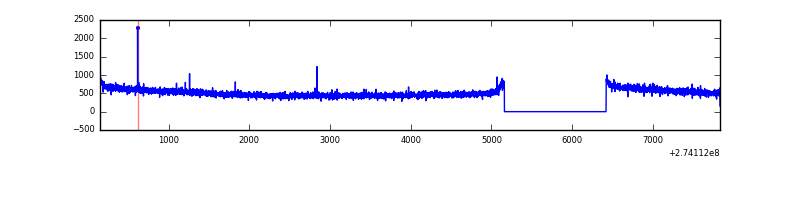 |
| B | 7682 | 6423 | 0 | 0 | 0.00% | 0.00% | 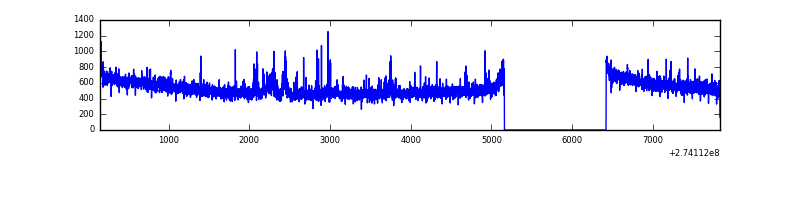 |
| C | 7682 | 6422 | 0 | 0 | 0.00% | 0.00% | 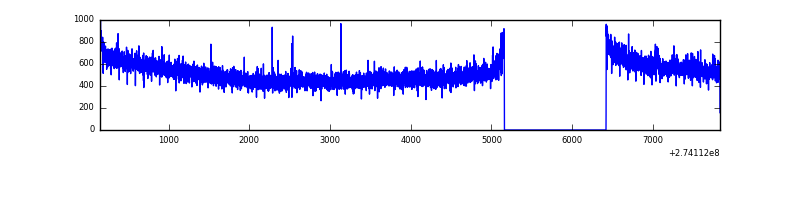 |
| D | 7682 | 6423 | 50 | 50 | 0.65% | 0.78% | 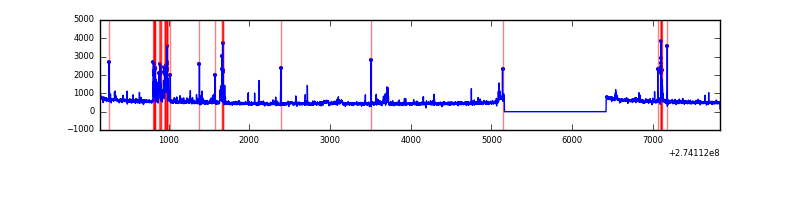 |
Top three noisy pixels from each quadrant. If the there are fewer than three noisy pixels in the level2.evt file, extra rows are filled as -1
| Pixel properties | Quadrant properties | ||||||
|---|---|---|---|---|---|---|---|
| Quadrant | DetID | PixID | Counts | Sigma | Mean | Median | Sigma |
| A | 0 | 226 | 7532 | 38.92 | 854 | 838 | 172.0 |
| A | 15 | 239 | 6470 | 32.75 | 854 | 838 | 172.0 |
| A | 12 | 194 | 6449 | 32.62 | 854 | 838 | 172.0 |
| B | 4 | 216 | 39454 | 241.25 | 843 | 825 | 160.1 |
| B | 0 | 189 | 28206 | 171.0 | 843 | 825 | 160.1 |
| B | 3 | 209 | 24020 | 144.86 | 843 | 825 | 160.1 |
| C | 14 | 238 | 125313 | 675.05 | 798 | 806 | 184.4 |
| C | 3 | 233 | 72468 | 388.54 | 798 | 806 | 184.4 |
| C | 13 | 61 | 5761 | 26.87 | 798 | 806 | 184.4 |
| D | 13 | 104 | 240904 | 1230.44 | 819 | 795 | 195.1 |
| D | 1 | 52 | 47778 | 240.76 | 819 | 795 | 195.1 |
| D | 15 | 0 | 40039 | 201.1 | 819 | 795 | 195.1 |
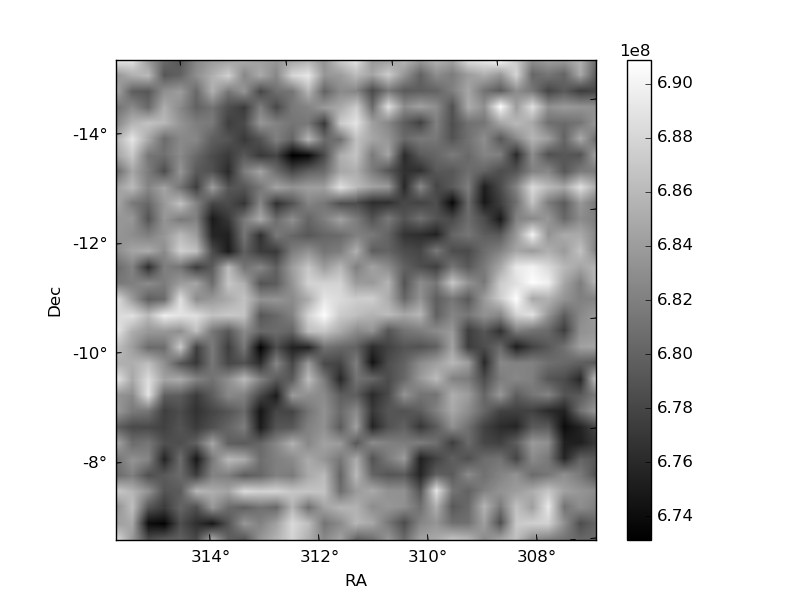
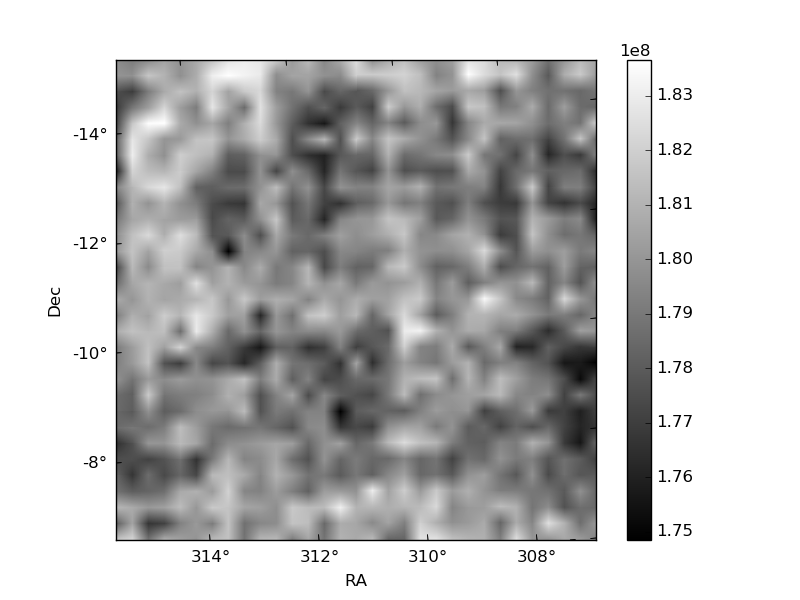
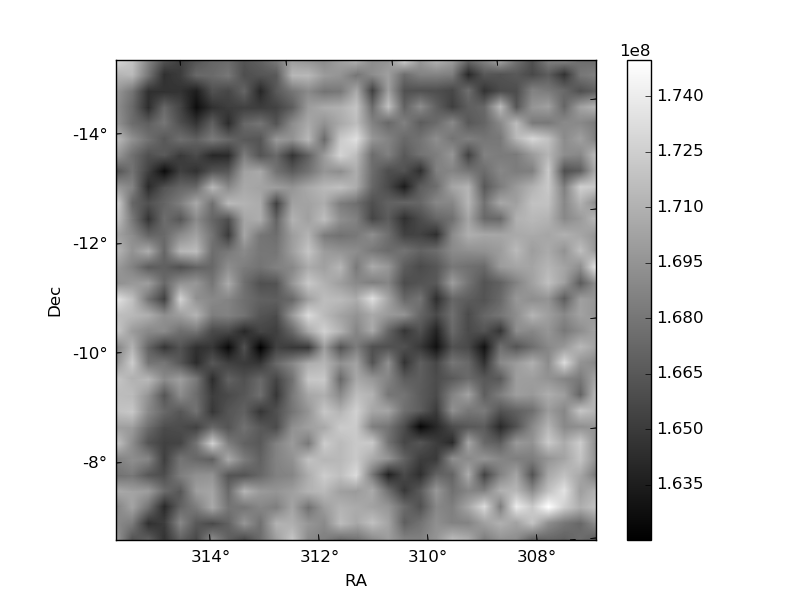
Histogram calculated using DETX and DETY for each event in the final _common_clean file
| Quadrant A | 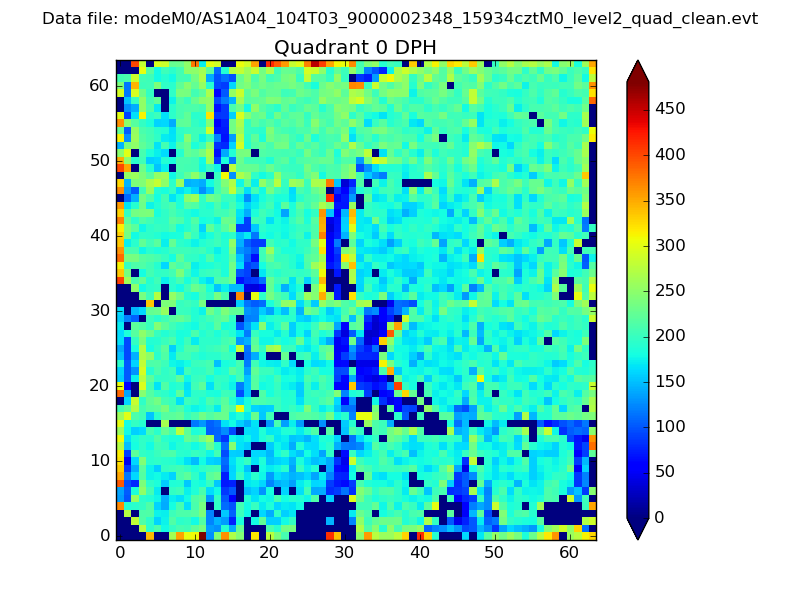 |
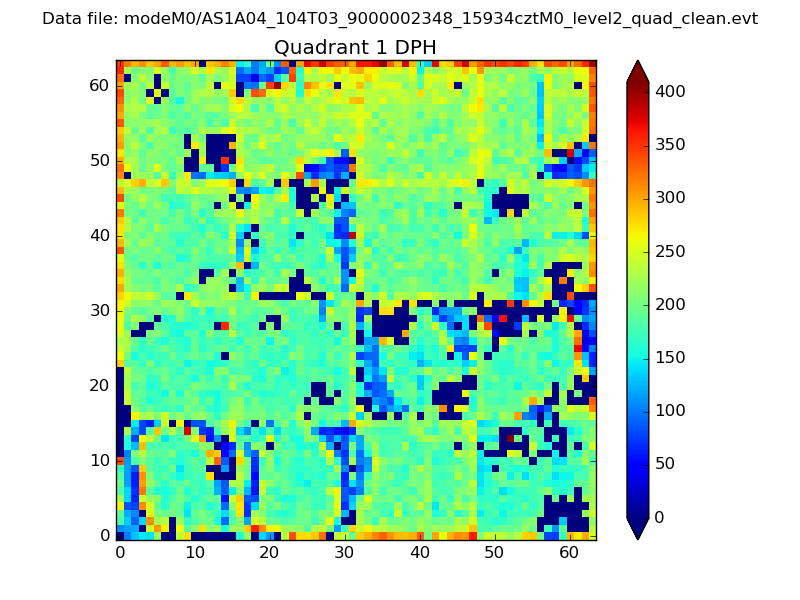 |
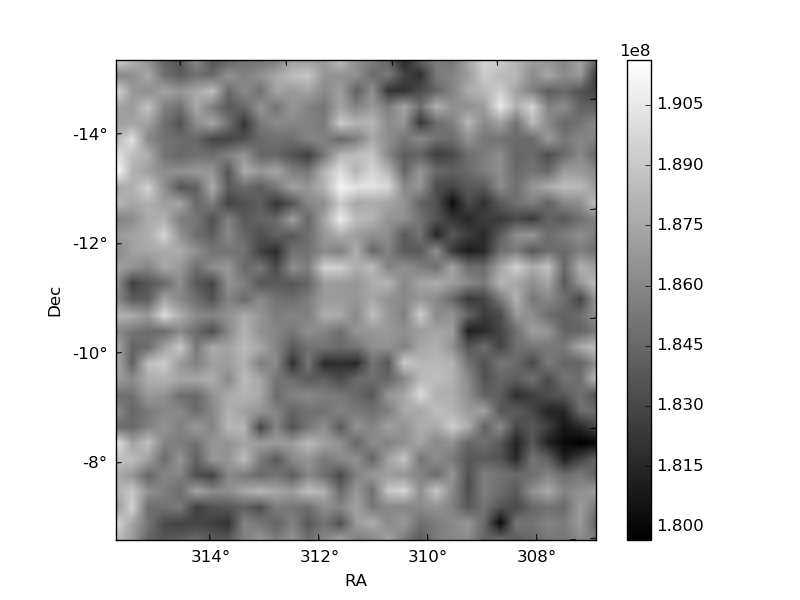
Quadrant B |
|---|---|---|---|
| Quadrant D | 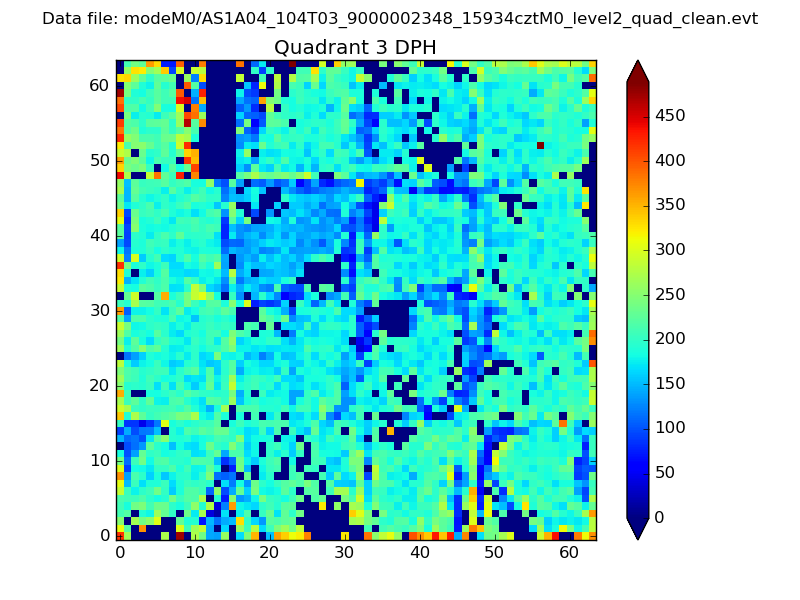 |
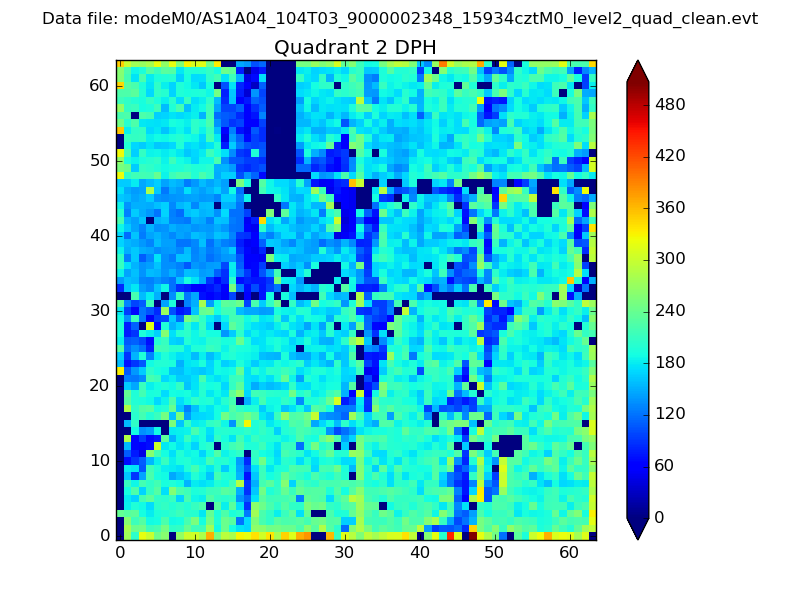 |
Quadrant C |
| Plot type | Count rate plots | Images |
|---|---|---|
| Comparison with Poisson distribution Blue bars denote a histogram of data divided into 1 sec bins. Red curve is a Poisson curve with rate = median count rate of data. |
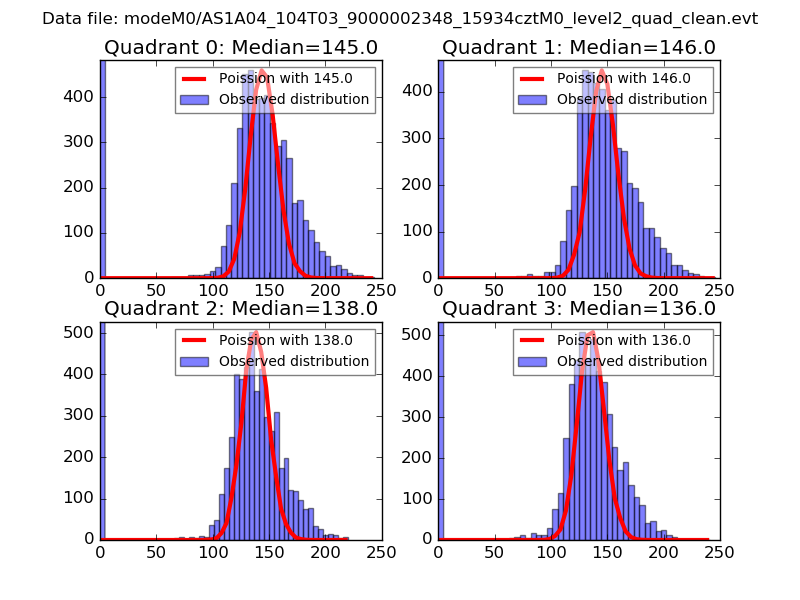 |
 |
| Quadrant-wise count rates Data is divided into 100 sec bins |
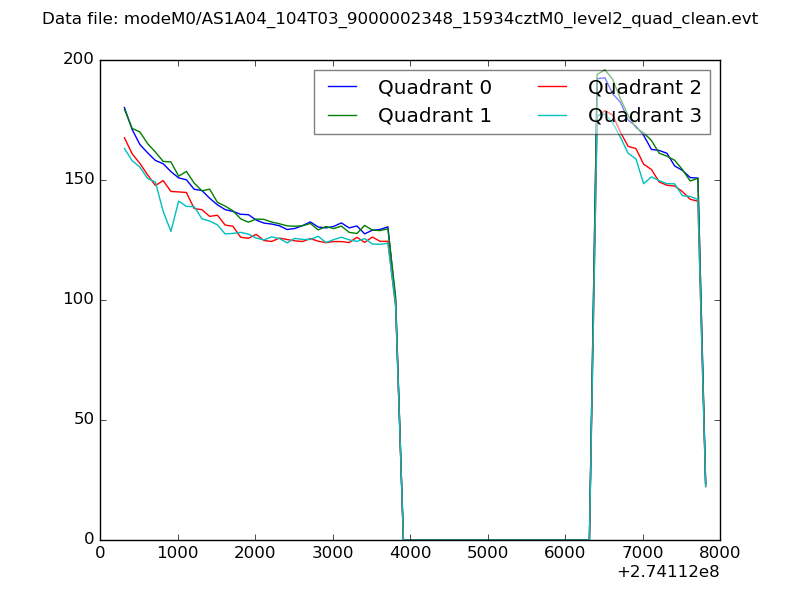 |
|
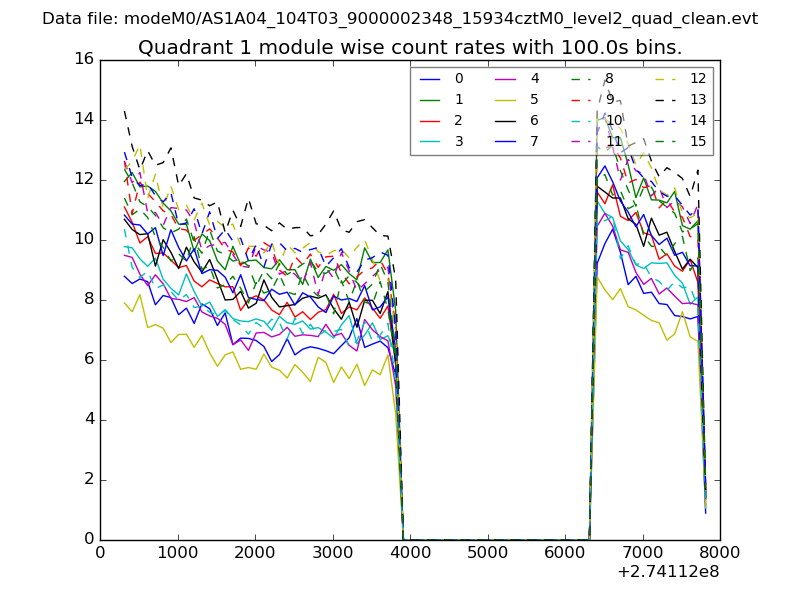
| Module-wise count rates for Quadrant A Data is divided into 100 sec bins |
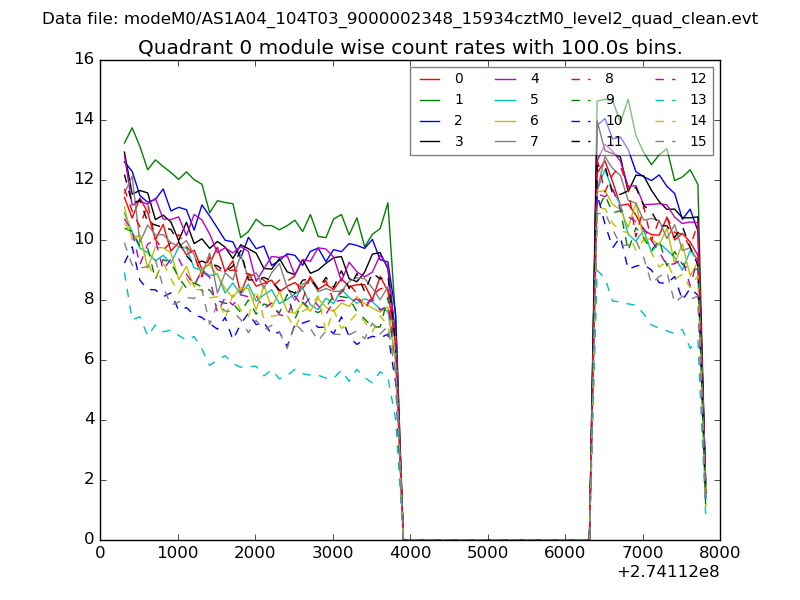 |
 |
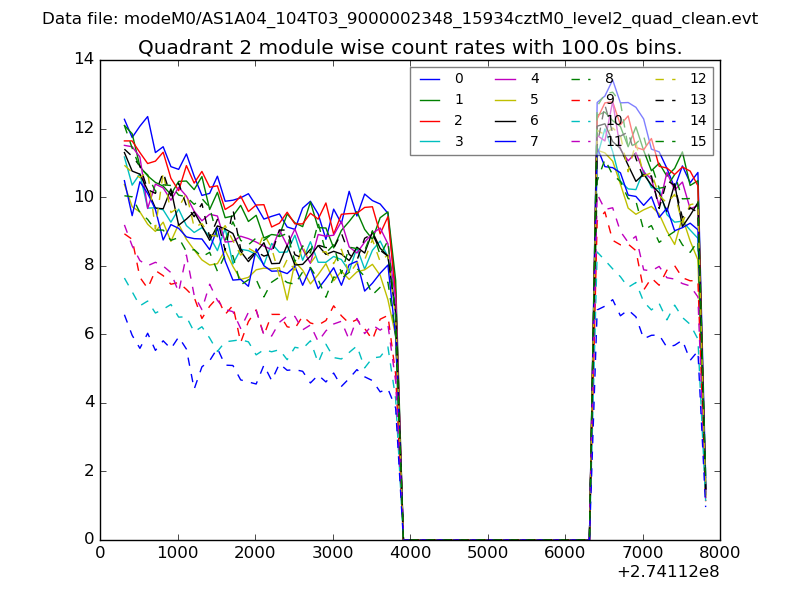
| Module-wise count rates for Quadrant B Data is divided into 100 sec bins |
 |
 |
| Module-wise count rates for Quadrant C Data is divided into 100 sec bins |
 |
 |
| Module-wise count rates for Quadrant D Data is divided into 100 sec bins |
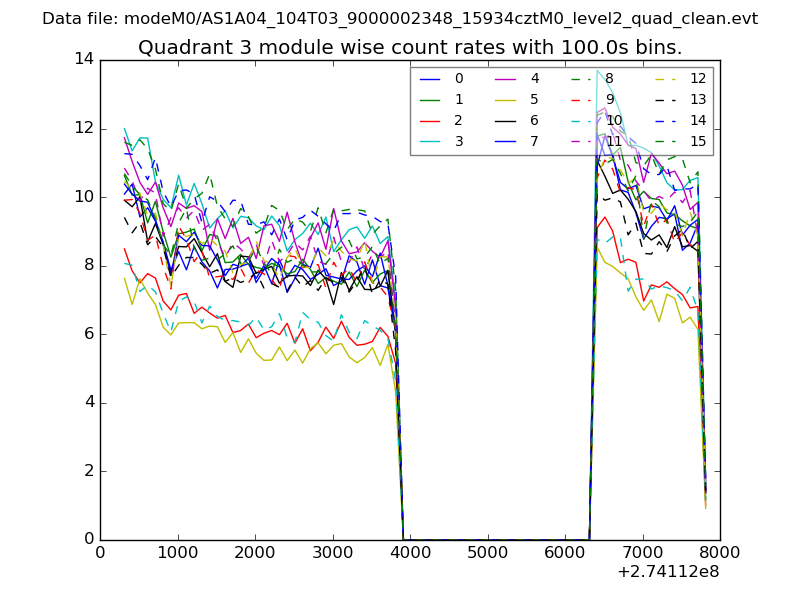 |
 |
| Parameter | Plot |
|---|---|
| CZT HV Monitor | 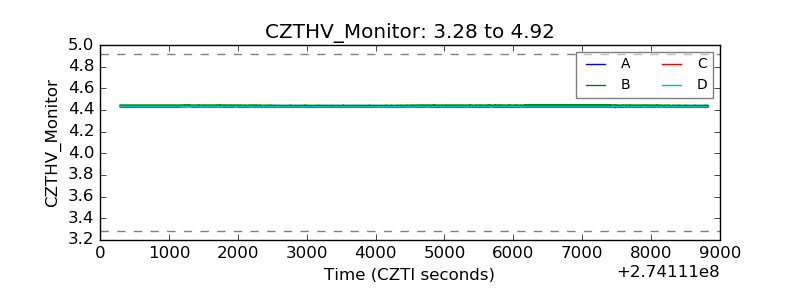 |
| D_VDD | 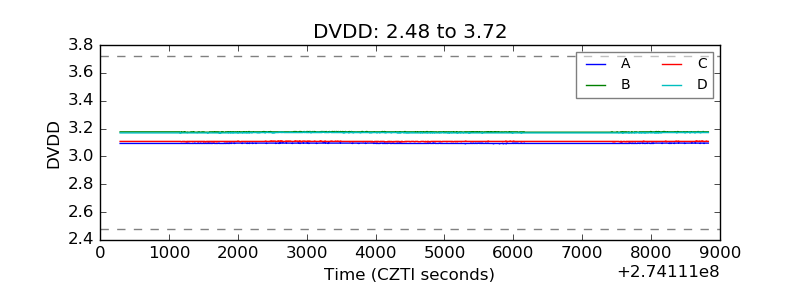 |
| Temperature 1 |  |
| Veto HV Monitor | 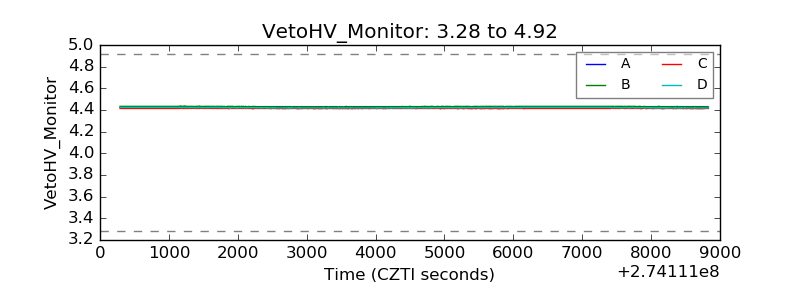 |
| Veto LLD | 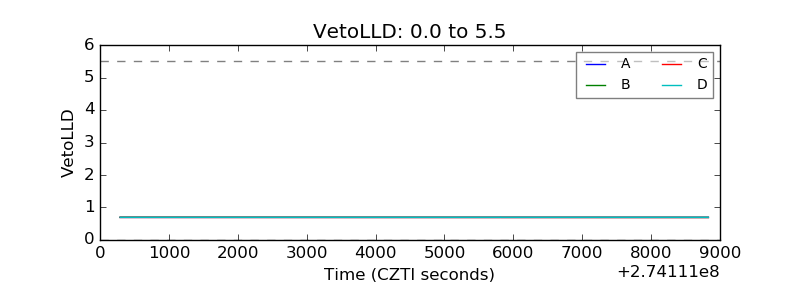 |
| Alpha Counter | 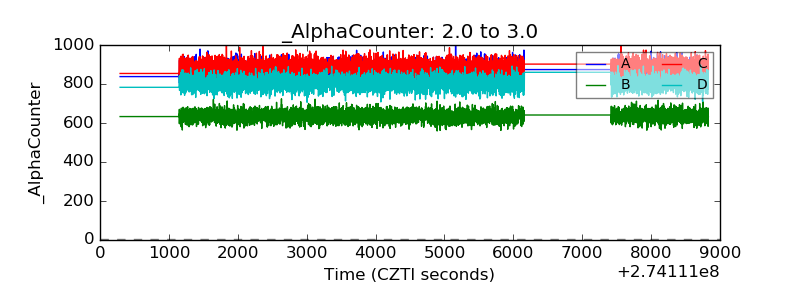 |
| _CPM_Rate | 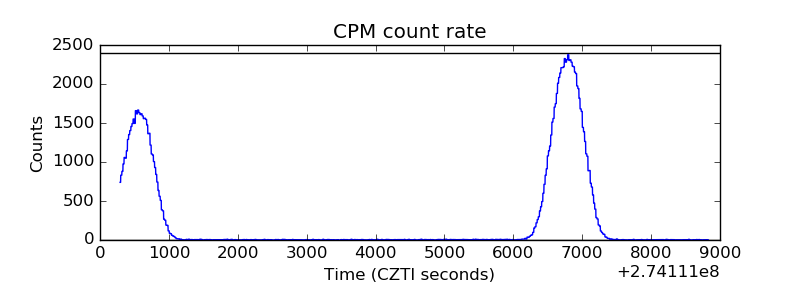 |
| CZT Counter | 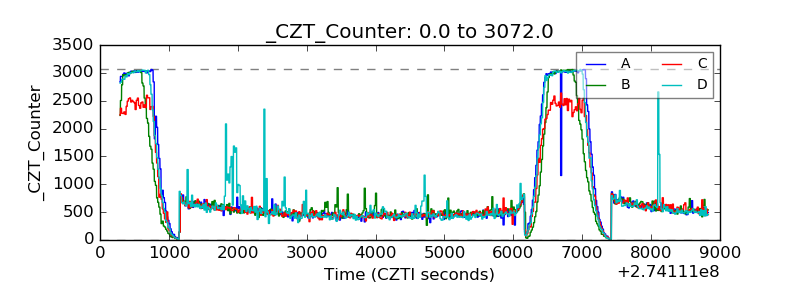 |
| +2.5 Volts monitor |  |
| +5 Volts monitor |  |
| _ROLL_ROT |  |
| _Roll_DEC | 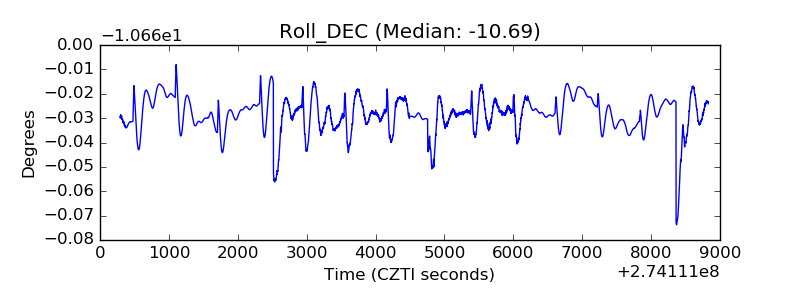 |
| _Roll_RA | 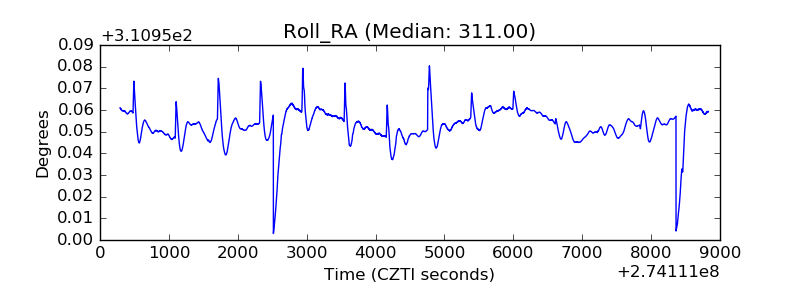 |
| Veto Counter | 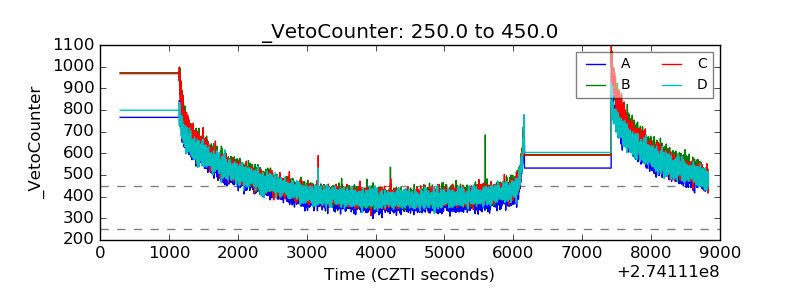 |