| Param | Original file | Final file |
|---|---|---|
| Filename | modeM0/AS1A04_104T03_9000002348_15937cztM0_level2.evt | modeM0/AS1A04_104T03_9000002348_15937cztM0_level2_quad_clean.evt |
| Size (bytes) | 440,262,720 | 89,749,440 |
| Size | 419.9 MB | 85.6 MB |
| Events in quadrant A | 3,169,970 | 581,003 |
| Events in quadrant B | 3,444,499 | 591,999 |
| Events in quadrant C | 3,255,083 | 559,860 |
| Events in quadrant D | 3,040,301 | 550,246 |
| Mode SS | |||
|---|---|---|---|
| Quadrant | BADHDUFLAG | Total packets | Discarded packets |
| A | 0 | 126 | 0 |
| B | 0 | 126 | 0 |
| C | 0 | 126 | 0 |
| D | 0 | 126 | 0 |
| Mode M9 | |||
|---|---|---|---|
| Quadrant | BADHDUFLAG | Total packets | Discarded packets |
| A | 0 | 16 | 0 |
| B | 0 | 16 | 0 |
| C | 0 | 16 | 0 |
| D | 0 | 17 | 0 |
| Mode M0 | |||
|---|---|---|---|
| Quadrant | BADHDUFLAG | Total packets | Discarded packets |
| A | 0 | 13398 | 3 |
| B | 0 | 14224 | 2 |
| C | 0 | 13460 | 2 |
| D | 0 | 13244 | 2 |
| Quadrant | Total seconds | Saturated seconds | Saturation percentage |
|---|---|---|---|
| A | 6232 | 121 | 1.941592% |
| B | 6232 | 141 | 2.262516% |
| C | 6232 | 150 | 2.406932% |
| D | 6232 | 87 | 1.396021% |
Noise dominated data is calculated using 1-second bins in cleaned event files. If a bin has >2000 counts, and if more than 50% of those come from <1% of pixels, then it is considered to be noise-dominated and hence unusable.
| Quadrant | # 1 sec bins | Bins with >0 counts | Bins with >2000 counts | High rate bins dominated by noise | Noise dominated (total time) | Noise dominated (detector-on time) | Marked lightcurve |
|---|---|---|---|---|---|---|---|
| A | 7498 | 6233 | 3 | 3 | 0.04% | 0.05% | 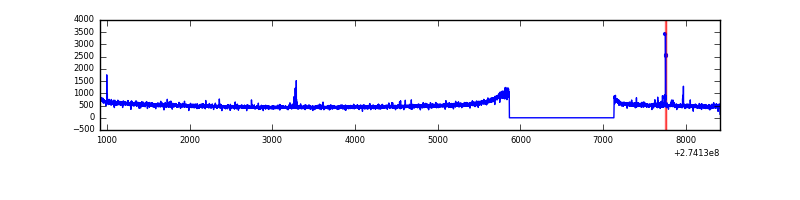 |
| B | 7498 | 6233 | 2 | 2 | 0.03% | 0.03% | 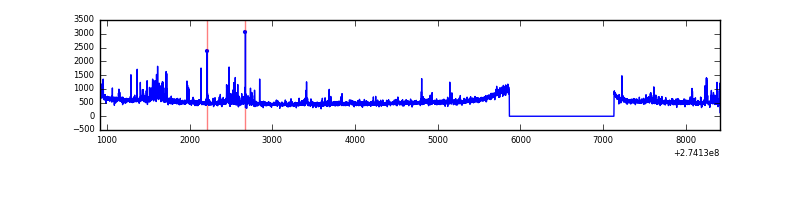 |
| C | 7498 | 6234 | 0 | 0 | 0.00% | 0.00% | 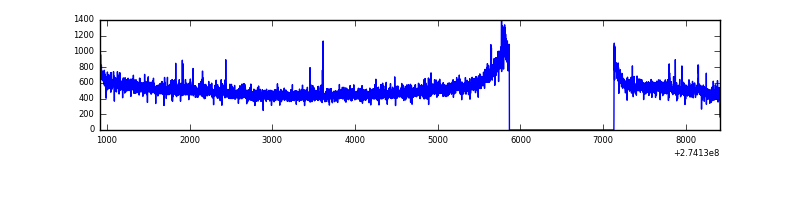 |
| D | 7498 | 6234 | 3 | 3 | 0.04% | 0.05% | 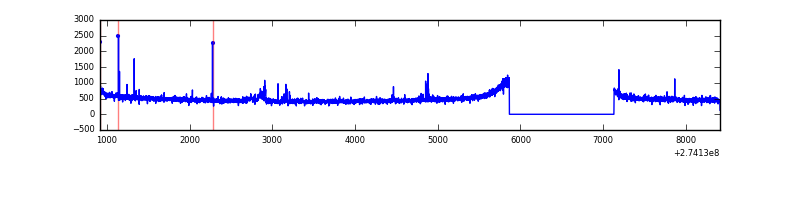 |
Top three noisy pixels from each quadrant. If the there are fewer than three noisy pixels in the level2.evt file, extra rows are filled as -1
| Pixel properties | Quadrant properties | ||||||
|---|---|---|---|---|---|---|---|
| Quadrant | DetID | PixID | Counts | Sigma | Mean | Median | Sigma |
| A | 15 | 239 | 38867 | 231.42 | 813 | 797 | 164.5 |
| A | 0 | 226 | 7250 | 39.23 | 813 | 797 | 164.5 |
| A | 12 | 194 | 6081 | 32.12 | 813 | 797 | 164.5 |
| B | 4 | 142 | 75038 | 481.37 | 815 | 798 | 154.2 |
| B | 0 | 244 | 67716 | 433.89 | 815 | 798 | 154.2 |
| B | 0 | 190 | 28306 | 178.36 | 815 | 798 | 154.2 |
| C | 14 | 238 | 120594 | 668.77 | 770 | 776 | 179.2 |
| C | 3 | 233 | 117322 | 650.51 | 770 | 776 | 179.2 |
| C | 7 | 247 | 14482 | 76.5 | 770 | 776 | 179.2 |
| D | 15 | 0 | 40503 | 206.55 | 783 | 761 | 192.4 |
| D | 2 | 234 | 25842 | 130.35 | 783 | 761 | 192.4 |
| D | 2 | 120 | 17443 | 86.7 | 783 | 761 | 192.4 |
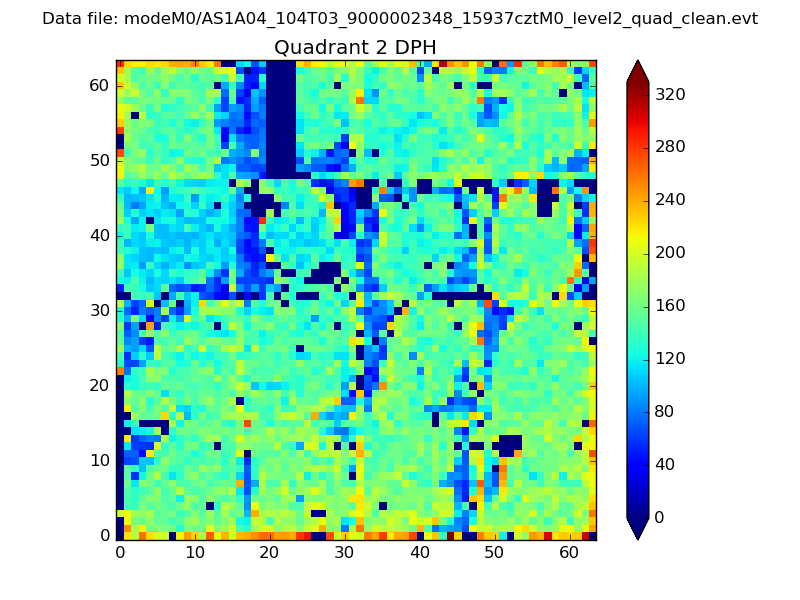
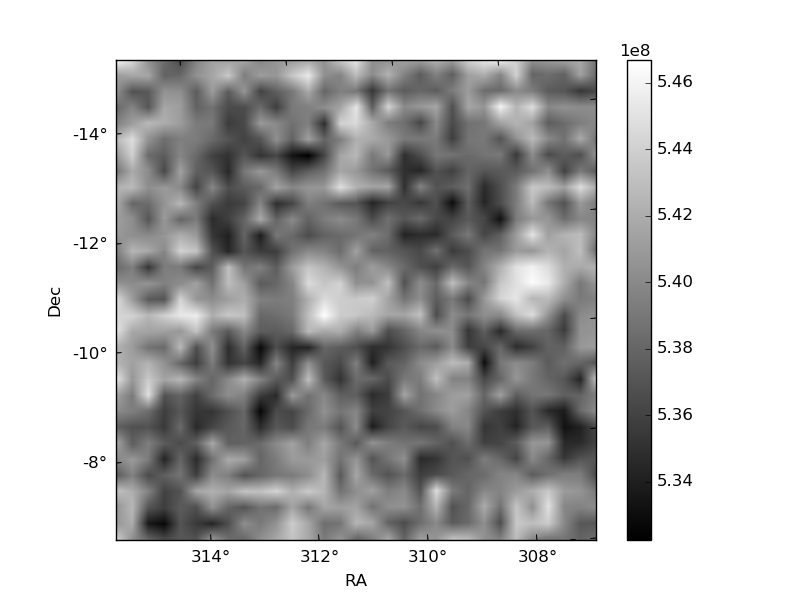
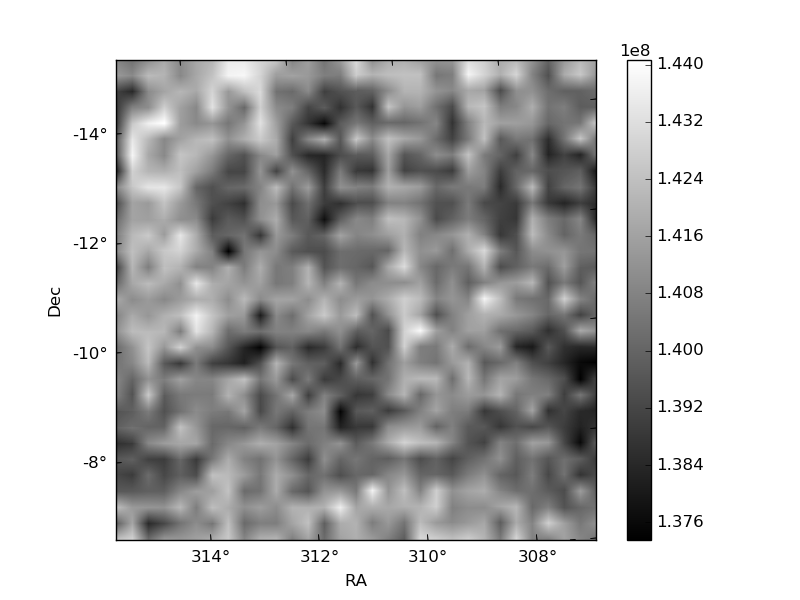
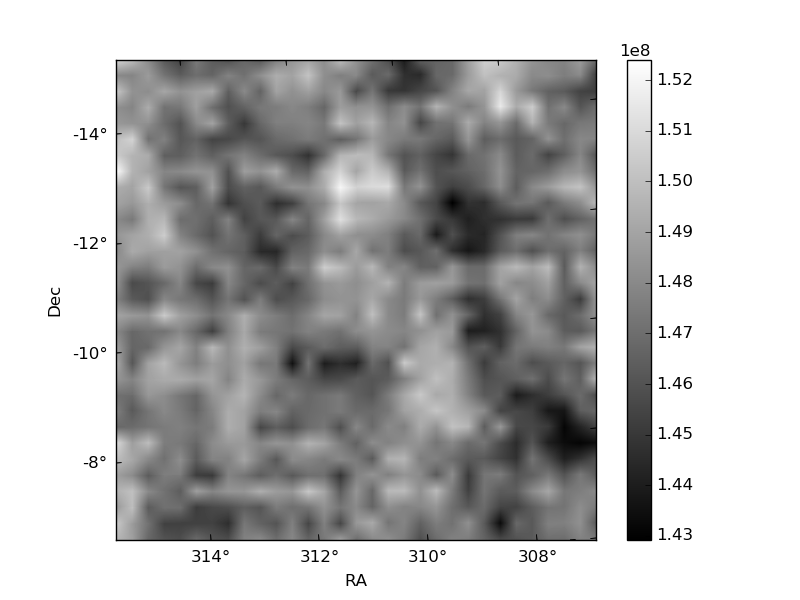
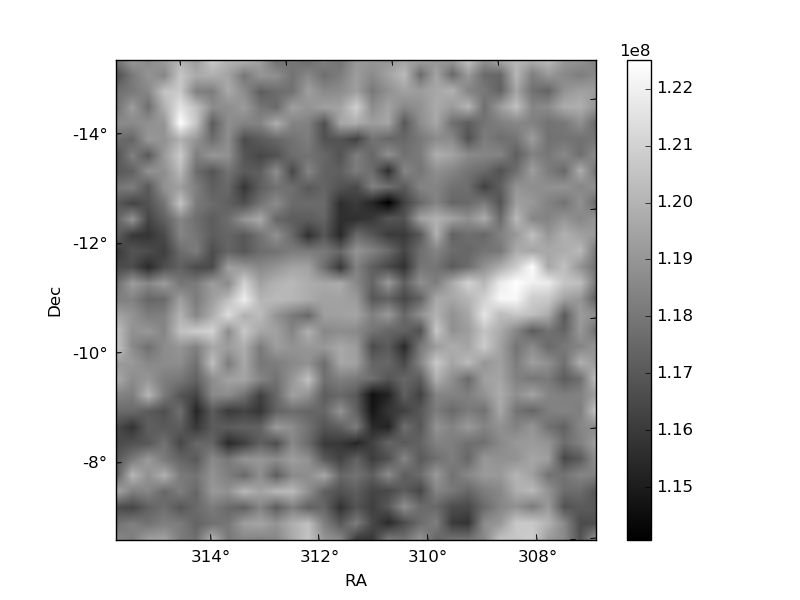
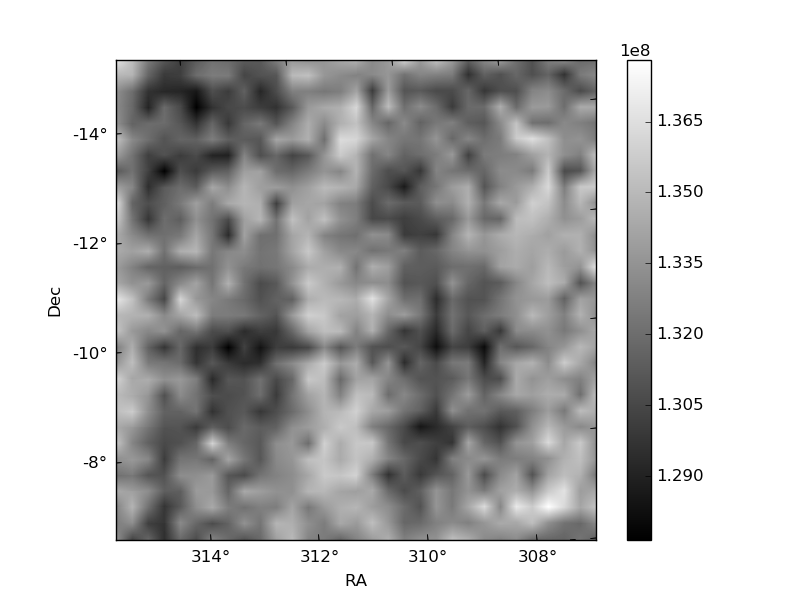
Histogram calculated using DETX and DETY for each event in the final _common_clean file
| Quadrant A | 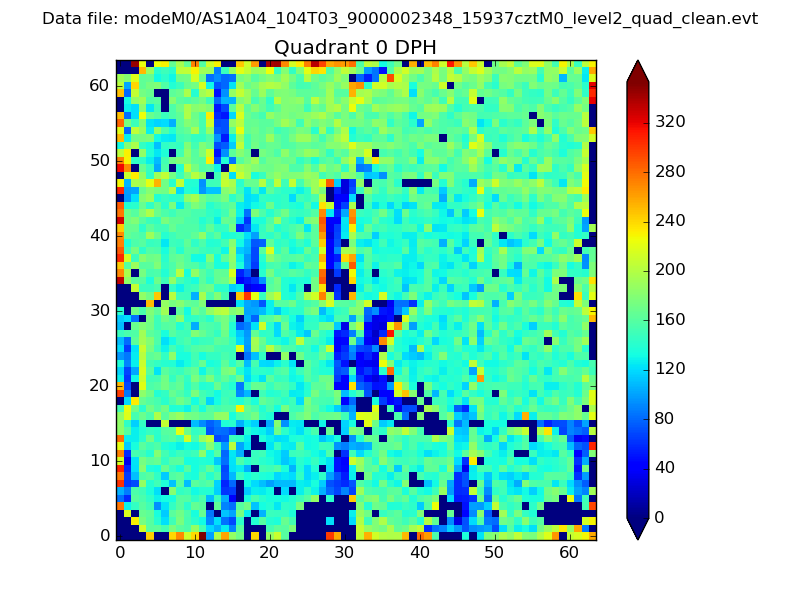 |
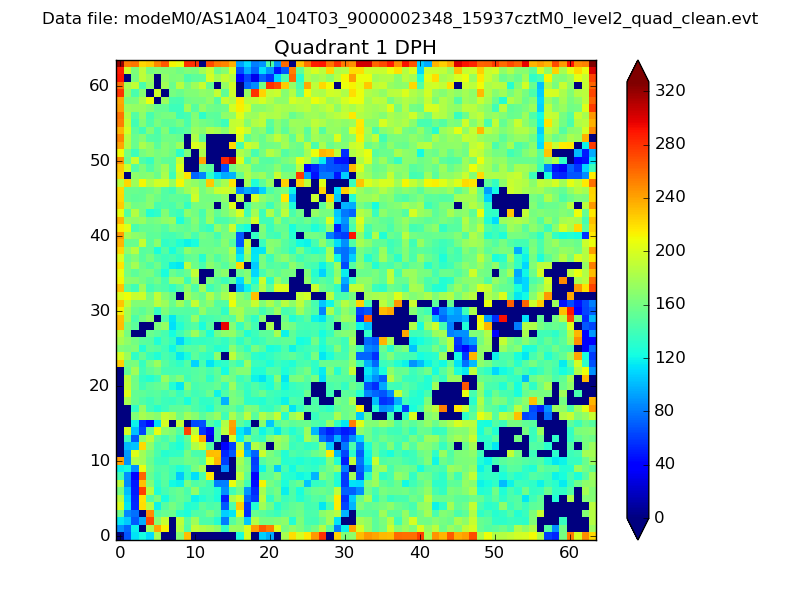 |
Quadrant B |
|---|---|---|---|
| Quadrant D | 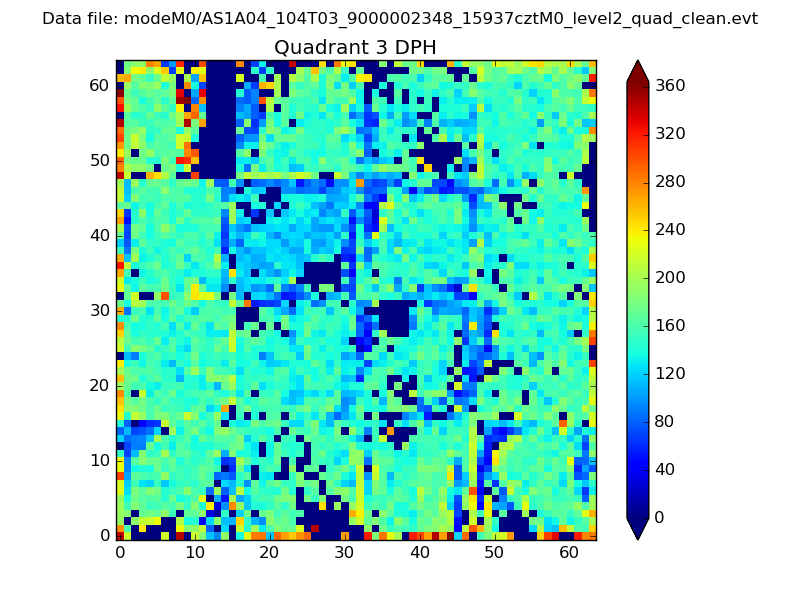 |
 |
Quadrant C |
| Plot type | Count rate plots | Images |
|---|---|---|
| Comparison with Poisson distribution Blue bars denote a histogram of data divided into 1 sec bins. Red curve is a Poisson curve with rate = median count rate of data. |
 |
 |
| Quadrant-wise count rates Data is divided into 100 sec bins |
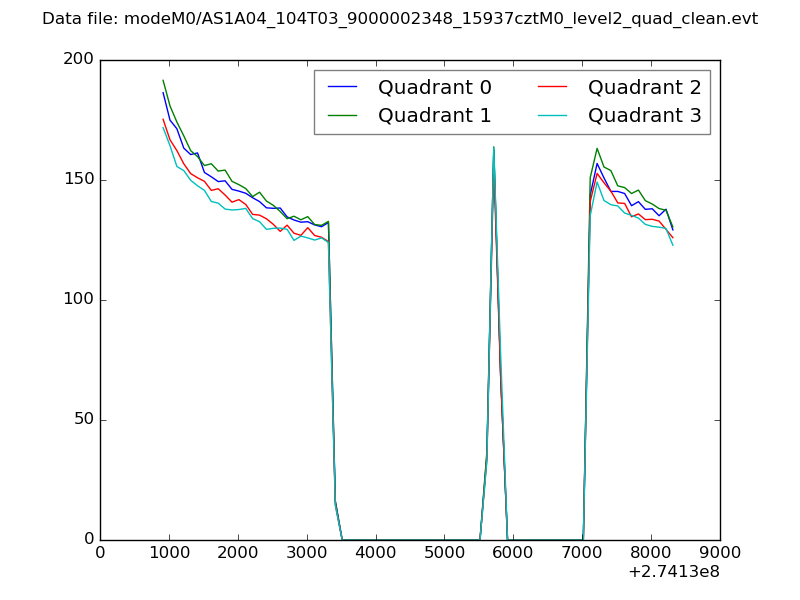 |
|
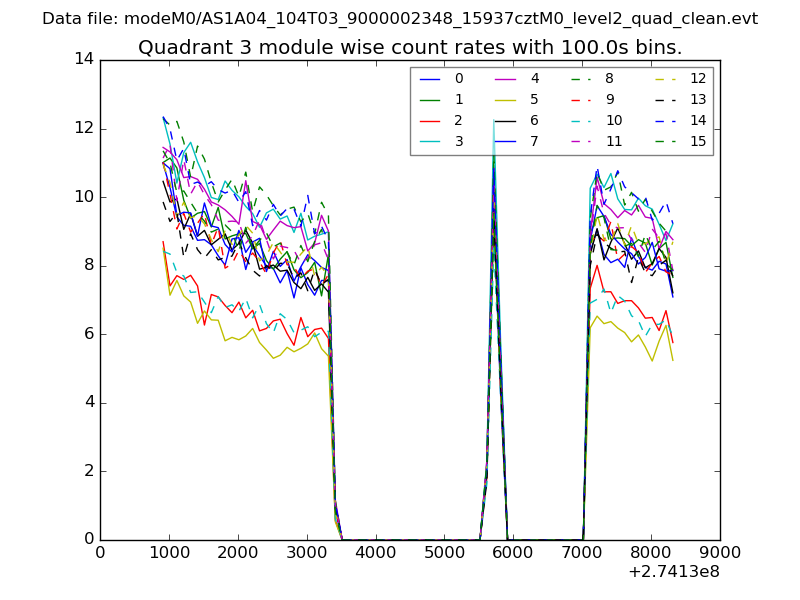
| Module-wise count rates for Quadrant A Data is divided into 100 sec bins |
 |
 |
| Module-wise count rates for Quadrant B Data is divided into 100 sec bins |
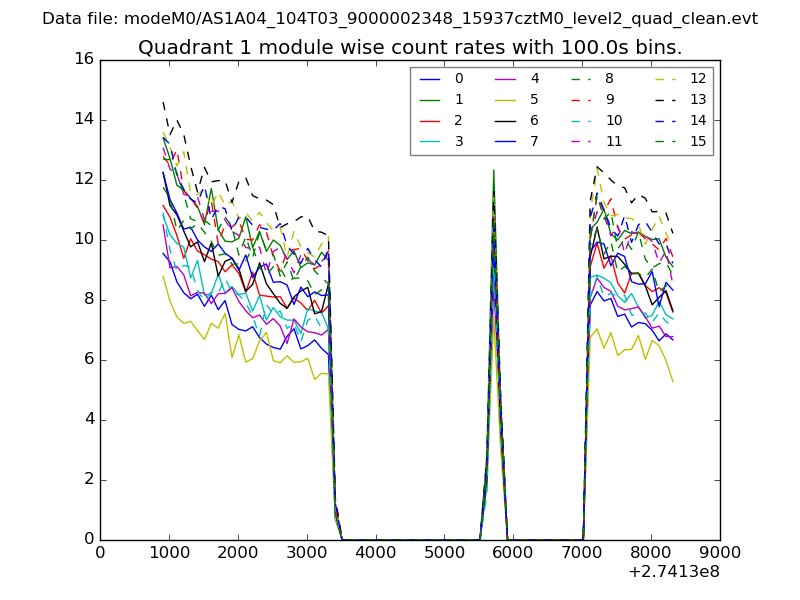 |
 |
| Module-wise count rates for Quadrant C Data is divided into 100 sec bins |
 |
 |
| Module-wise count rates for Quadrant D Data is divided into 100 sec bins |
 |
 |
| Parameter | Plot |
|---|---|
| CZT HV Monitor |  |
| D_VDD | 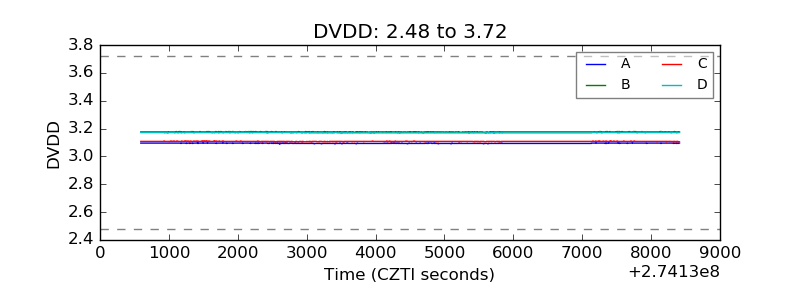 |
| Temperature 1 |  |
| Veto HV Monitor | 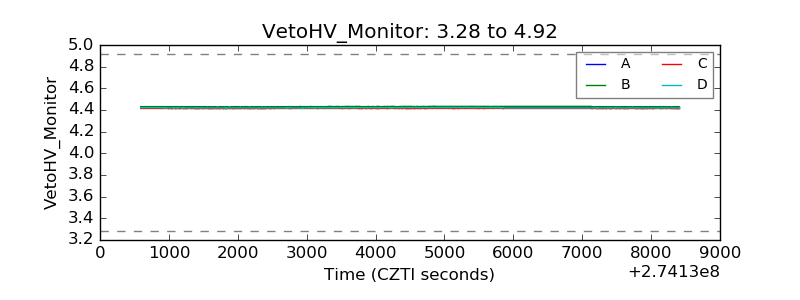 |
| Veto LLD | 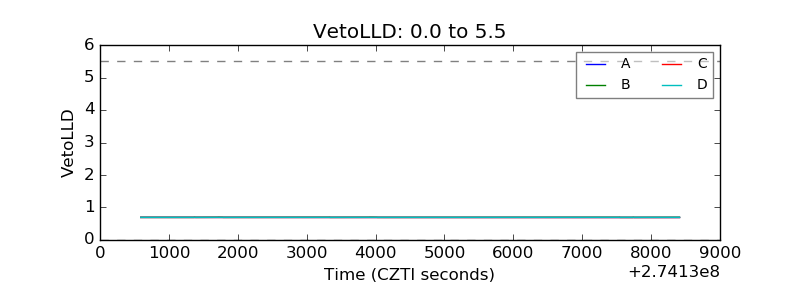 |
| Alpha Counter | 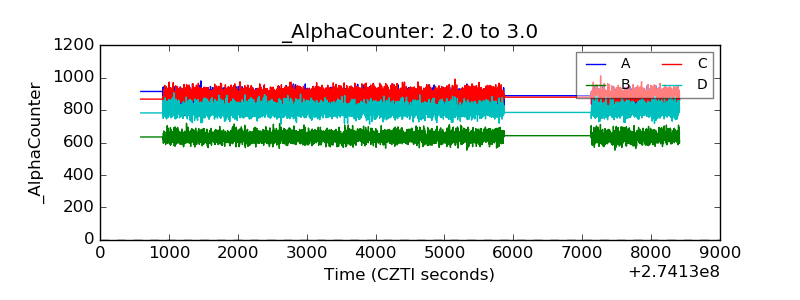 |
| _CPM_Rate | 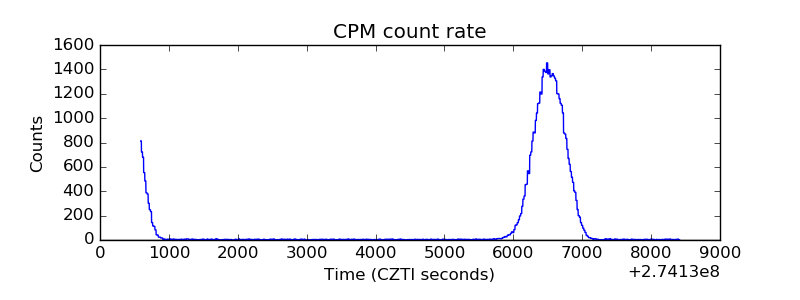 |
| CZT Counter | 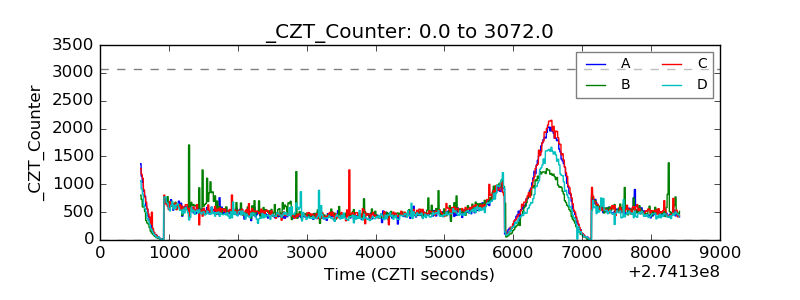 |
| +2.5 Volts monitor |  |
| +5 Volts monitor |  |
| _ROLL_ROT | 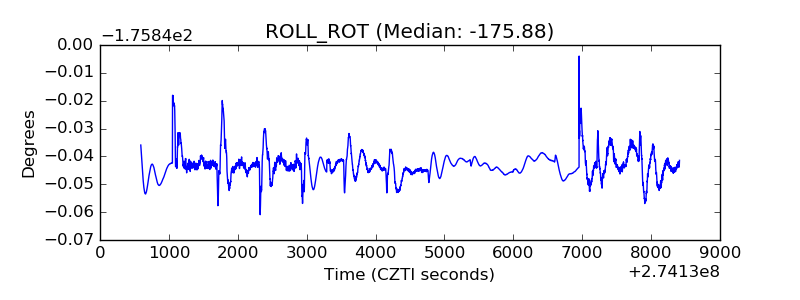 |
| _Roll_DEC | 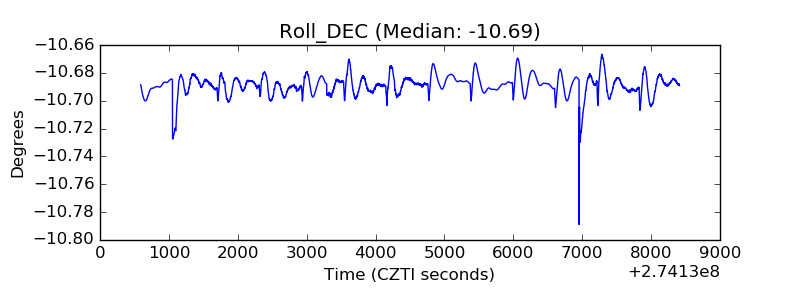 |
| _Roll_RA | 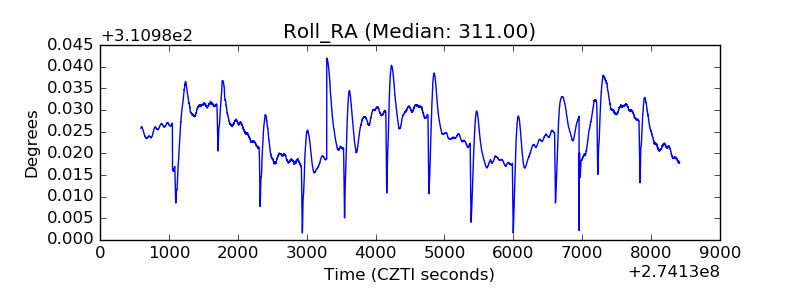 |
| Veto Counter | 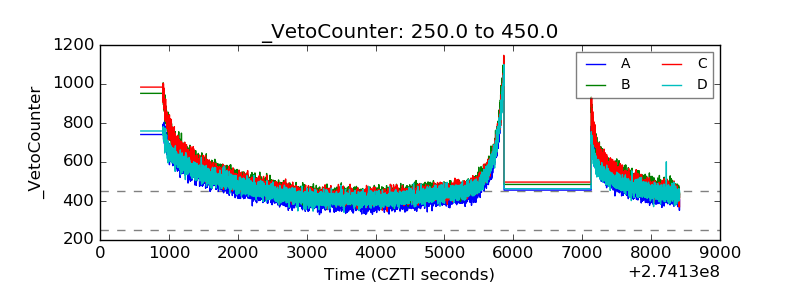 |