| Param | Original file | Final file |
|---|---|---|
| Filename | modeM0/AS1A04_104T03_9000002348_15938cztM0_level2.evt | modeM0/AS1A04_104T03_9000002348_15938cztM0_level2_quad_clean.evt |
| Size (bytes) | 443,986,560 | 90,538,560 |
| Size | 423.4 MB | 86.3 MB |
| Events in quadrant A | 3,169,157 | 578,725 |
| Events in quadrant B | 3,485,494 | 591,528 |
| Events in quadrant C | 3,334,673 | 563,597 |
| Events in quadrant D | 3,015,102 | 554,714 |
| Mode SS | |||
|---|---|---|---|
| Quadrant | BADHDUFLAG | Total packets | Discarded packets |
| A | 0 | 132 | 0 |
| B | 0 | 132 | 0 |
| C | 0 | 132 | 0 |
| D | 0 | 132 | 0 |
| Mode M9 | |||
|---|---|---|---|
| Quadrant | BADHDUFLAG | Total packets | Discarded packets |
| A | 0 | 17 | 0 |
| B | 0 | 17 | 0 |
| C | 0 | 17 | 0 |
| D | 0 | 18 | 0 |
| Mode M0 | |||
|---|---|---|---|
| Quadrant | BADHDUFLAG | Total packets | Discarded packets |
| A | 0 | 13712 | 3 |
| B | 0 | 14483 | 2 |
| C | 0 | 14001 | 2 |
| D | 0 | 13513 | 2 |
| Quadrant | Total seconds | Saturated seconds | Saturation percentage |
|---|---|---|---|
| A | 6499 | 54 | 0.830897% |
| B | 6499 | 75 | 1.154024% |
| C | 6499 | 73 | 1.123250% |
| D | 6499 | 14 | 0.215418% |
Noise dominated data is calculated using 1-second bins in cleaned event files. If a bin has >2000 counts, and if more than 50% of those come from <1% of pixels, then it is considered to be noise-dominated and hence unusable.
| Quadrant | # 1 sec bins | Bins with >0 counts | Bins with >2000 counts | High rate bins dominated by noise | Noise dominated (total time) | Noise dominated (detector-on time) | Marked lightcurve |
|---|---|---|---|---|---|---|---|
| A | 7630 | 6501 | 5 | 5 | 0.07% | 0.08% | 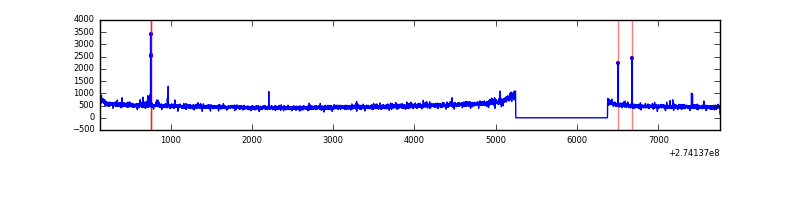 |
| B | 7630 | 6501 | 6 | 6 | 0.08% | 0.09% | 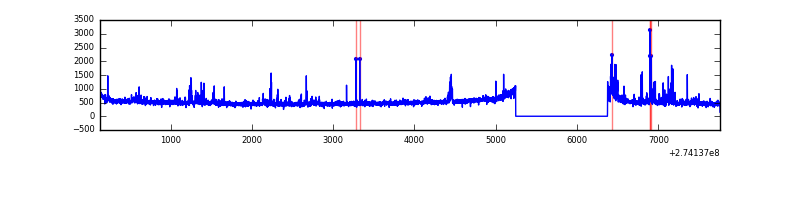 |
| C | 7630 | 6501 | 0 | 0 | 0.00% | 0.00% | 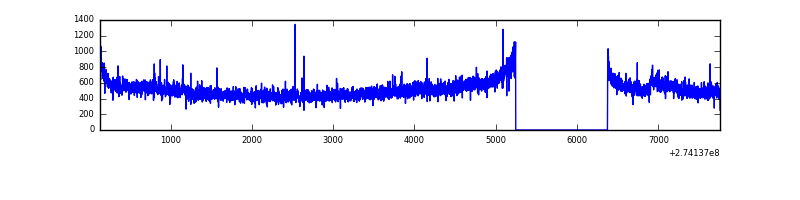 |
| D | 7630 | 6501 | 4 | 4 | 0.05% | 0.06% | 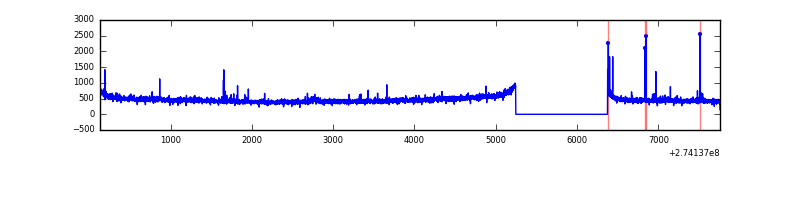 |
Top three noisy pixels from each quadrant. If the there are fewer than three noisy pixels in the level2.evt file, extra rows are filled as -1
| Pixel properties | Quadrant properties | ||||||
|---|---|---|---|---|---|---|---|
| Quadrant | DetID | PixID | Counts | Sigma | Mean | Median | Sigma |
| A | 15 | 239 | 35015 | 209.03 | 807 | 790 | 163.7 |
| A | 13 | 34 | 23760 | 140.29 | 807 | 790 | 163.7 |
| A | 0 | 226 | 7186 | 39.06 | 807 | 790 | 163.7 |
| B | 0 | 244 | 88522 | 565.26 | 813 | 793 | 155.2 |
| B | 4 | 173 | 49692 | 315.07 | 813 | 793 | 155.2 |
| B | 4 | 142 | 42089 | 266.08 | 813 | 793 | 155.2 |
| C | 3 | 233 | 198174 | 1096.32 | 771 | 776 | 180.1 |
| C | 14 | 238 | 122118 | 673.91 | 771 | 776 | 180.1 |
| C | 7 | 247 | 6920 | 34.12 | 771 | 776 | 180.1 |
| D | 15 | 0 | 42033 | 215.34 | 778 | 758 | 191.7 |
| D | 2 | 234 | 28638 | 145.46 | 778 | 758 | 191.7 |
| D | 2 | 120 | 9588 | 46.07 | 778 | 758 | 191.7 |
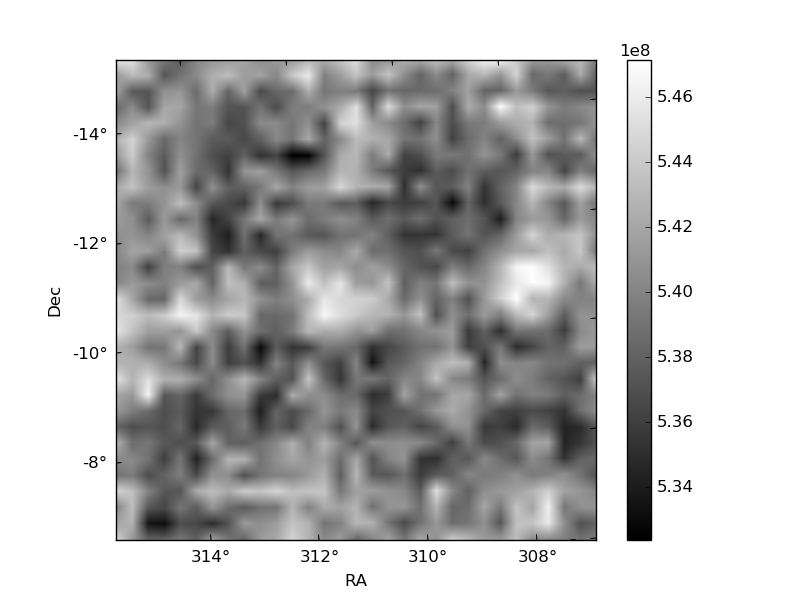
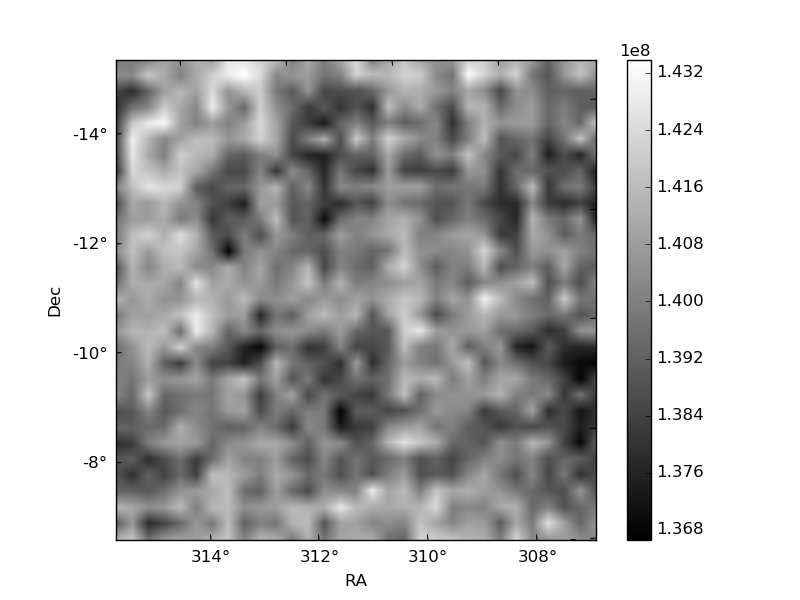
Histogram calculated using DETX and DETY for each event in the final _common_clean file
| Quadrant A | 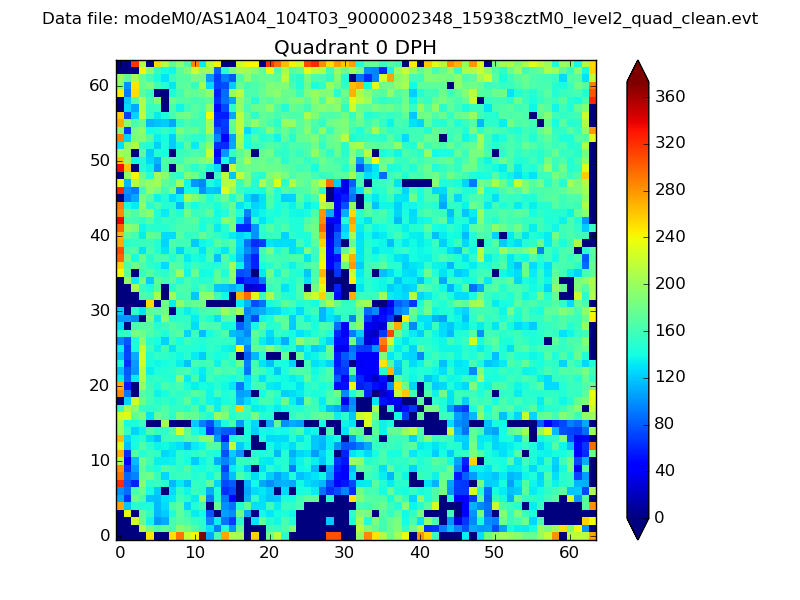 |
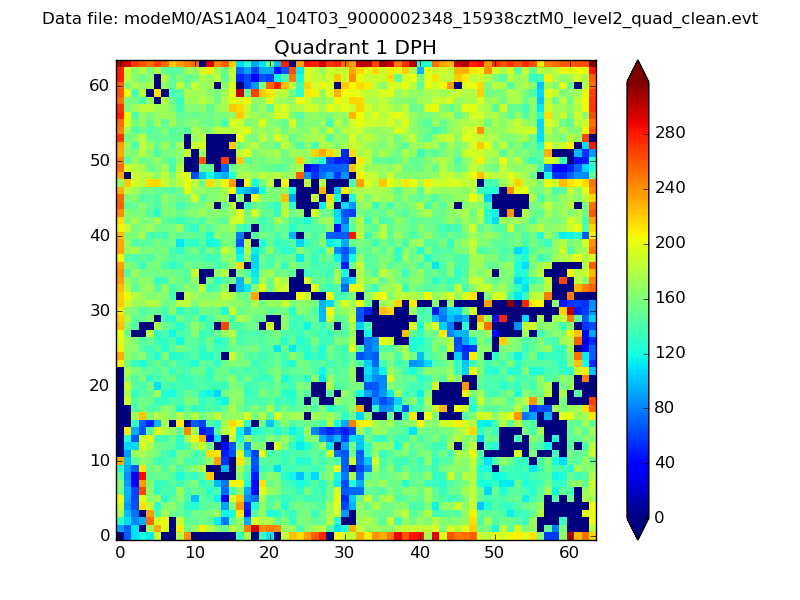 |
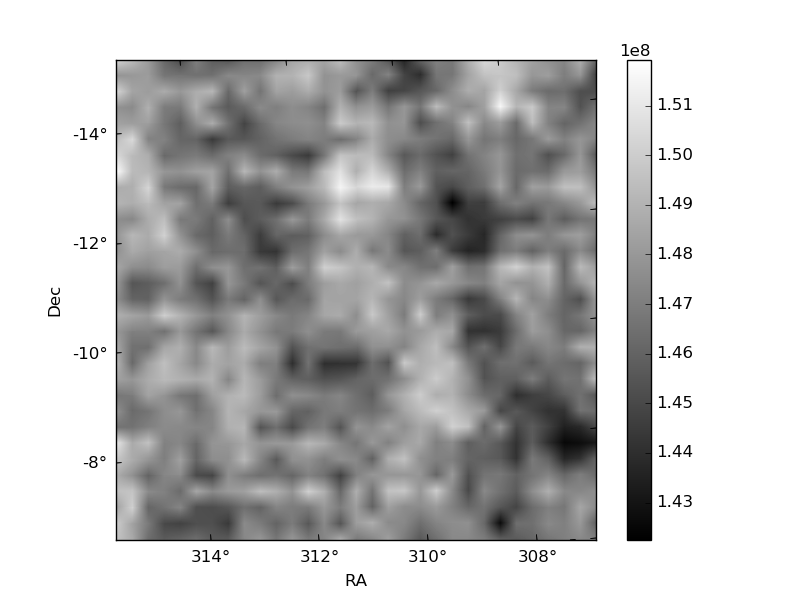
Quadrant B |
|---|---|---|---|
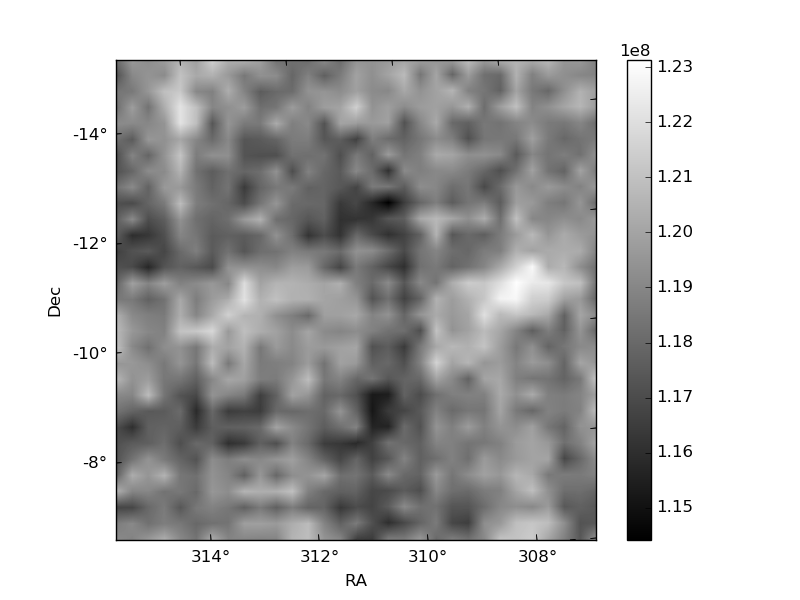
| Quadrant D | 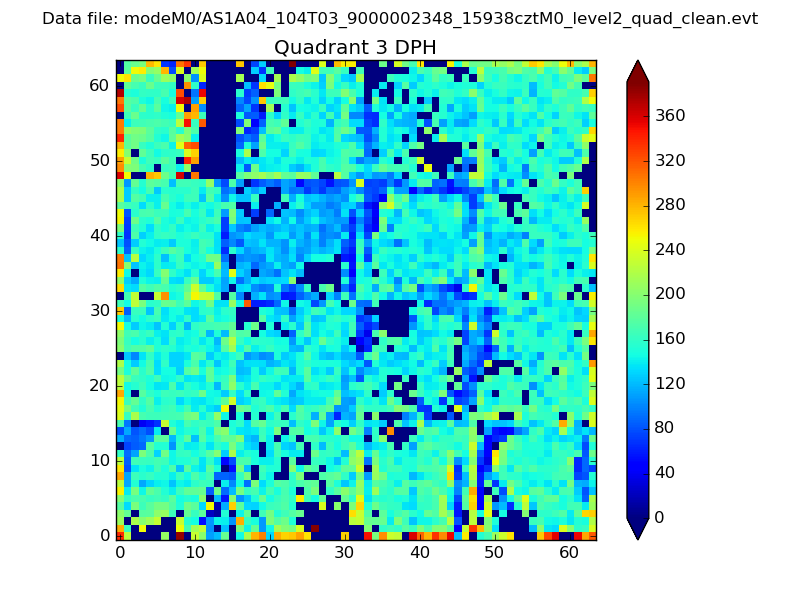 |
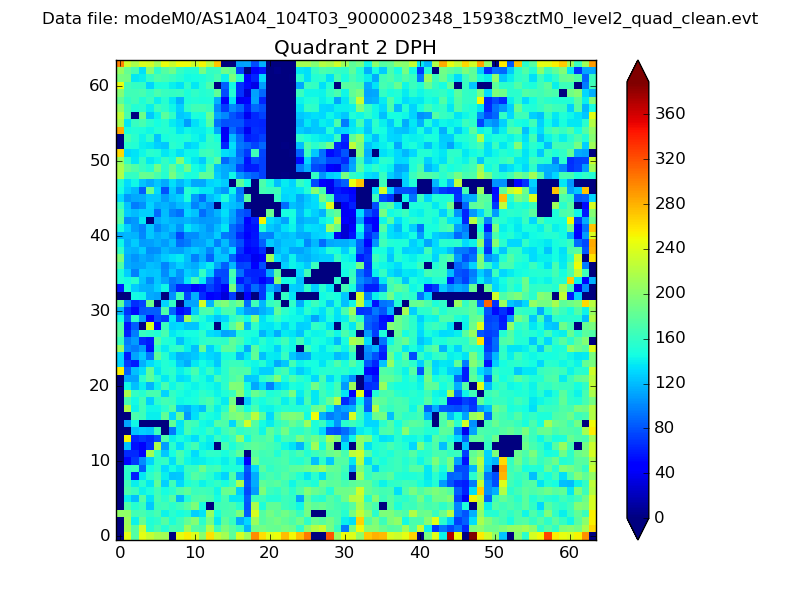 |
Quadrant C |
| Plot type | Count rate plots | Images |
|---|---|---|
| Comparison with Poisson distribution Blue bars denote a histogram of data divided into 1 sec bins. Red curve is a Poisson curve with rate = median count rate of data. |
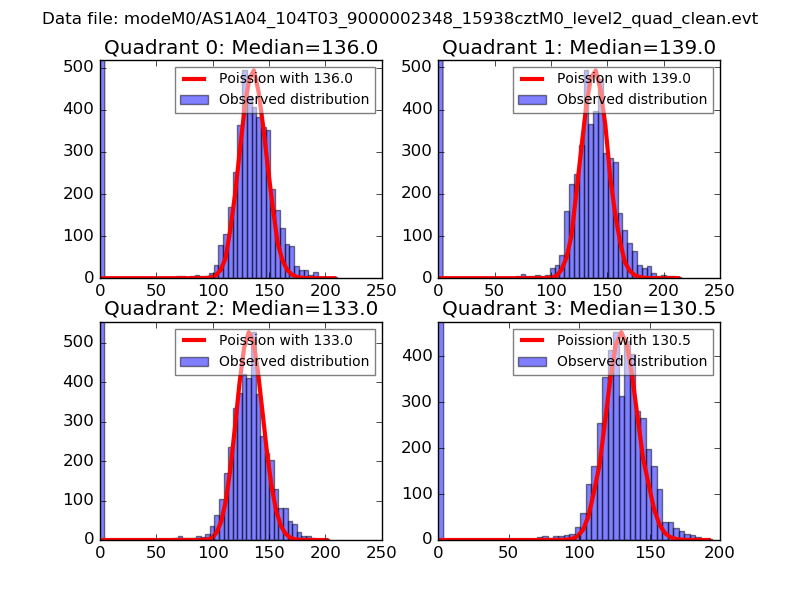 |
 |
| Quadrant-wise count rates Data is divided into 100 sec bins |
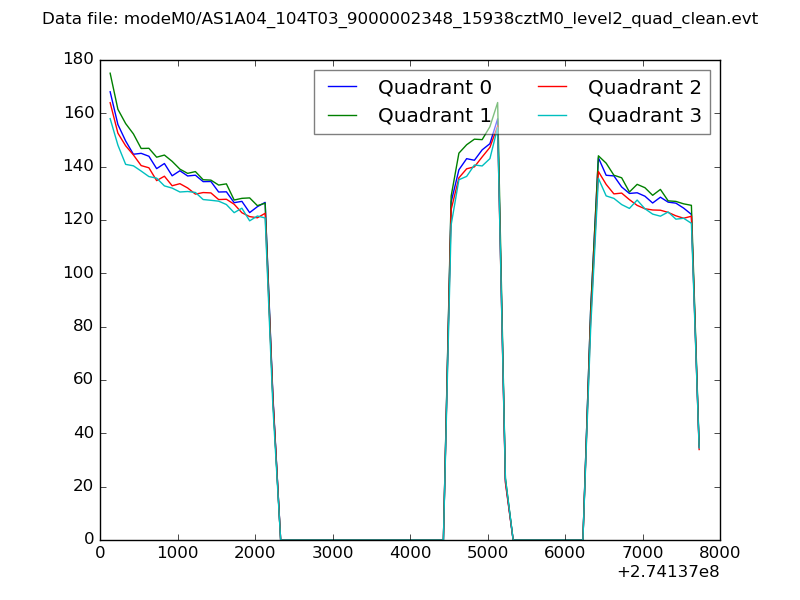 |
|
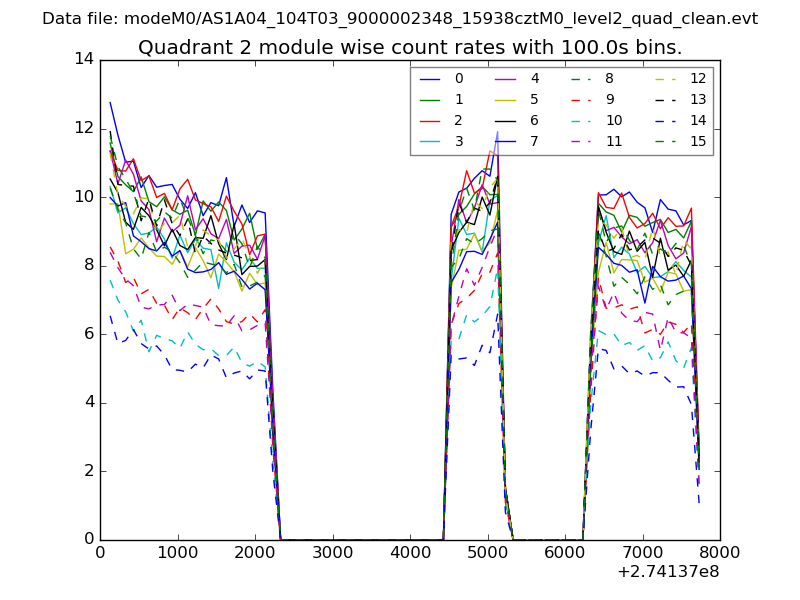
| Module-wise count rates for Quadrant A Data is divided into 100 sec bins |
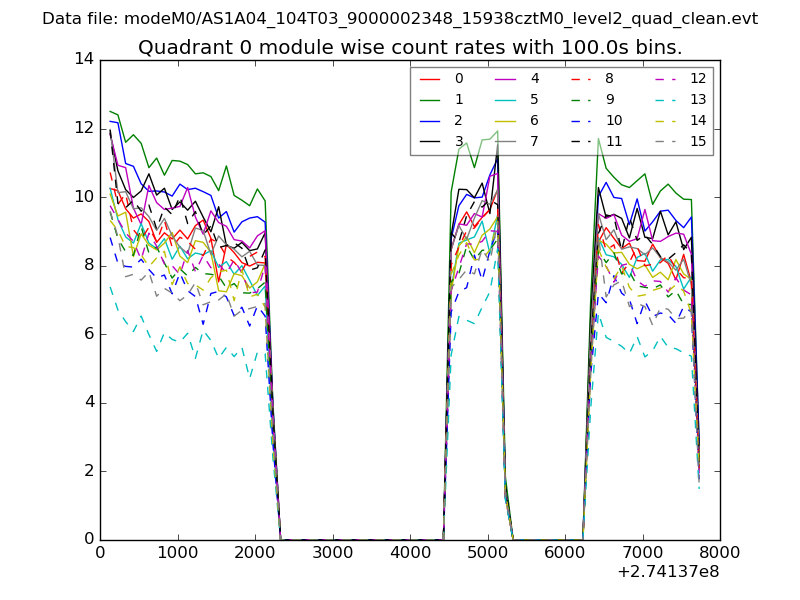 |
 |
| Module-wise count rates for Quadrant B Data is divided into 100 sec bins |
 |
 |
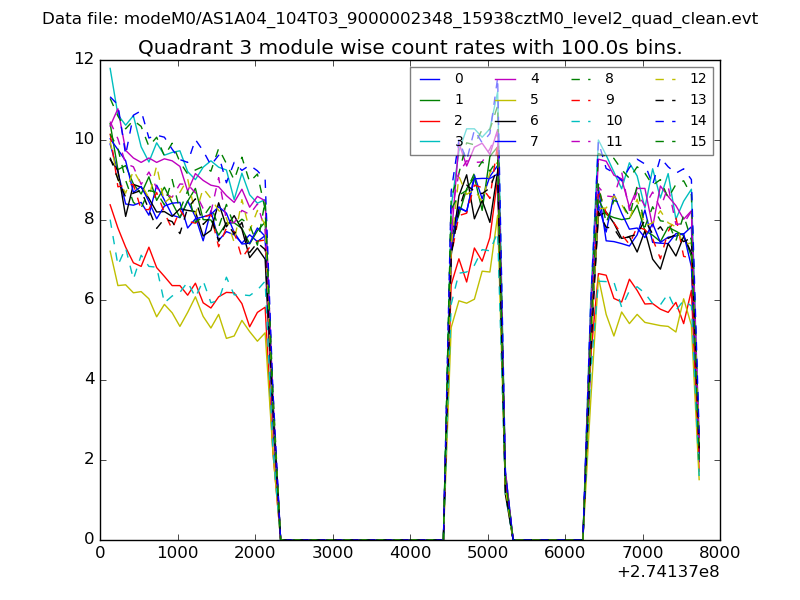
| Module-wise count rates for Quadrant C Data is divided into 100 sec bins |
 |
 |
| Module-wise count rates for Quadrant D Data is divided into 100 sec bins |
 |
 |
| Parameter | Plot |
|---|---|
| CZT HV Monitor | 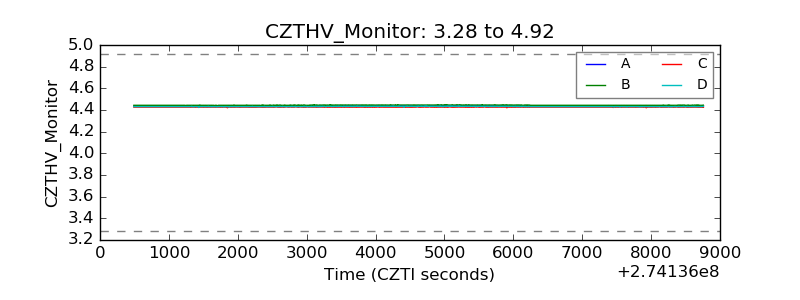 |
| D_VDD | 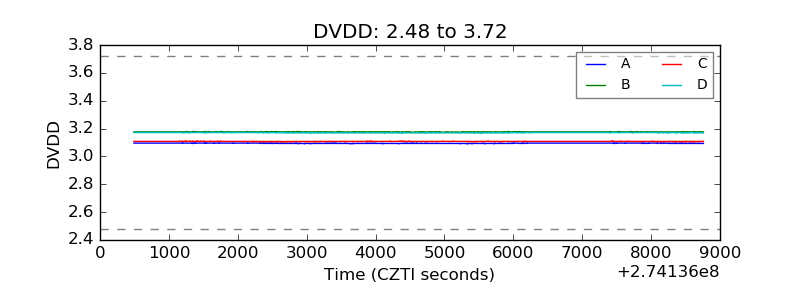 |
| Temperature 1 | 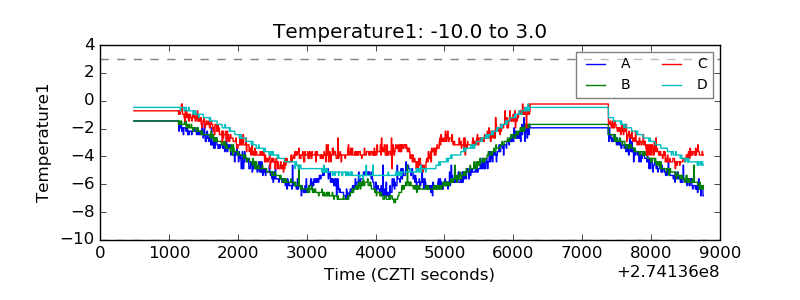 |
| Veto HV Monitor | 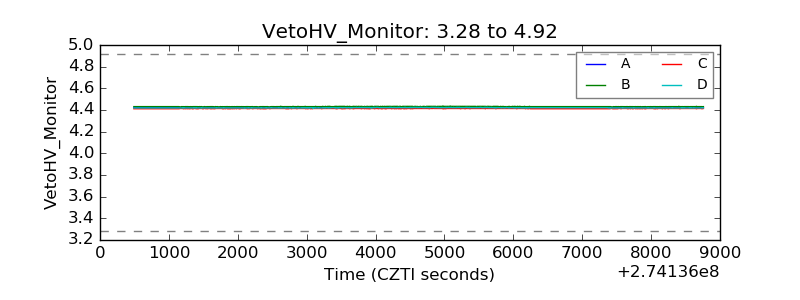 |
| Veto LLD | 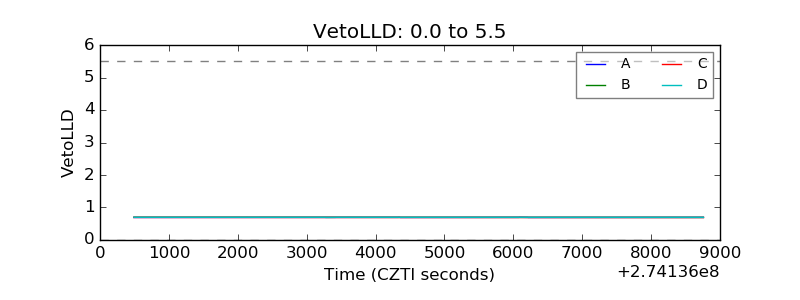 |
| Alpha Counter | 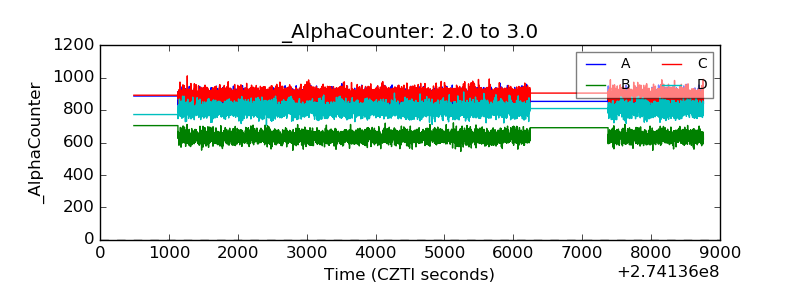 |
| _CPM_Rate | 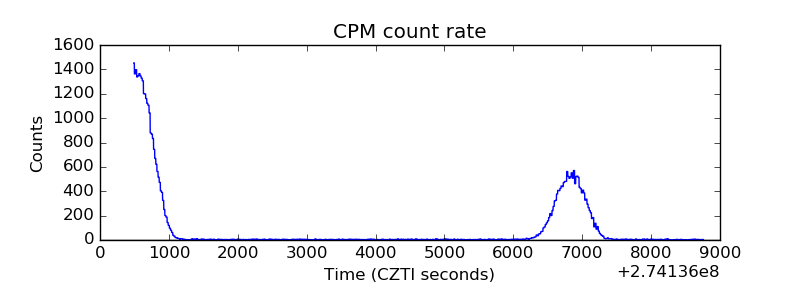 |
| CZT Counter | 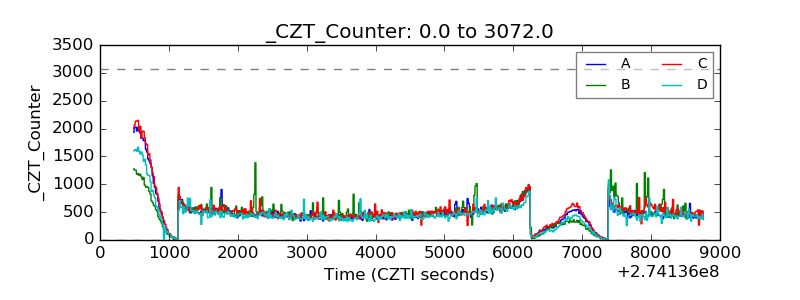 |
| +2.5 Volts monitor |  |
| +5 Volts monitor |  |
| _ROLL_ROT | 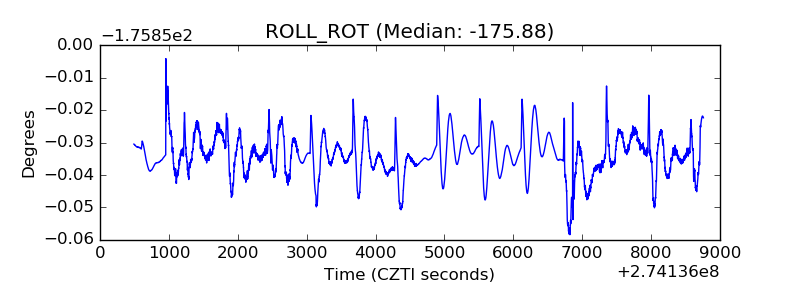 |
| _Roll_DEC |  |
| _Roll_RA | 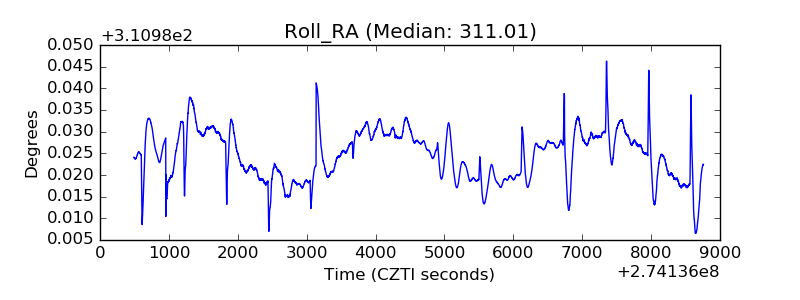 |
| Veto Counter | 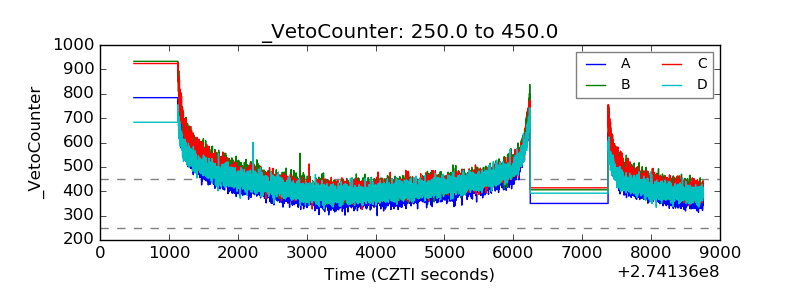 |