| Param | Original file | Final file |
|---|---|---|
| Filename | modeM0/AS1A04_104T03_9000002348_15939cztM0_level2.evt | modeM0/AS1A04_104T03_9000002348_15939cztM0_level2_quad_clean.evt |
| Size (bytes) | 492,926,400 | 96,030,720 |
| Size | 470.1 MB | 91.6 MB |
| Events in quadrant A | 3,445,312 | 613,183 |
| Events in quadrant B | 3,949,497 | 619,616 |
| Events in quadrant C | 3,626,370 | 598,747 |
| Events in quadrant D | 3,428,897 | 586,184 |
| Mode SS | |||
|---|---|---|---|
| Quadrant | BADHDUFLAG | Total packets | Discarded packets |
| A | 0 | 144 | 0 |
| B | 0 | 144 | 0 |
| C | 0 | 144 | 0 |
| D | 0 | 144 | 0 |
| Mode M9 | |||
|---|---|---|---|
| Quadrant | BADHDUFLAG | Total packets | Discarded packets |
| A | 0 | 19 | 0 |
| B | 0 | 19 | 0 |
| C | 0 | 19 | 0 |
| D | 0 | 19 | 0 |
| Mode M0 | |||
|---|---|---|---|
| Quadrant | BADHDUFLAG | Total packets | Discarded packets |
| A | 0 | 14868 | 2 |
| B | 0 | 16310 | 1 |
| C | 0 | 15166 | 1 |
| D | 0 | 15205 | 1 |
| Quadrant | Total seconds | Saturated seconds | Saturation percentage |
|---|---|---|---|
| A | 7044 | 57 | 0.809199% |
| B | 7044 | 155 | 2.200454% |
| C | 7044 | 83 | 1.178308% |
| D | 7044 | 74 | 1.050539% |
Noise dominated data is calculated using 1-second bins in cleaned event files. If a bin has >2000 counts, and if more than 50% of those come from <1% of pixels, then it is considered to be noise-dominated and hence unusable.
| Quadrant | # 1 sec bins | Bins with >0 counts | Bins with >2000 counts | High rate bins dominated by noise | Noise dominated (total time) | Noise dominated (detector-on time) | Marked lightcurve |
|---|---|---|---|---|---|---|---|
| A | 8935 | 7047 | 9 | 9 | 0.10% | 0.13% | 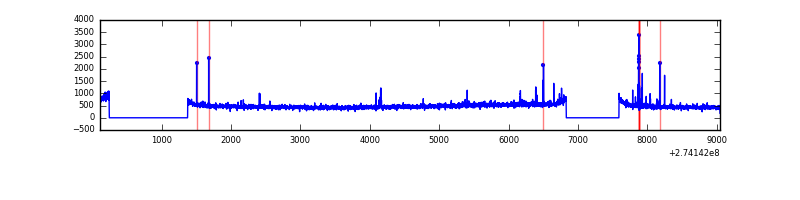 |
| B | 8935 | 7047 | 45 | 45 | 0.50% | 0.64% | 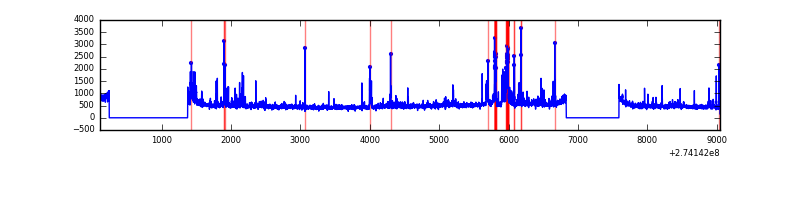 |
| C | 8935 | 7047 | 0 | 0 | 0.00% | 0.00% | 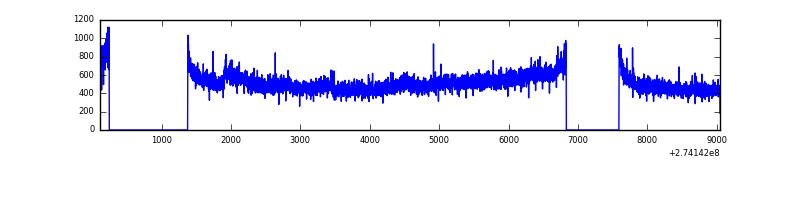 |
| D | 8935 | 7047 | 68 | 68 | 0.76% | 0.96% | 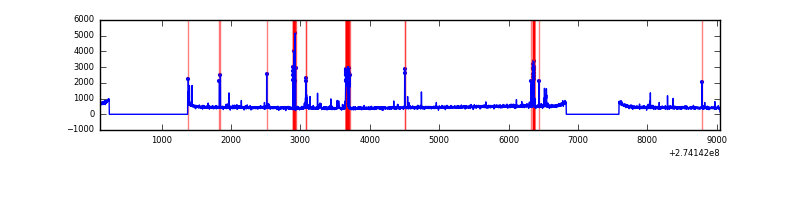 |
Top three noisy pixels from each quadrant. If the there are fewer than three noisy pixels in the level2.evt file, extra rows are filled as -1
| Pixel properties | Quadrant properties | ||||||
|---|---|---|---|---|---|---|---|
| Quadrant | DetID | PixID | Counts | Sigma | Mean | Median | Sigma |
| A | 15 | 239 | 66160 | 374.94 | 857 | 839 | 174.2 |
| A | 13 | 34 | 56205 | 317.8 | 857 | 839 | 174.2 |
| A | 13 | 210 | 14625 | 79.13 | 857 | 839 | 174.2 |
| B | 10 | 245 | 344964 | 2083.07 | 860 | 837 | 165.2 |
| B | 0 | 244 | 57121 | 340.7 | 860 | 837 | 165.2 |
| B | 4 | 142 | 41069 | 243.53 | 860 | 837 | 165.2 |
| C | 3 | 233 | 294573 | 1522.23 | 820 | 826 | 193.0 |
| C | 14 | 238 | 126526 | 651.39 | 820 | 826 | 193.0 |
| C | 7 | 247 | 6282 | 28.27 | 820 | 826 | 193.0 |
| D | 2 | 33 | 174098 | 845.99 | 827 | 802 | 204.8 |
| D | 15 | 0 | 75614 | 365.21 | 827 | 802 | 204.8 |
| D | 2 | 234 | 30154 | 143.29 | 827 | 802 | 204.8 |
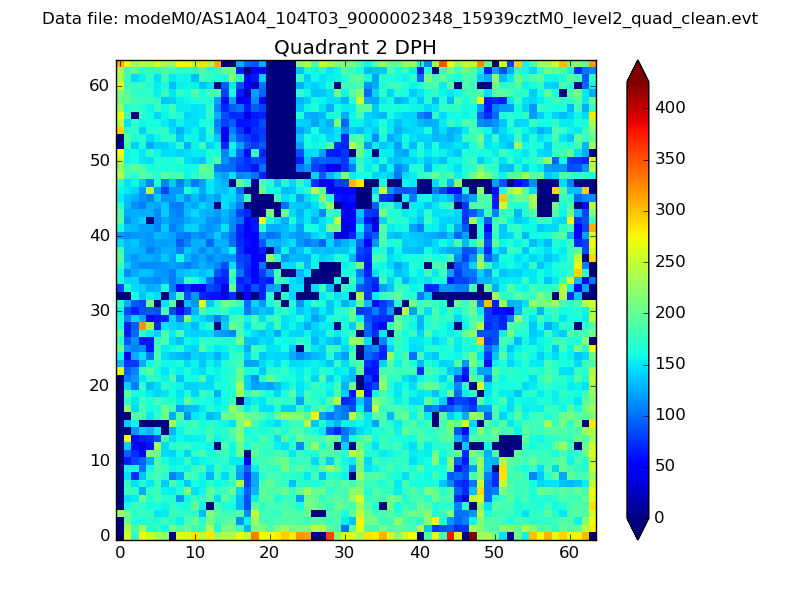
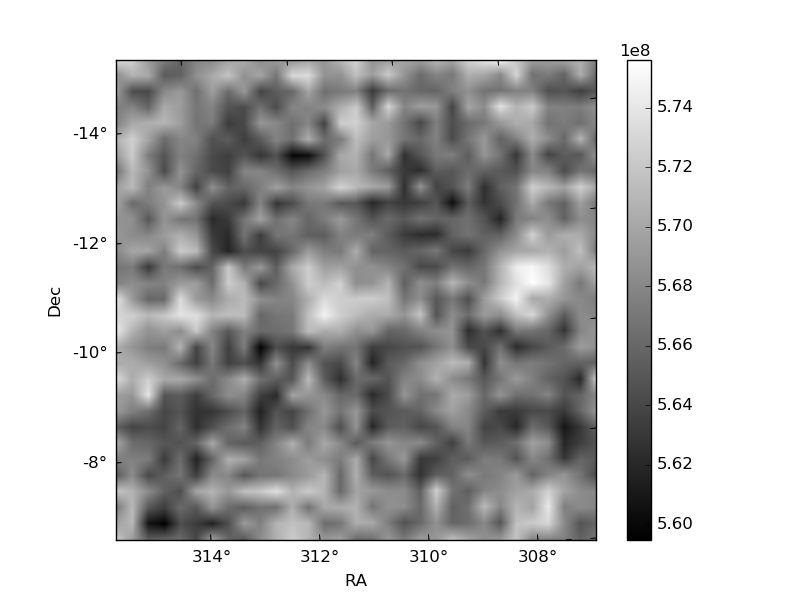
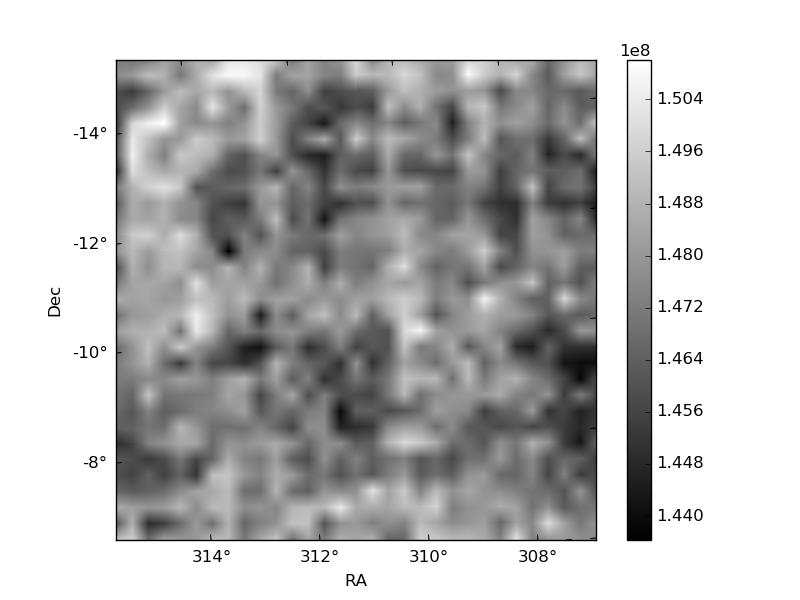
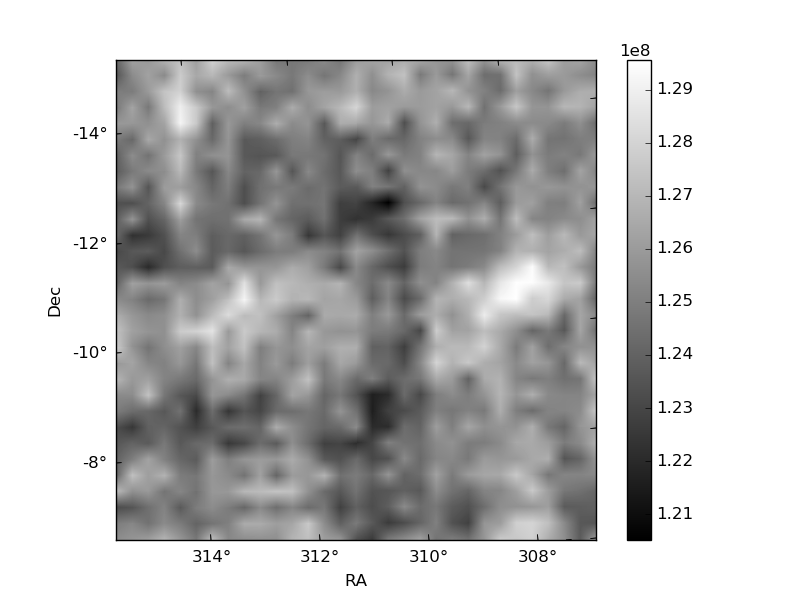
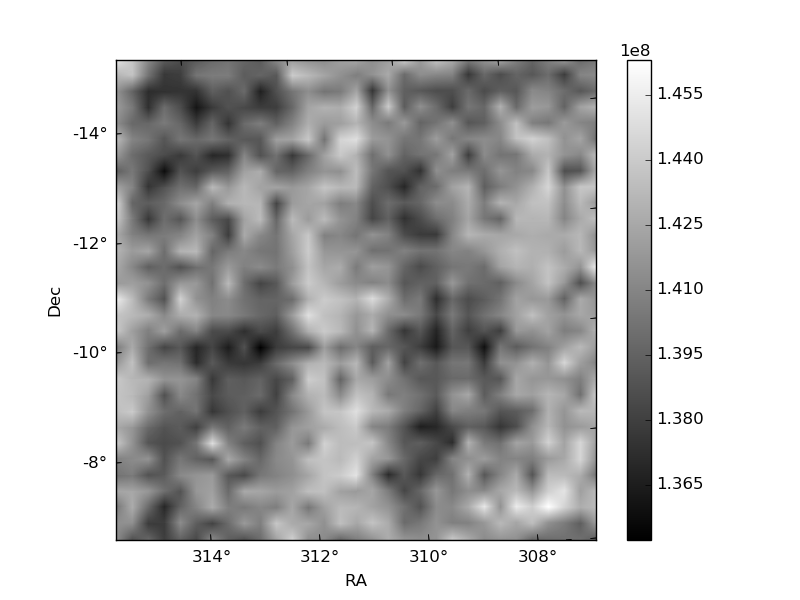
Histogram calculated using DETX and DETY for each event in the final _common_clean file
| Quadrant A | 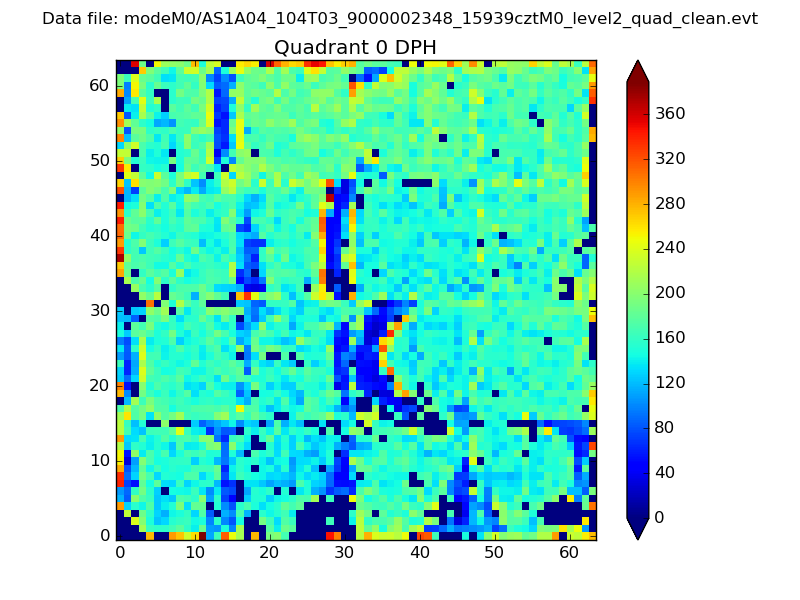 |
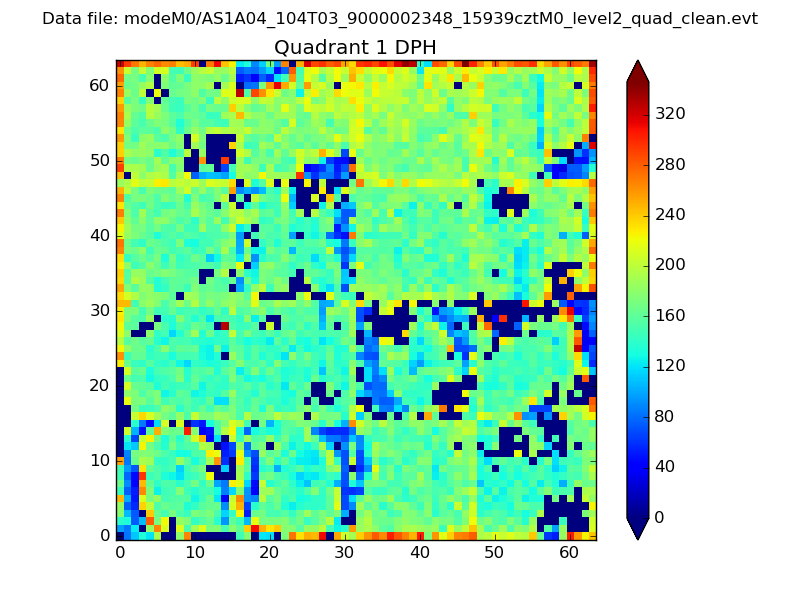 |
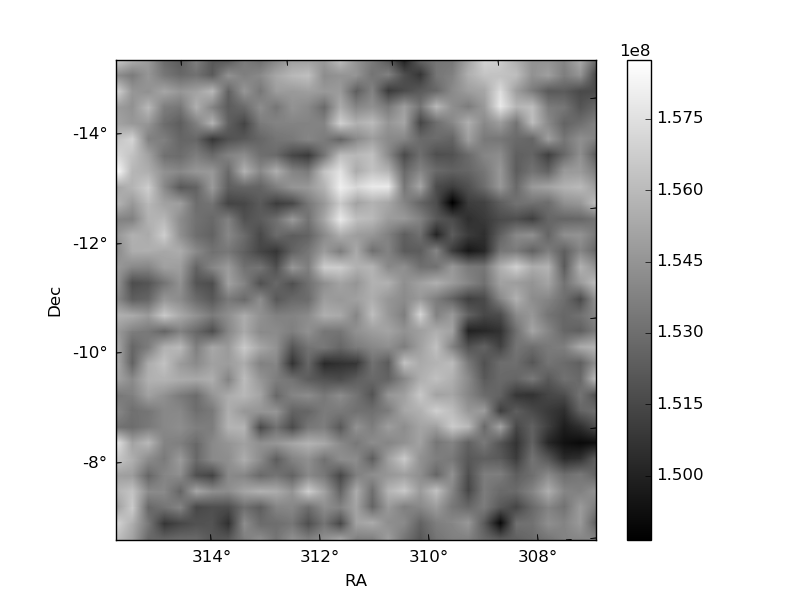
Quadrant B |
|---|---|---|---|
| Quadrant D | 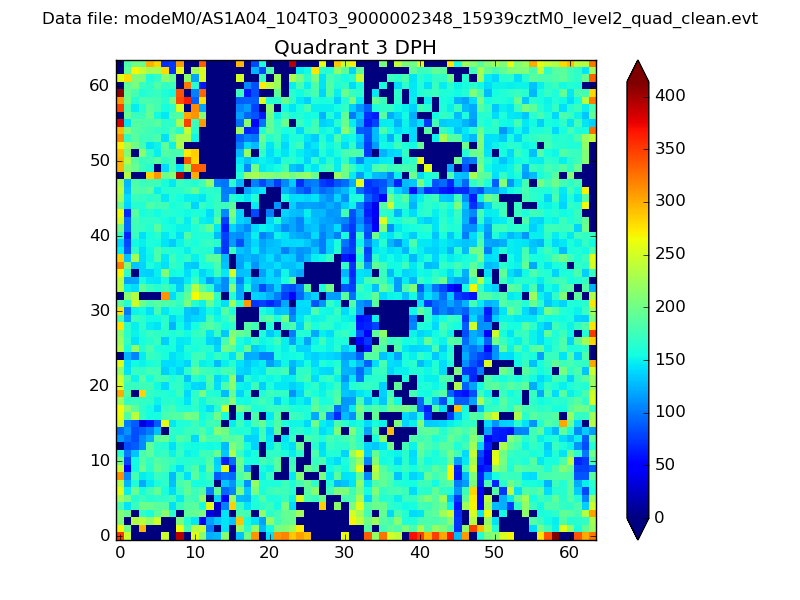 |
 |
Quadrant C |
| Plot type | Count rate plots | Images |
|---|---|---|
| Comparison with Poisson distribution Blue bars denote a histogram of data divided into 1 sec bins. Red curve is a Poisson curve with rate = median count rate of data. |
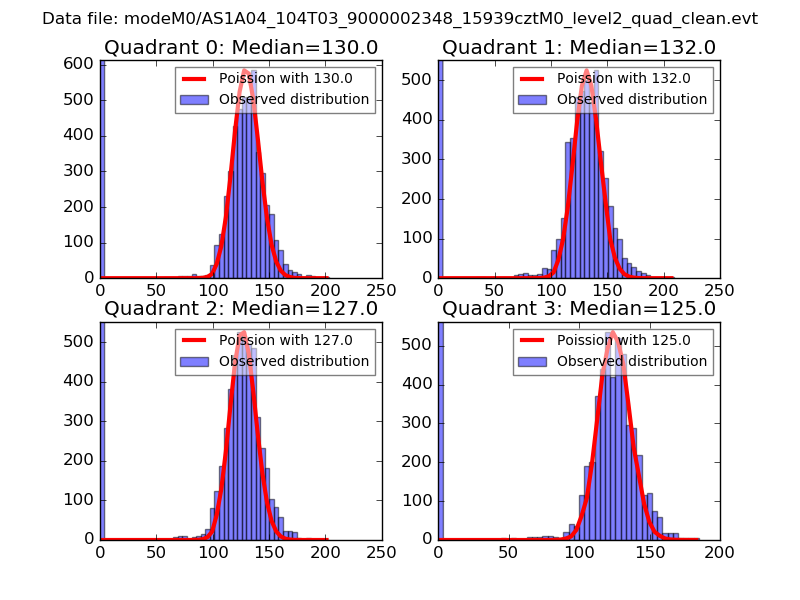 |
 |
| Quadrant-wise count rates Data is divided into 100 sec bins |
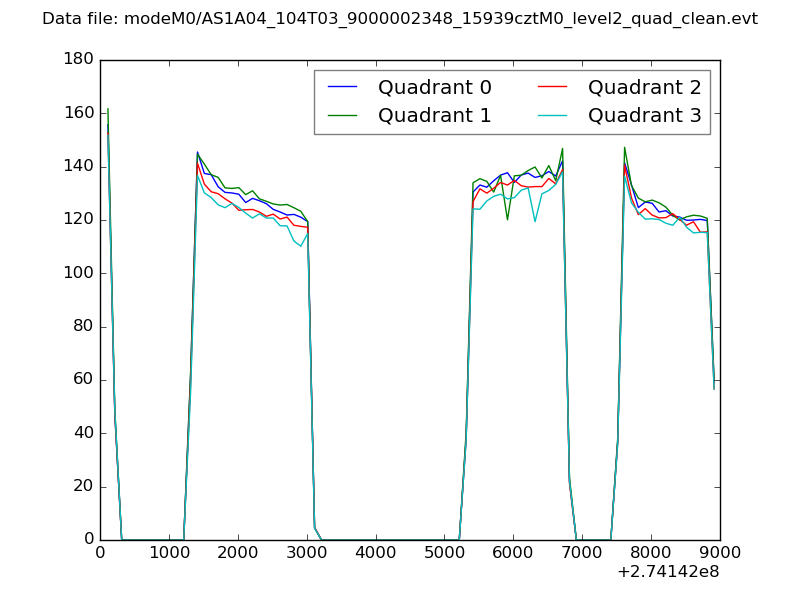 |
|
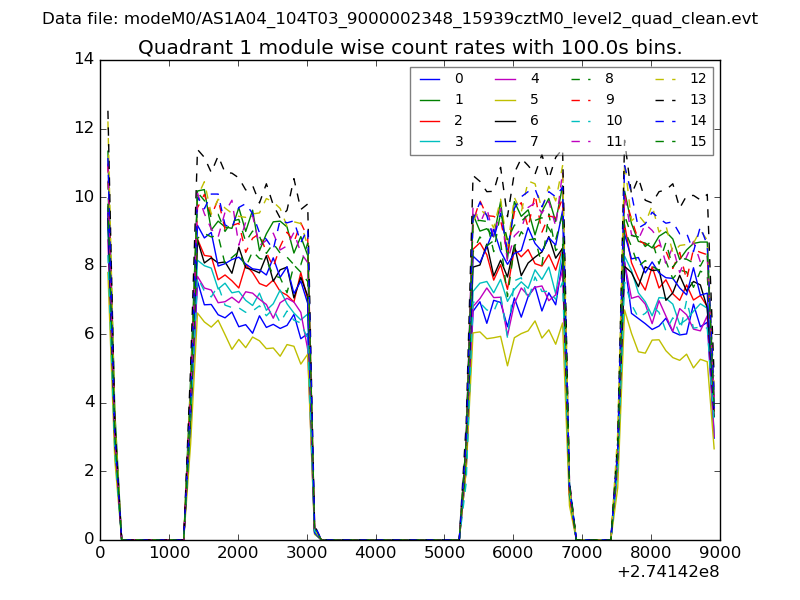
| Module-wise count rates for Quadrant A Data is divided into 100 sec bins |
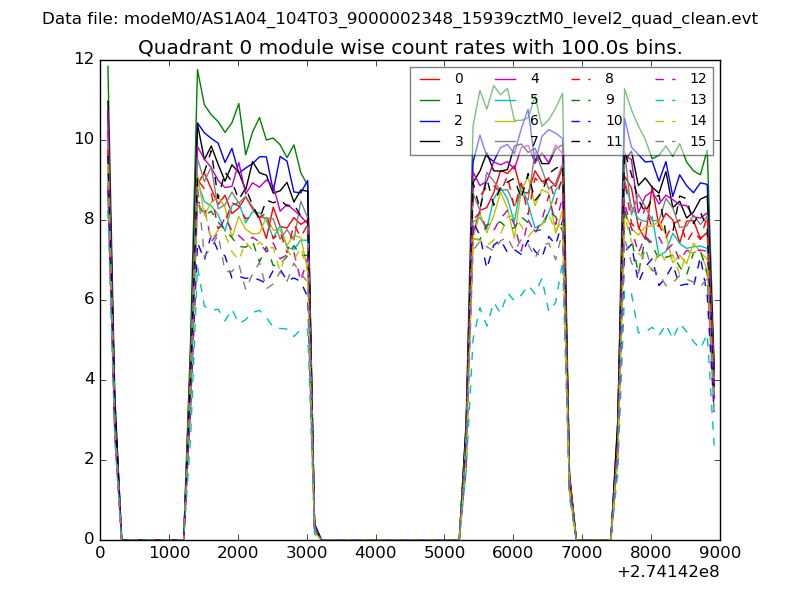 |
 |
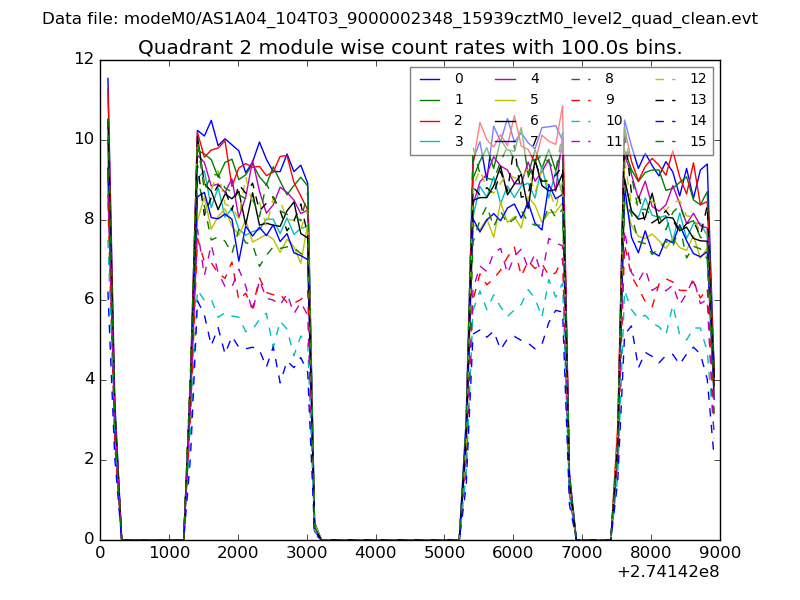
| Module-wise count rates for Quadrant B Data is divided into 100 sec bins |
 |
 |
| Module-wise count rates for Quadrant C Data is divided into 100 sec bins |
 |
 |
| Module-wise count rates for Quadrant D Data is divided into 100 sec bins |
 |
 |
| Parameter | Plot |
|---|---|
| CZT HV Monitor | 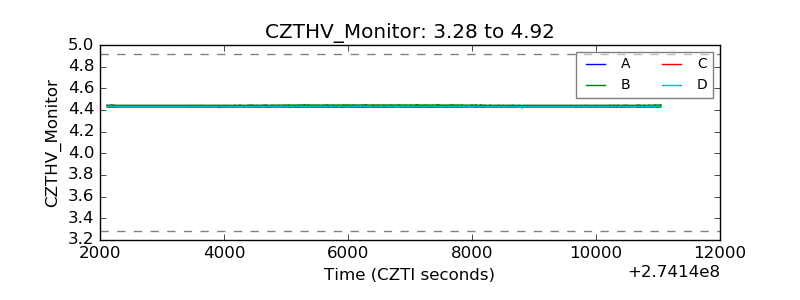 |
| D_VDD | 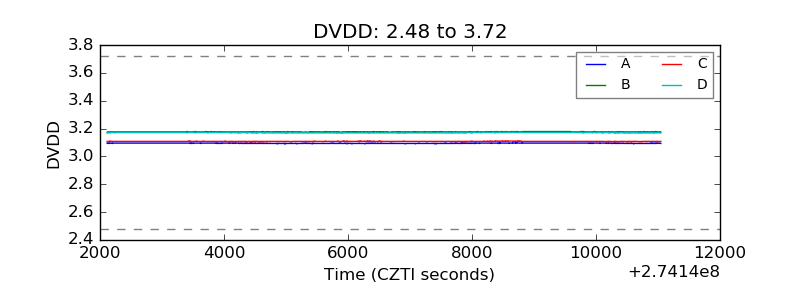 |
| Temperature 1 |  |
| Veto HV Monitor | 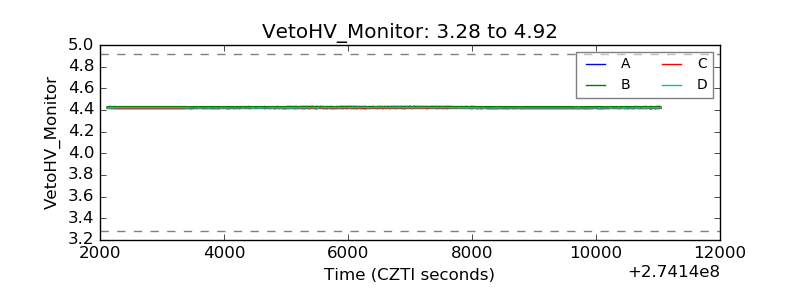 |
| Veto LLD | 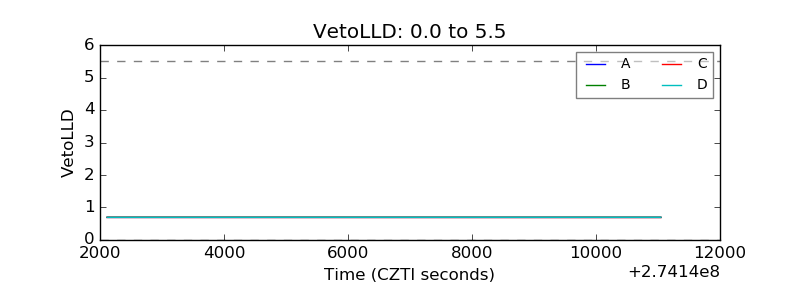 |
| Alpha Counter | 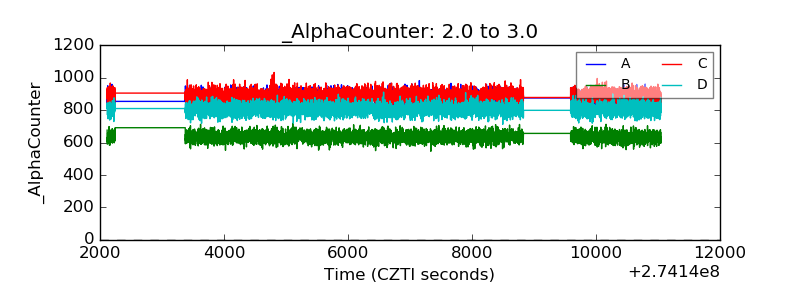 |
| _CPM_Rate | 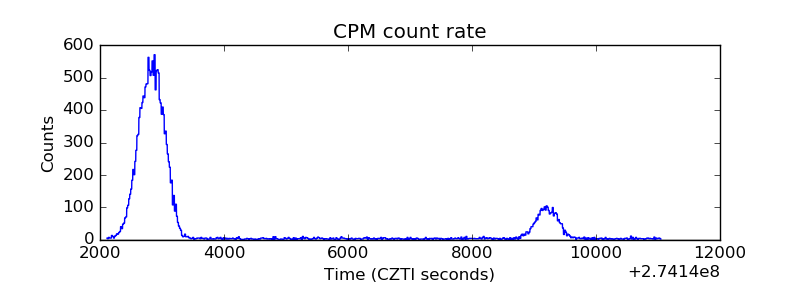 |
| CZT Counter | 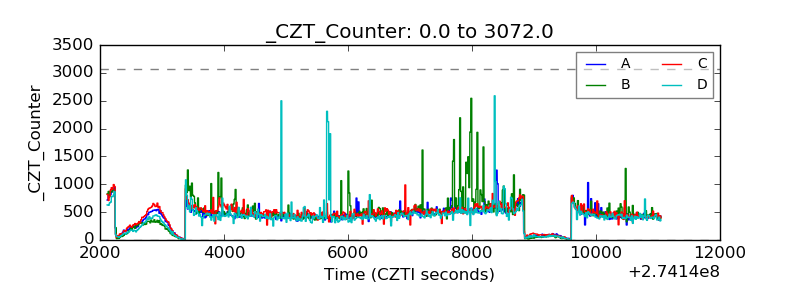 |
| +2.5 Volts monitor |  |
| +5 Volts monitor |  |
| _ROLL_ROT | 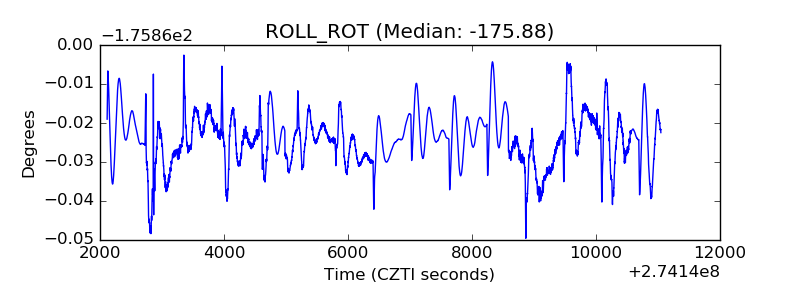 |
| _Roll_DEC |  |
| _Roll_RA | 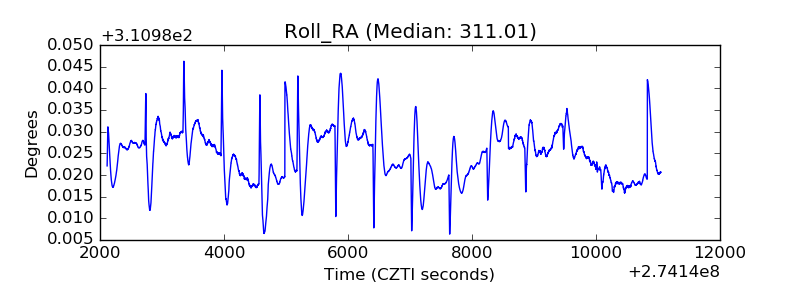 |
| Veto Counter | 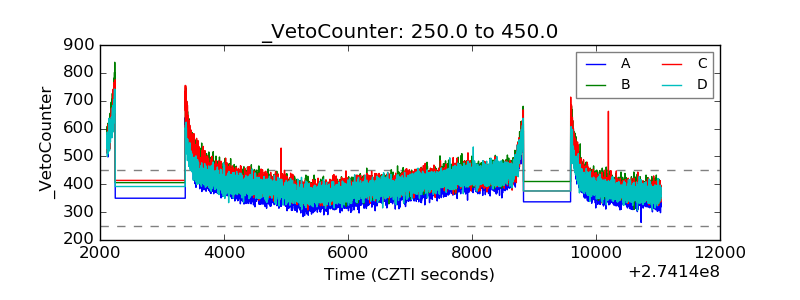 |